Trend and Momentum DashboardI created this indicator to tell me when it's time to trade (going long) and when it's time to wait (or going short).
You can enter up to 13 ticker (default is S&P500 and key market segments).
For each ticker, fibonacci levels are calculated and represented either in 5 color or 3 color mode as single lines.
(Thanks to eykpunter for the fibonacci level implementation. I'm using his code and modified it slightly).
Color coding (5 color mode) explanation:
blue = in uptrend area
light blue = in prudent buyers area
gray = in center area
light red = in prudent sellers area
red = in downtrend area
The topline is a combination of all ticker and shows if the market is either bullish or bearish (threshold adjustable in settings)
The bullish/bearish trend can also be used as background color. Alternatively the last bar in the selected time period is been highlighted.
How to use it:
The indicator works on all timeframes. Use the color coding explanation above to see the status of each asset.
a) You can evaluate "long" term trend using day or week timeframe. e.g. I'm usually trading only long and stay out of the market when it is not bullish (top line & background = blue). I'm also using it to know which segments/assets are currently "hot".
b) You can evaluate short term momentum (using 1h or lower timeframe) and see in which direction the market/assets are moving. e.g. I use this when the exchanges open to see how the day is going to move.
I've attached 3 examples in the screenshot - first is the default, in the second one I'm using different asset classes and the third one is for crypto.
Limitations:
There are security request limits as well as string limitations for the security calls in pine script, so I went to the maximum what is currently possible.
(No financial advise, for testing purposes only)
"trend" için komut dosyalarını ara

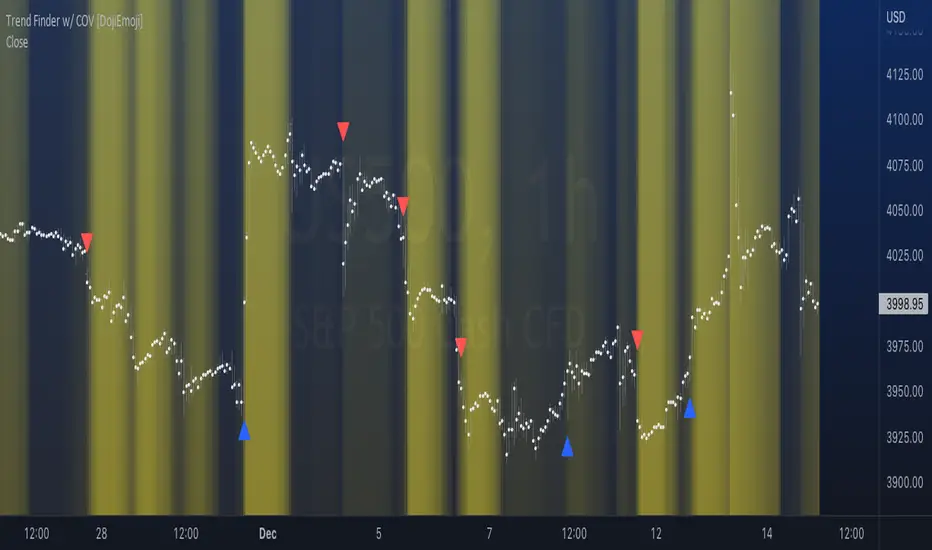
Trend Finder with Coefficient of VariationCoefficient of variation (“COV”) is a statistical measure used to describe the variability of values within a data set, it’s calculated by taking the standard deviation divided by the mean.
Traditionally, COV is applied to the expected returns of competing investment portfolios. A risk adverse investor prefers to accept a portfolio with a relatively lower COV value.
On the other hand, when applying COV to price charts, the difference is that instead of looking at expected returns, we now treat price as the source of data. We look at price from a moving average perspective. This script purely focuses on price.
What this indicator does:
Firstly, to go over the parameters:
Let ‘n’ be the lookback period for computing COV, and ‘m’ be the period for comparing the ranking of COVs.
Logics in a nutshell:
This program will (A) calculate the COV by dividing the moving standard deviation by moving average over ‘n’ bars, and then (B) illustrate the relationship of how COV at each bar ranks compared to COVs over past ‘m’ bars. We use a color scale (default black and yellow) for visualizing ranking in terms of percentiles. If COV is below its median value, then we assume that price is consolidating.
Hypothesis:
Using COV on top of regular SMA signals should reduce a lot of unwanted noise such as consecutive crossovers during ranging-periods. Traders want volatility, but not too much of it when sniping for entry opportunities (speaking of initial position; need to add to winning positions after, but this is for another topic). For this reason, the median value of COV is suitable as a metric for signals.
Applications:
We use the median value of COV to form a decision rule. A signal is generated when COV > median(COV,m), and the direction of trend is determined based on relative position of price with respect to sma(price,n). When the value of COV is increasing, it can also be thought of seeing Bollinger Bands beginning to bulge. When trends begin, this program will plot triangles to signify entry opportunities.
Trend/Retracement - ZigZag - New wayZigZag for Trend and Retracements - New way
It's another way to plot ZigZag based on lookback period for trend and % of trend lookback period to plot retracements.
█ OVERVIEW
Plot ZigZag, Trend lines, Retracements, Support levels, Resistance levels
█ Objective:
Draw ZigZag lines along with unbroken support and resistance levels. ZigZag lines are drawn for main trend and the retracements.
Main Trend – This is calculated based on lookback period.
Retracements – Retracements are calculated as 25% of main trend.
Support and Resistance line: The indicator draws 2 types of support and resistance lines
1. Un-broken – Once formed (plotted), these are the support and resistance which are not yet broken
2. Tested – One can also choose to see support and resistance lines which are tested but not broken. Tested support/resistance are those levels which are touched by high/low price but close price has not crossed the level.
█ How main trend point is calculated:
E.g.
Chart timeframe = 15m
Lookback period = 250
Retracement = 25% of main trend ( 25% of 250 = 62 )
A price point on a chart is considered as trend point if distance between current price and previous highest price is 250 candles
A price point is considered as a retracement if distance between current price and previous highest price is 62 candles. Please note retracements are calculated only after finding a main trend point.
█ Input parameters:
Zigzag Parameters
Use predefined Lookback – If checked pre-defined timeframe-based lookback parameters are used.
Trend lookback candles – If ‘Use predefined Lookback’ is unchecked then this value is used as lookback period.
Retracement % of look back candles– If ‘Use predefined Lookback’ is unchecked then this value is used for calculating retracement lookback period
Mark retracements – If unchecked only main trend lines are plotted
Plot support/resistance – To plot support/resistance levels
Show support/resistance tested lines – If checked tested support/resistance liens are shown on the chart
█ TF based Lookback period config (Defaults are set as specified below, One can change these defaults to use different lookback periods)
The defaults set here are used based on the chart timeframe. e.g. if chart timeframe is changed from say 15m to 60m then 60m chart defaults (i.e. trend lookback = 90) are used to plot the trend and the retracements. At the bottom-right of the chart, parameters used for plotting are displayed all the time.
Timeframe in minute – Default = 5m
Trend lookback candles – Default = 375 (~ 5 days of data)
Timeframe in minute – Default = 15m
Trend lookback candles – Default = 250 (~10 days of data)
Timeframe in minute – Default = 60m
Trend lookback candles = Default = 90 (~ 15 days of data)
Trend lookback candles for timeframe 'D' – Default = 30 (~1 month data)
Trend lookback candles for timeframe 'W' – Default = 21 (~6 months data)
Trend lookback candles for timeframe 'M' – Default = 12 (~1year data)
Retracement % of look back candles – Default = 25%
█ When and where one can use this indicator (Refer to chart examples)
To view support and resistance based on lookback period
To view ZigZag lines
One can use it to find chart patterns easily
Trend and retracement lines can help in drawing Elliott waves.
█ Chart examples:
1. Chart patterns can be easily identified - One can disable the candle charts which will help to identify and draw chart patterns easily
2. Trend and retracement lines can also help is analyzing charts (e.g. Elliott Waves can be marked based on trend lines)
3. Tested but not broken support and resistance lines can be viewed
4. You can select 'NOT' to plot tested support and resistance lines
5. Uncheck the Mark retracements to plot main trend lines (Retracements are not marked)

Donchian with Trend IndicatorStandard Donchian Channels, this includes a Trend EMA which can be configured and the channels will use to give buy and sell signals. The channels are also colored in such a way to indicate a trend reversal. My favorite part that sets this apart from others is, if using the bClose option (which I recommend you do) the trend will not reverse until there is a close above/below the previous channel high/low. i.e. a reversal into an uptrend requires the current bar to close above the previous upper channel rather than just a new high.
The coloring of the current trend allows for a quick read of current market conditions and I use this on any timeframe across all forms of charts (forex stock, futures, crypto, etc). When taking one of the signals I use the opposite channel as the stop loss (when buying use bottom, and selling use top channel)

On Balance Volume Trend© 2022, CryptoNaut1000
An extension to "On Balance Volume Momentum (OBV Momentum)".
"OBV Trend" is a trend strength indicator, that can be used to identify strong trends and also trend changes based on volume.
High positive values indicate strong volume on the buy side, high negative values indicate strong volume on the sell side.
An increasing OBV trend indicates a strengthening buy trend or a weakening sell trend,
decreasing OBV trend indicates a strengthening sell trend or weakening buy trend.
OBV trend is calculated by plotting a short vs. a long moving average and filling the difference in volume.
OBV trend metric is absolute volume.

Trend & Momentum V2Declutter your charts. Simple indicator combining trend and momentum using Moving Average (currently default to 9-day EMA) and RSI (default length of 8). A long signal is generated when the price closes above the moving average and the moving average color turns red to green which indicated that the momentum measured using RSI is greater than 50. A short signal is generated when the price closes below the moving average and the moving average color turns green to red indicating RSI is below 50. Confirmation is done if there is no reversal on the next candle. For best results use multiple timeframe charts to trade on the right side of trend and momentum.

Aarika Balance of Power Trend (ABOPC)Hello traders, this is Balance of Power. We have modified some levels to easily identify the trend of the symbol. This will work on any symbol and on any timeframe!
How to trade based on ABOPC:
1) When BOP is above 0.00 line it indicates a Bull trend and below 0.00 level means a bearish trend may come in action.
2) If BOP line is at 0.10 level, it means there is a 50% chance of reversal
3) If BOP line is 0.20 level, it suggests 90% chance of reversal or sideways market.
We highly recommend not to trade solely based on this indicator, rather use this as a supportive or double confirmation indicator for study purpose.
Thanks.
Disclaimer: This indicator was not created by us but we only modified it for study purpose.

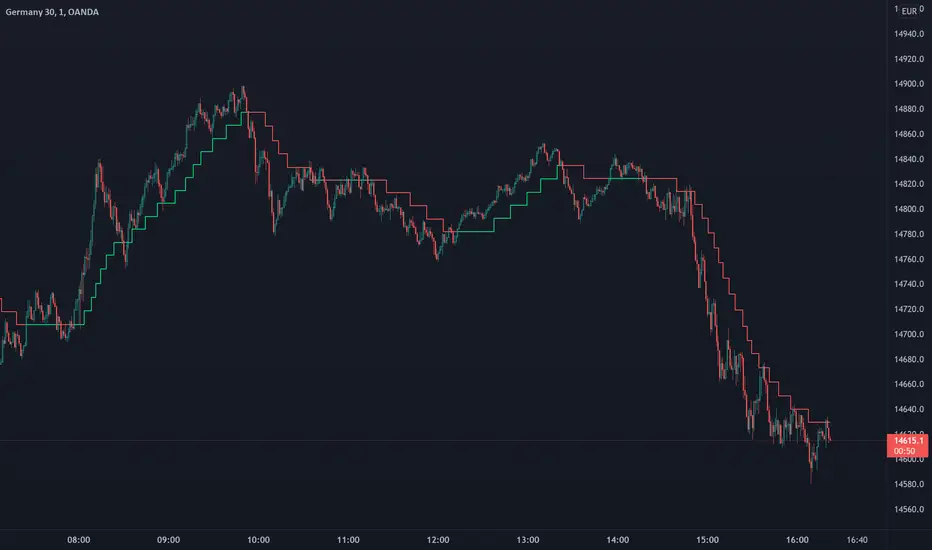
Trend Step - TrailingTrend Step - Trailing Stop is a moving average-based trailing stop that moves in pre-defined steps. In this way, the user can set the number of pips/points they want the trailing to move in relation to the movements in the average. You can also see it as trend steps. Every step represents the trend movement.
Usage
Use it as a trailing stop or as a trend direction tool.
Disclaimer: No financial advice, only for educational/entertainment purposes.
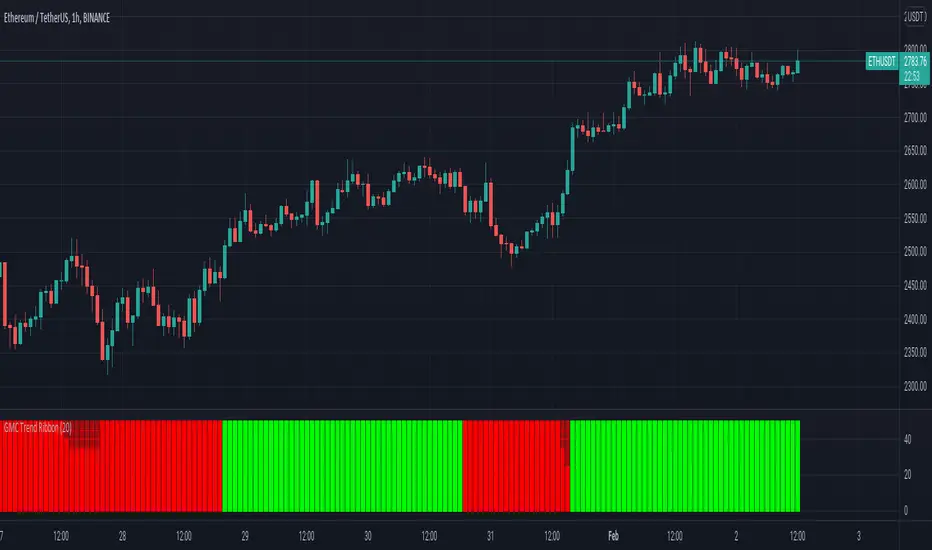
GMC Trend FilterAvoid Fake Signals, and identify the trend.
How it works ?
- it calculates main trend direction by using the length that is user-defined. so you can change it as you wish
- then it calculates trend direction for each 9 lower lengths. if you set the length = 20 then the lengths are 19, 18,...11
- and it checks if the trend directions that came from lower lengths is same or not with main trend direction.
- it changes the trend color of the ribbon.
Trend Volatility Tops and Bottoms
Big Picture:
Overall what this script try's to capture is bounces off of moving trend lines.
What you will see when using this script
one Green line, one red line, two gray lines and circles in colors blue, green, red, and purple.
RED AND GREEN LINES:
There are two trend lines, an upper and a lower line that are 1 to 2 standard deviations from the linear regression line formed by the closing price for a look back period. The green is the distance from the close price and the lower line. The red is the list from the close and the upper line. (you don't see the lower and upper lines, but yo do see the green and red lines)
The goal is too easily see when price is approaching those support and resistance levels.
GRAY LINES:
GRAY lines are a form of volatility metric. GRAYS represent the distance from the RED and GREEN lines talked about above. low volatility mean the two GRAY lines will be close and times of high volatility will be father apart.
COLORED CIRCLES:
the color circles represent possible bounce zones, when price is high or low for for a given time period.
PURPLE is caution that there could be a possible price drop
RED is a critical zone for rejection and price drop
BLUE is caution that there could be a possible price increase
GREEN is a critical zone for bounce and price increase
how its used
feel free to play around and Try new things but, how its intended to be used is on 4hr time Frame looking for longer term trends on assets that tend to be less volatile on average.
settings
some settings:
buy deviation, this will say how many standard deviations do you want the lower bounce line to be from the linear regression line
sell deviation, this will say how many standard deviations do you want the upper bounce line to be from the linear regression line
dist to zero buy: how close dose the price has to be to put out a possible bounce.
Recap
-red and purple = possible upcoming price drop... red is more critical than purple
-green and blue = possible upcoming price increase... green is more critical than blue
-use on less volatile assents and on 4hr timeframe
good luck!

Retail Insider Trend Following (HTF ONLY)Before I begin, here is a disclaimer: None of this is financial advice, and I'll recommend you to do your own research or talk to your financial advisor, if you want to use this. And also make sure you understand the risks properly before taking any trades. This particular indicator is a work of experiment, and I am publishing the optimized code. Please leave a comment below if you have any queries.
As per the logic, I am taking the highest point in a particular time window (used the in built ta.highest function) , and the lowest point in a particular time window (used the ta.lowest), and averaged it using the in built function (
RMA(which is the B33 Mean.)
For the offset, I am simply calculating and adding some values (which can also be input by the user.)
and this user input is in percentage.
So if you observe the lines, the Red line in between is the mean, and the Yellow lines are the offsets. (Everything can be changed in settings)
In simple layperson terms, if the price goes above the Red line, it's an uptrend,
and if the price goes below the Red line, it is in a downtrend.
Now I just wanted to keep the offset because I wanted more confirmation before actually entering a trade. (the offset can be changed again, from the settings, and the offset is in percentage)
A lot of times, you will see that the price is kind of going sideways, where, a lot of traders get trapped, as there is no clear trend.
So in order to eliminate that choppy price action and stay out, I'm using this offset. This should probably save a lot of bad trades.
So basically, if the price goes and closes above the higher offset, it will confirm a trend change, and a possible bull market.
Similarly, if the price goes and closes below the lower offset, it will confirm the end of the bull market, or a corrective phase, or a bear market.
A few things to note, however...
If you change the timeframe, you will see that the lines are not shifting/changing that much. This is because, it will consider the highest and the lowest points and average it.
So, basically, if you do the math, you will understand why,... and this logic is purely for a higher timeframe analysis/confirmation.
I'll personally recommend this kind of a setup for swing trading/confirmation on the daily or the 4H charts, mostly for longer timeframes. (If you are on the pro/pro+ or premium, you can try out 6H or 12H timeframes as well)
If you are looking for scalping, setups and indicators, this is not the right one.
If you liked it, don't forget to give a follow :)

Kijun Trend IndicatorName: Kijun Trend Indicator
Category: Trend Analysis
Timeframe: All timeframes
Suggested usage: In a trending market, to understand when it is good to enter short (red line) and when to enter long (blue line).
Technical Analysis: The original idea was taken from Larry Williams: an uptrend is identified when the price is above an 18-period simple moving average (SMA) and when at least two candles do not touch the simple moving average with their lows. The opposite is true for a downtrend.
Corrado Rondelli has therefore reinterpreted with Ichimoku aka "ichimokized" replacing the 18-period Simple Moving Average with the 26-period Kijun - as per the original Ichimoku settings.
In order to make the indicator more flexible an Exponential Moving Average (EMA) has also been added.
The indicator plots the chosen line that becomes red when it is good to enter short and blue when it is good to enter long.
Configuration:
- Length: period to be used to calculate the line.
- Type: the line type that can be the Kijun (26-period) or SMA/EMA (18-period)

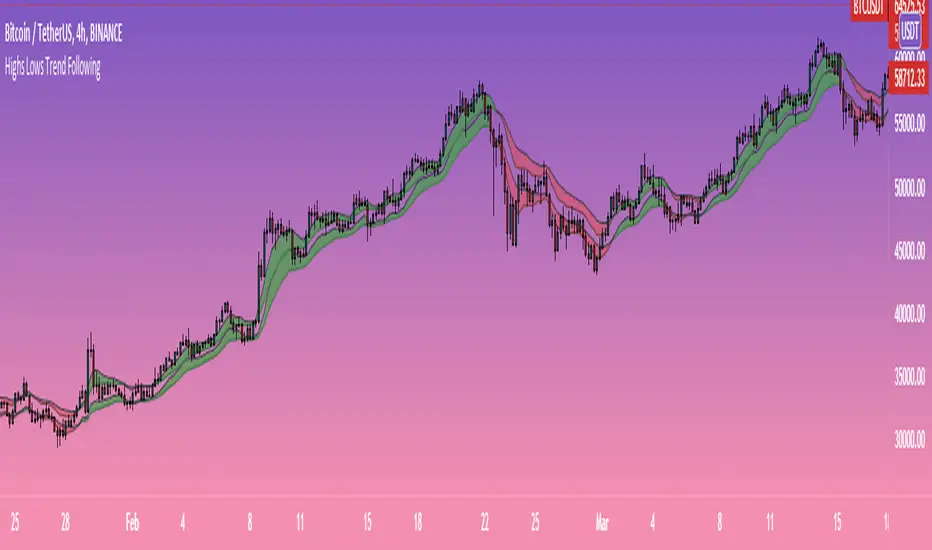
Highs-Lows Bands Trend FollowingTwo bands formed by moving averages of highs and lows.
The lower band should provide zone of support in uptrends while the upper band should provide zone of resistance during downtrends.
Bands that turn green in bullish trends should provide buy signals while bands that turn red in bearish trends should provide sell signals.
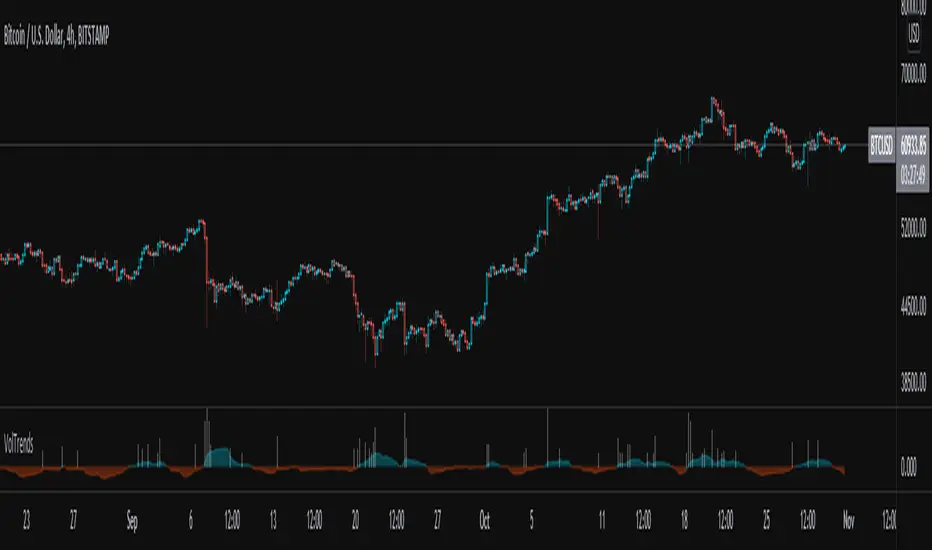
Volume TrendsThis script provides clear volume trends on any time frame. You set a long term volume trend moving average (ex 100 periods). A shorter term MA of your choice (10 in this example) will oscillate above and below based on the standard deviations of its current value relative to the long term #.
Similarly, large volume bars are plotted in terms of st dev above the long term MA.
Very useful in spotting capitulation bottoms and/or blow-off tops.
Trend System Oscillator Averages RatingThis is a trend system made with multiple oscillator averages designed especially for trending markets such as stocks or crypto.
It can be used with any timeframe.
Its made of multiple moving oscillators such as
RSI
Stochastic
ADX
CCI
AO
MACD
MOM
STOCH RSI
WPR
BP
UO
Avg of all oscillators
It has also a rating, making an avg from all of the oscillators , going from -100 (all ma's are telling to go short ) to 100 ( all ma are telling to go long).
If you have any questions let me know !

Trend System Multiple Moving Averages RatingThis is a trend system made with multiple moving averages designed especially for trending markets such as stocks or crypto.
It can be used with any timeframe.
Its made of multiple moving averages such as
Simple
Weighted
Volume Weighted
Exponential
Double EMA
Arnaud Legoux
Hull MA
Smoothed
Least Squares
Kaufman Adaptive
Triple EMA
Zero Lag
Fractal Adaptive
Variable Index Dynamic Average
Jurik Moving Average
Tillson
Triangular
Avg of all moving averages
It has also a rating, making an avg from all of the moving averages , going from -100 (all ma's are telling to go short ) to 100 ( all ma are telling to go long).
If you have any questions let me know !

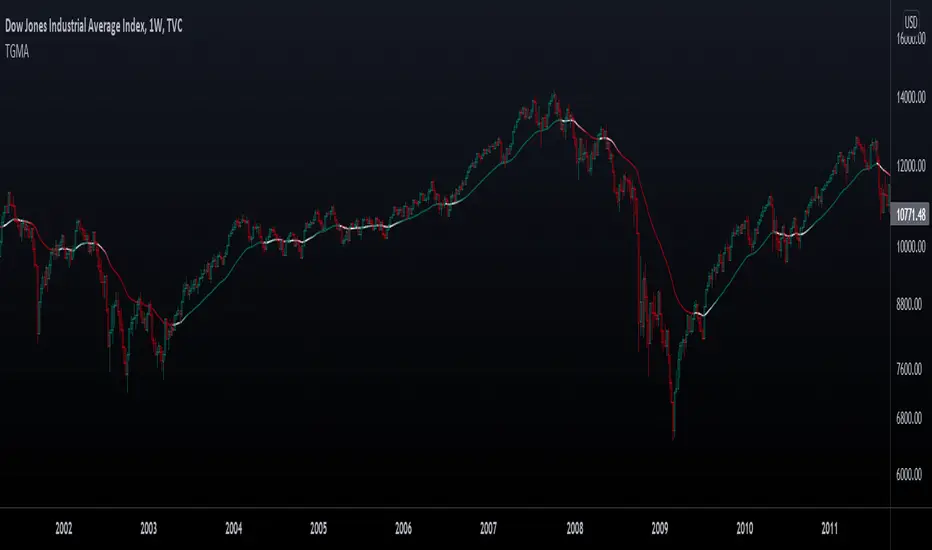
Trend Gradient Moving Average This moving average uses a gradient function which calculates the number of advances/declines of the moving average to change the intensity of the colors, meaning a longer trend in either direction will show a stronger color. You can choose 3 colors to build the gradient: a bullish, bearish & neutral/transition color. The number of steps chosen will change the speed of color change, with a lower number of steps meaning a faster transition and viceversa.
Furthermore, you can choose between many different types of moving averages:
-SMA (Simple Moving Average)
-EMA (Exponential Moving Average)
-RMA (Rolling Moving Average)
-WMA (Weighted Moving Average)
-HMA (Hull Moving Average)
-VWMA (Volume Weighted Moving Average)
-TMA (Triangular Moving Average)
Enjoy!
[blackcat] L1 Trend Detection Index (TDI)Level: 1
Background
The trend detection index (TDI), which can be used to help detect when a trend has begun and when it has come to an end.
Function
The Trend Detection Index (TDI) is used to identify when a trend has started and when it ends. The TDI can be used as a stand-alone indicator or combined with others; It will work well when it comes to spotting the beginning of trends. However, this does not mean that its signals are absolutely accurate.
Inputs
Price --> Price source as input.
Length --> Length input can be adjusted to tune TDI performance.
Key Signal
MktPos --> 1 for long and -1 for short
Remarks
This is a Level 1 free but closed source indicator.
Feedbacks are appreciated.

Coral Trend Indicator [LazyBear] pine v4 I have updated the Coral Trend indicator by LazyBear to the latest pine version v4.
I am not the creator of this indicator!!!
The following description is copied from LazyBear's posted description.
Supported modes:
- Trend mode: This is the default. Draws a trend line (like MA) and colors them based on the trend.
- Ribbon Mode: Shown at the bottom pane. No trend lines are drawn.
- OverlayMode: Bars are colored based on the current trend. Trend line is also displayed (default color=gray).
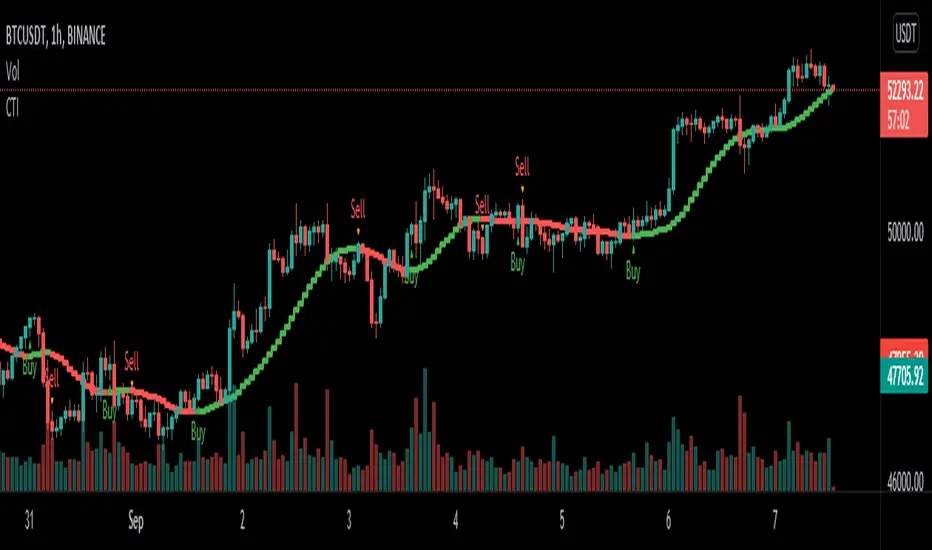
Trend Momentum with Buyers / Sellers PowerHi there!
With this indicator, you can hunt big trends before they start.
This indicator is combined with RSI and Momentum indicators
It can show you the power of trend and which side it wants to go
It can help you to open a position at the first point of a new trend or at the safe and proven point of the trend, also it can help you to close your position before the trend change its direction (it's not recommended to use it to close your positon, but sometimes it can help you to find the ending point of big pumps)
Rules:
* Baseline is ZERO ( 0 ) line
* When gray line crossover red line, it shows us a powerful uptrend
* When the gray line crossunder the red line it shows us a powerful upward trend
Signals:
* Only use Buy signals(Long) when they are above or crossing-up baseline
* Only use Sell signals(Short) when they are under or crossing-down baseline
* If they both (red and gray lines) are too high and they suddenly starting to come back to baseline, it shows we have a range trend, the trend is weak or a reversal trend is coming!!
!! WARNING: DO NOT USE THIS INDICATOR ALONE !!
Suggestions :
-Use 1H, 4H, daily, or Weekly timeframes
-Use ADX and DI or three WMA's
-Use divergence
-You can use it for scalping but you need to change the inputs (not recommended)
If you have any idea about making new indicators(what information do you want from the chart?), comment please, then I can research and make it for all of us! =)

Trend Background by Alejandro PThis indicator is a comprehensive trend indicator designed to help traders filter market conditions for their trading.
The indicator has the option to use a classic Simple Moving Average as a trend filer or a more advanced Simple Moving Average Slope.
The indicator can also use the Aroon indicator as the trend filter and both the SMA and Aroon can be used together to only trade in strong trends.
The Simple Moving Average Slope and the Aroon filters can allow you to filter our 3 market conditions. 1- Upwards Trend, 2- Downwards Trend, 3- Ranging
By tuning these filters to your strategy you can make sure you are only taking trades when the trend is on your side and you can even filter out ranging market conditions to trade the best strategies depending on the market conditions.
Technical details:
If the Simple Moving Average filter is on and the Slope filter if off the indicator will determine the trend by where the price is relative to the moving average. If the price is higher than the SMA then the trend will be bullish, if the price is below the SMA the trend will be bearish.
If SMA filter and Slope FIlter are both on then the trend es defined by the slope of the SMA, this means that if the SMA slope is increasing then the trend will be bullish, if the slow is negative then it will be bearish, but if the slope is within a certain percentile that is classified as neutral then there will be no trend or a neutral market.
If the Aroon filter is enabled this will calculate the trend by the percent of candles with new highs or lows in a similar way as the SMA slope filter works
If both filters are enabled then both filters will have to coincide for a bull or bear trend to be determined.

Jacky Trend ExpertThe Trend expert is a calculation of SMA and MA for a special trend formula to estimate the momentum of the daily Trend.
Basically, it is how it read:
1. Red candle is shorterm uptrend.
2. Green candle is a short-term downtrend.
3. The height of the candle is momentum price bet stronger or weaker.
4. Maroon color line is the EMA 20 days. The trend above EMA20 is stronger.

Papercuts Super Trend MTF v02All my scripts are part of a suite called Papercuts .
This one uses one current timeframe supertrend and adds Four Automatic Higher Timeframe Supertrends based on those same parameters to help you determine larger trends while only needing a single chart. This works quite well on 5 and 15 minute charts and will look up in time. Confident trends can be identified by having two or more lines in the same direction.
When unified, the intensity of the glow should increase a trends confidence. Unify collapses the 3 highest timeframe supertrends into the first higher timeframe supertrend. Without Unify on, the overall trends are usually easier to see at just a glance. Higher timeframe supertrends can show support or resistance and act as stop loss limit ranges if you choose. Unify keeps things a bit cleaner and more compact.
V02 updated to fsecurity for no repainting and added a 3MA trend option as well.
Thanks to @Pinecoders for helping me better understand the security function!
Here is a view with Unify on....
Here is a view with Unify off...
