TradeChartist Plug and Trade™TradeChartist Plug and Trade is an extremely useful indicator that can be connected to almost any Study script (not a Strategy) on Trading View (with an Oscillatory or Non-Oscillatory Signal plot) to generate Trade Signals with Stop Loss plot, user set or automatic Target plots and create Alerts based on Past Performance, determined by Past Gains/Drawdowns for each Trade. The indicator is packed with a lot of features including TradeChartist's signature Dashboard and Real-time Gains Tracker, Automatic Targets Generator, Take Profit recommendation, option to paint price bars based on Trade/Price Trend, 3 types of Stop Loss plots to choose from, with option for user to set fixed Target to take profits.
1. How does ™TradeChartist Plug and Trade connect to another Study script/indicator signal?
Plug and Trade is elegantly designed with simplicity in mind, without compromising on functionality, so any trader - beginner to advanced, can just plug an external signal to the indicator with ease by just following these simple steps.
Add to price chart, the Indicator along with the signal plot to be tested and assessed for performance.
Plug the signal into ™TradeChartist Plug and Trade by choosing it from the Plug Signal Here drop-down.
Choose Signal type as Oscillatory if signal oscillates between set values or crosses a certain value periodically (Example: RSI, CCI, TRIX etc that are mostly not overlayed on Price chart and may be in a separate pane from price chart as it may not fit on Price scale), Choose Signal Type as Non Oscillatory if the signal can be plotted on price scale and Trades are normally generated when price crosses above or below it (Moving Averages, SAR indicators like SuperTrend, etc.).
For oscillators, default Oscillator value for Trade Signals is 0 as most Oscillators have 0 as their mid point. The value can be changed if the Signal doesn't oscillate with 0 as its mid point. For example, if the connected Signal is RSI, the values can be changed to Upper and Lower band values to generate Trade Signals.
Plot the Signal on chart if the signal is Non Oscillatory.
2. How can the plugged Signal's performance be assessed using ™TradeChartist Plug and Trade and subsequently used for generating Trade Entries and to create Alerts?
Once the Signal is plugged into the indicator based on steps above, Plug and Trade automatically plots the Trade entries based on the Signal type.
Plot Trade Entries after Bar Close from settings can be checked for signals that do not confirm until bar close. By doing this, repainting can be avoided for most signals and true performance can be assessed. Also, alerts can be created using Once Per Bar rather than Once Per Bar Close .
The real-time Gains Tracker and Dashboard are useful in tracking gains and other useful indicator values like RSI, Stoch, ATR and EMA in real-time with price movement.
Enabling Past Performance from settings will plot Maximum Gains achieved and Maximum Drawdown for each trade as labels . Trading View only plots finite number of labels and old labels are deleted automatically. But to access past performance beyond the last available label, bar replay can be used.
User can choose from 3 types of Stop Losses from the settings - Fixed %, Trailing % and ATR Stop Loss namely and a Fixed TP % to create plots on price chart and to create alerts.
If the user prefers automatic targets based on Trade entries, Recommend Targets can be enabled from the settings. The automatic targets are generated at the time of Trade Entry, along with Target prices and % which turn green when hit.
Each BUY and SELL Trade are tracked in its entirety and the highest high since BUY and lowest low since SELL are plotted on the price chart and also displayed on the Plug and Play Dashboard
Choppiness can be easily spotted if there are numerous Past Performance labels or several Trade Entries around a short timeframe on chart. This may mean that the signal needs smoothing or may not be suitable for the asset to trade on the chart timeframe. Suitability of a Study script for the asset can be determined in many ways using this indicator.
3. What other features are included in ™TradeChartist Plug and Trade?
Enabling Spot Price Bars to take Profit option from settings automatically plots $ sign above/below candles where Profit taking is recommended or Stop Loss moved to secure profits/reduce loss.
Enabling Paint Price Bars with Trade Trend paints price bars with colors that help picture Trade/Price trend. Trend spotting using this works best with (bars/hollow candles/candles with no border) on dark background.
Both features work on Price chart even without any Signal plugged in.
===================================================================================================================
Example Charts using different Signals plugged into ™TradeChartist Plug and Trade
1. RSI Signal (Oscillatory) plugged in with >60 for BUYs and <40 for SELLs - BTC-USDT on 1hr
2. PowerTracer Signal (Oscillatory) plugged in - GBP-USD 1hr
3. 55 period VWMA Signal (Non Oscillatory) plugged in - ADA-USDT 4hr
4. RSI Signal (Oscillatory) plugged in with >70 for BUYs and <30 for SELLs - SPX 1hr with Trailing SL - 3% and TP - 2%
===================================================================================================================
This is not a free to use indicator. Get in touch with me (PM me directly if you would like trial access to test the indicator)
Premium Scripts - Trial access and Information
Trial access offered on all Premium scripts.
PM me directly to request trial access to the scripts or for more information.
===================================================================================================================
"the script" için komut dosyalarını ara

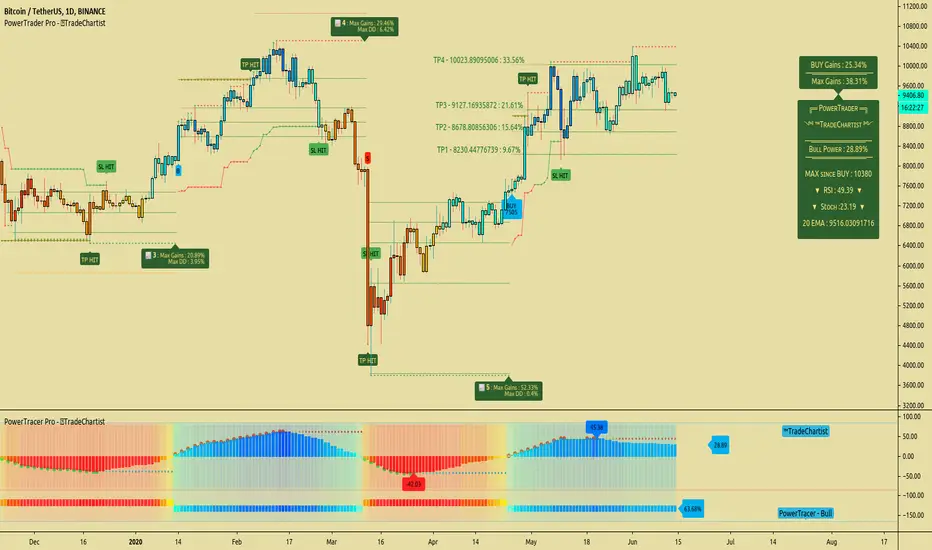
TradeChartist PowerTrader ProTradeChartist PowerTrader Pro is a versatile Signal generator and Signal plotter on the main price chart based on signals from other compatible scripts like TradeChartist PowerTracer Pro . This elegantly designed script plots the following based on user preference.
BUY and SELL signals based on external compatible signal source
Automatic Targets if opted from settings
Trailing or Fixed Stop Loss based on user input
Take Profit % and Quantity to trade based on user input
PowerTrader Dashboard displaying 14 period RSI, Stoch and 20 EMA
Real-Time Gains Tracker displaying Max Gains and open PnL
Past Performance labels displaying Max Gains and Max Drawdown for each trade
Higher Highs since BUY and Lower Lows since SELL
Once the external Signal is connected to the script, the results based on signal backtester ( TradeChartist PowerTracer Pro Backtester ) can be used to optimise the settings to generate plots and also to set Alerts for the following.
Long and Short Signals
Long and Short Stop Loss Hit
Long and Short TP Hit
Move up/down Trailing SL
To create alerts, the user must choose PowerTrader Pro from the alert condition drop-down and choose the required alert. Since the signals are generated only after confirmation, "Once per bar" must be used for Alerts.
===================================================================================================================
This is not a free to use indicator. Get in touch with me (PM me directly if you would like trial access to test the indicator)
Premium Scripts - Trial access and Information
Trial access offered on all Premium scripts.
PM me directly to request trial access to the scripts or for more information.
===================================================================================================================
Dual Purpose Pine Based CorrelationThis is my "Pine-based" correlation() function written in raw Pine Script. Other names applied to it are "Pearson Correlation", "Pearson's r", and one I can never remember being "Pearson Product-Moment Correlation Coefficient(PPMCC)". There is two basic ways to utilize this script. One is checking correlation with another asset such as the S&P 500 (provided as a default). The second is using it as a handy independent indicator correlated to time using Pine's bar_index variable. Also, this is in fact two separate correlation indicators with independent period adjustments, so I guess you could say this indicator has a dual purpose split personality. My intention was to take standard old correlation and apply a novel approach to it, and see what happens. Either way you use it, I hope you may find it most helpful enough to add to your daily TV tool belt.
You will notice I used the Pine built-in correlation() in combination with my custom function, so it shows they are precisely equal, even when the first two correlation() parameters are reversed on purpose or by accident. Additionally, there's an interesting technique to provide a visually appealing line with two overlapping plot()s combined together. I'm sure many members may find that plotting tactic useful when a bird's nest of plotting is occurring on the overlay pane in some scenarios. One more thing about correlation is it's always confined to +/-1.0 irregardless of time intervals or the asset(s) it is applied to, making it a unique oscillator.
As always, I have included advanced Pine programming techniques that conform to proper "Pine Etiquette". For those of you who are newcomers to Pine Script, this code release may also help you comprehend the "Power of Pine" by employing advanced programming techniques in Pine exhibiting code utilization in a most effective manner. One of the many tricks I applied here was providing floating point number safeties for _correlation(). While it cannot effectively use a floating point number, it won't error out in the event this should occur especially when applying "dominant cycle periods" to it, IF you might attempt this.
NOTICE: You may have observed there is a sqrt() custom function and you may be thinking... "Did he just sick and twistedly overwrite the Pine built-in sqrt() function?" The answer is... YES, I am and yes I did! One thing I noticed, is that it does provide slightly higher accuracy precision decimal places compared to the Pine built-in sqrt(). Be forewarned, "MY" sqrt() is technically speaking slower than snail snot compared to the native Pine sqrt(), so I wouldn't advise actually using it religiously in other scripts as a daily habit. It is seemingly doing quite well in combination with these simple calculations without being "sluggish". Lastly, of course you may always just delete the custom sqrt() function, via Pine Editor, and then the script will still operate flawlessly, yet more efficiently.
Features List Includes:
Dark Background - Easily disabled in indicator Settings->Style for "Light" charts or with Pine commenting
AND much, much more... You have the source!
The comments section below is solely just for commenting and other remarks, ideas, compliments, etc... regarding only this indicator, not others. When available time provides itself, I will consider your inquiries, thoughts, and concepts presented below in the comments section, should you have any questions or comments regarding this indicator. When my indicators achieve more prevalent use by TV members, I may implement more ideas when they present themselves as worthy additions. As always, "Like" it if you simply just like it with a proper thumbs up, and also return to my scripts list occasionally for additional postings. Have a profitable future everyone!

Expansion Top/Bottom (Expo) Expansion Top/Bottom (Expo)
DESCRIPTION
Expansion Top/Bottom (Expo) indicator is a powerful oscillator that visualizes temporary Top/Bottom as well as trend shifts. When the market moves boldly a histogram will be formed in the indicator which indicates that the movement might be at its end. It's always a great idea to lock in some profit when we get these histograms. These ‘Lock-in’ profits points are visualized by a cross.
The professional trader has the ability to adjust the length of the calculation. A longer length means that the indicator spots broader market shifts. A short length means that the indicator spots temporary tops/bottoms.
Use the indicator in combination with other signals and analysis techniques.
HOW TO USE
1. Use the indicator to identify temporary tops/bottoms.
2. Use the indicator to identify broader tops/bottoms.
3. Use the indicator to visualize the trend.
4. Use the indicator to visualize ‘Lock-In’ profit points.
INDICATOR IN ACTION
Short length (Length = 14)
BTCUSD
EURUSD
BRENT
BRENT
BTCUSD
Long length (Length = 50)
BRENT
EURUSD
BTCUSD
The indicator works with RENKO, HEIKIN ASHI and with KAGI charts as well.
I hope you find this indicator useful, and please comment or contact me if you like the script or have any questions/suggestions for future improvements. Thanks!
I will continue to work on this indicator, so please share your experience and feedback with me so that I can continuously improve it. Thanks to everyone that have contacted me regarding my scripts. Your feedback is valuable for future developments!
ACCESS THE INDICATOR
• Contact me on TradingView or use the links below.
• I have started to publish private scripts which are not visible on my profile. However, if you're interested to know more about these scripts, drop me a message at my webpage and I will show you these scripts as well. The rationale behind publishing these scrips as private is that I don't want them to be indexed in search engines.
-----------------
Disclaimer
Copyright by Zeiierman.
The information contained in my scripts/indicators/ideas does not constitute financial advice or a solicitation to buy or sell any securities of any type. I will not accept liability for any loss or damage, including without limitation any loss of profit, which may arise directly or indirectly from use of or reliance on such information.
All investments involve risk, and the past performance of a security, industry, sector, market, financial product, trading strategy, or individual’s trading does not guarantee future results or returns. Investors are fully responsible for any investment decisions they make. Such decisions should be based solely on an evaluation of their financial circumstances, investment objectives, risk tolerance, and liquidity needs.
My scripts/indicators/ideas are only for educational purposes!

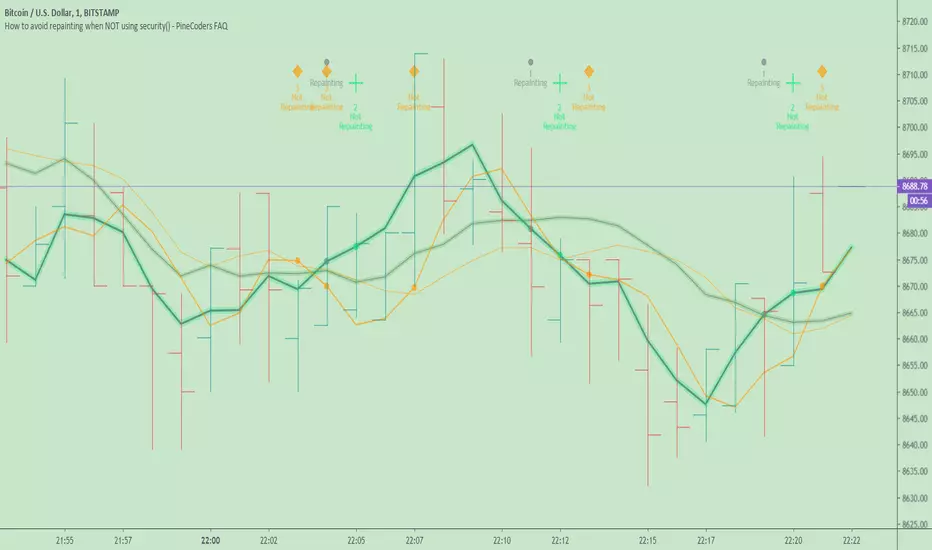
How to avoid repainting when NOT using security()Even when your code does not use security() calls, repainting dynamics still come into play in the realtime bar. Script coders and users must understand them and, if they choose to avoid repainting, need to know how to do so. This script demonstrates three methods to avoid repainting when NOT using the security() function.
Note that repainting dynamics when not using security() usually only come into play in the realtime bar, as historical data is fixed and thus cannot cause repainting, except in situations related to stock splits or dividend adjustments.
For those who don’t want to read
Configure your alerts to trigger “Once Per Bar Close” and you’re done.
For those who want to understand
Put this indicator on a 1 minute or seconds chart with a live symbol. As price changes you will see four of this script’s MAs (all except the two orange ones) move in the realtime bar. You are seeing repainting in action. When the current realtime bar closes and becomes a historical bar, the lines on the historical bars will no longer move, as the bar’s OHLC values are fixed. Note that you may need to refresh your chart to see the correct historical OHLC values, as exchange feeds sometimes produce very slight variations between the end values of the realtime bar and those of the same bar once it becomes a historical bar.
Some traders do not use signals generated by a script but simply want to avoid seeing the lines plotted by their scripts move during the realtime bar. They are concerned with repainting of the lines .
Other traders use their scripts to evaluate conditions, which they use to either plot markers on the chart, trigger alerts, or both. They may not care about the script’s plotted lines repainting, but do not want their markers to appear/disappear on the chart, nor their alerts to trigger for a condition that becomes true during the realtime bar but is no longer true once it closes. Those traders are more concerned with repainting of signals .
For each of the three methods shown in this script’s code, comments explain if its lines, markers and alerts will repaint or not. Through the Settings/Inputs you will be able to control plotting of lines and markers corresponding to each method, as well as experiment with the option, for method 2, of disabling only the lines plotting in the realtime bar while still allowing the markers and alerts to be generated.
An unavoidable fact is that non-repainting lines, markers or alerts are always late compared to repainting ones. The good news is that how late they are will in many cases be insignificant, so that the added reliability of the information they provide will largely offset the disadvantages of waiting.
Method 1 illustrates the usual way of going about things in a script. Its gray lines and markers will always repaint but repainting of the alerts the marker conditions generate can be avoided by configuring alerts to trigger “Once Per Bar Close”. Because this gray marker repaints, you will occasionally see it appear/disappear during the realtime bar when the gray MAs cross/un-cross.
Method 2 plots the same MAs as method 1, but in green. The difference is that it delays its marker condition by one bar to ensure it does not repaint. Its lines will normally repaint but its markers will not, as they pop up after the condition has been confirmed on the bar preceding the realtime bar. Its markers appear at the beginning of the realtime bar and will never disappear. When using this method alerts can be configured to trigger “Once Per Bar” so they fire the moment the marker appears on the chart at the beginning of the realtime bar. Note that the delay incurred between methods 1 and 2 is merely the instant between the close of a realtime bar and the beginning of the next one—a delay measured in milliseconds. Method 2 also allows its lines to be hidden in the realtime bar with the corresponding option in the script’s Settings/Inputs . This will be useful to those wishing to eliminate unreliable lines from the realtime bar. Commented lines in method 2 provide for a 2b option, which is to delay the calculation of the MAs rather than the cross condition. It has the obvious inconvenient of plotting delayed MAs, but may come in handy in some situations.
Method 3 is not the best solution when using MAs because it uses the open of bars rather than their close to calculate the MAs. While this provides a way of avoiding repainting, it is not ideal in the case of MA calcs but may come in handy in other cases. The orange lines and markers of method 3 will not repaint because the value of open cannot change in the realtime bar. Because its markers do not repaint, alerts may be configured using “Once Per Bar”.
Spend some time playing with the different options and looking at how this indicator’s lines plot and behave when you refresh you chart. We hope everything you need to understand and prevent repainting when not using security() is there.
Look first. Then leap.
Range Bar Gaps DetectorRange Bar Gaps Detector
Overview
The Range Bar Gaps Detector identifies price gaps across multiple range bar sizes (12, 24, 60, and 120) on any trading instrument, helping traders spot potential support/resistance zones or breakout opportunities. Designed for Pine Script v6, this indicator detects gaps on range bars and exports data for use in companion scripts like Range Bar Gaps Overlap, making it ideal for multi-timeframe gap analysis.
Key Features
Multi-Range Gap Detection: Identifies gaps on 12, 24, 60, and 120-range bars, capturing both bullish (gap up) and bearish (gap down) price movements.
Customizable Sensitivity: Includes a user-defined minimum deviation (default: 10% of 14-period SMA) for 12-range gaps to filter out noise.
7-Day Lookback: Automatically prunes gaps older than 7 days to focus on recent, relevant price levels.
Data Export: Serializes up to 10 gaps per range (tops, bottoms, start bars, highest/lowest prices, and age) for seamless integration with overlap analysis scripts.
Debugging Support: Plots gap counts and aggregation data in the Data Window for easy verification of detected gaps.
How It Works
The indicator aggregates price movements to simulate higher range bars (24, 60, 120) from a base range bar chart. It detects gaps when the price jumps significantly between bars, ensuring gaps meet the minimum deviation threshold for 12-range bars. Gaps are stored in arrays, serialized for external use, and pruned after 7 days to maintain efficiency.
Usage
Add to your range bar chart (e.g., 12-range) to detect gaps across multiple ranges.
Use alongside the Range Bar Gaps Overlap indicator to visualize gaps and their overlaps as boxes on the chart.
Check the Data Window to confirm gap counts and sizes for each range (12, 24, 60, 120).
Adjust the "Minimal Deviation (%) for 12-Range" input to control gap detection sensitivity.
Settings
Minimal Deviation (%) for 12-Range: Set the minimum gap size for 12-range bars (default: 10% of 14-period SMA).
Range Sizes: Fixed at 24, 60, and 120 for higher range bar aggregation.
Notes
Ensure the script is published under your TradingView username (e.g., GreenArrow2005) for use with companion scripts.
Best used on range bar charts to maintain consistent gap detection.
For advanced overlap analysis, pair with the Range Bar Gaps Overlap indicator to highlight zones where gaps from different ranges align.
Ideal For
Traders seeking to identify key price levels for support/resistance or breakout strategies.
Multi-timeframe analysts combining gap data across various range bar sizes.
Developers building custom indicators that leverage gap data for advanced charting.

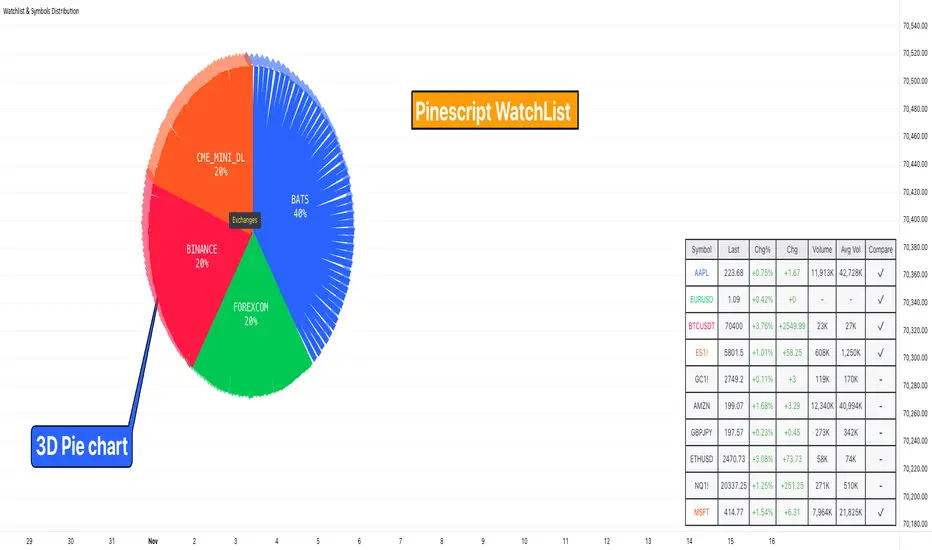
Watchlist & Symbols Distribution [Daveatt]TLDR;
I got bored so I just coded the TradingView watchlist interface in Pinescript :)
TLDR 2:
Sharing it open-source what took me 1 full day to code - haven't coded in Pinescript in a long time, so I'm a bit slow for now :)
█ OVERVIEW
This script offers a comprehensive market analysis tool inspired by TradingView's native watchlist interface features.
It combines an interactive watchlist with powerful distribution visualization capabilities and a performance comparison panel.
The script was developed with a focus on providing multiple visualization methods while working within PineScript's limitations.
█ DEVELOPMENT BACKGROUND
The pie chart implementation was greatly inspired by the ( "Crypto Map Dashboard" script / )
adapting its circular visualization technique to create dynamic distribution charts. However, due to PineScript's 500-line limitation per script, I had to optimize the code to allow users to switch between pie chart analysis and performance comparison modes rather than displaying both simultaneously.
█ SETUP AND DISPLAY
For optimal visualization, users need to adjust the chart's display settings manually.
This involves:
Expanding the indicator window vertically to accommodate both the watchlist and graphical elements
Adjusting the Y-axis scale by dragging it to ensure proper spacing for the comparison panel grid
Modifying the X-axis scale to achieve the desired time window display
Fine-tuning these adjustments whenever switching between pie chart and comparison panel modes
These manual adjustments are necessary due to PineScript's limitations in controlling chart scaling programmatically. While this requires some initial setup, it allows users to customize the display to their preferred viewing proportions.
█ MAIN FEATURES
Distribution Analysis
The script provides three distinct distribution visualization modes through a pie chart.
Users can analyze their symbols by exchanges, asset types (such as Crypto, Forex, Futures), or market sectors.
If you can't see it well at first, adjust your chart scaling until it's displayed nicely.
Asset Exchanges
www.tradingview.com
Asset Types
Asset Sectors
The pie charts feature an optional 3D effect with adjustable depth and angle parameters. To enhance visual customization, four different color schemes are available: Default, Pastel, Dark, and Neon.
Each segment of the pie chart includes interactive tooltips that can be configured to show different levels of detail. Importantly, the pie chart only visualizes the distribution of selected assets (those marked with a checkmark in the watchlist), providing a focused view of the user's current interests.
Interactive Watchlist
The watchlist component displays real-time data for up to 10 user-defined symbols. Each entry shows current price, price changes (both absolute and percentage), volume metrics, and a comparison toggle.
The table is dynamically updated and features color-coded entries that correspond to their respective performance lines in the comparison chart. The watchlist serves as both an information display and a control panel for the comparison feature.
Performance Comparison
One of the script's most innovative features is its performance comparison panel.
Using polylines for smooth visualization, it tracks the 30-day performance of selected symbols relative to a 0% baseline.
The comparison chart includes a sophisticated grid system with 5% intervals and a dynamic legend showing current performance values.
The polyline implementation allows for fluid, continuous lines that accurately represent price movements, providing a more refined visual experience than traditional line plots. Like the pie charts, the comparison panel only displays performance lines for symbols that have been selected in the watchlist, allowing users to focus on their specific assets of interest.
█ TECHNICAL IMPLEMENTATION
The script utilizes several advanced PineScript features:
Dynamic array management for symbol tracking
Polyline-based charting for smooth performance visualization
Real-time data processing with security calls
Interactive tooltips and labels
Optimized drawing routines to maintain performance
Selective visualization based on user choices
█ CUSTOMIZATION
Users can personalize almost every aspect of the script:
Symbol selection and comparison preferences
Visual theme selection with four distinct color schemes
Pie chart dimensions and positioning
Tooltip information density
Component visibility toggles
█ LIMITATIONS
The primary limitation stems from PineScript's 500-line restriction per script.
This constraint necessitated the implementation of a mode-switching system between pie charts and the comparison panel, as displaying both simultaneously would exceed the line limit. Additionally, the script relies on manual chart scale adjustments, as PineScript doesn't provide direct control over chart scaling when overlay=false is enabled.
However, these limitations led to a more focused and efficient design approach that gives users control over their viewing experience.
█ CONCLUSION
All those tools exist in the native TradingView watchlist interface and they're better than what I just did.
However, now it exists in Pinescript... so I believe it's a win lol :)
Futures Risk CalculatorFutures Risk Calculator Script - Description
The Futures Risk Calculator (FRC) is a comprehensive tool designed to help traders effectively manage risk when trading futures contracts. This script allows users to calculate risk/reward ratios directly on the chart by specifying their entry price and stop loss. It's an ideal tool for futures traders who want to quantify their potential losses and gains with precision, based on their trading account size and the number of contracts they trade.
What the Script Does:
1. Risk and Reward Calculation:
The script calculates your total risk in dollars and as a percentage of your account size based on the entry and stop-loss prices you input.
It also calculates two key levels where potential reward (Take Profit 1 and Take Profit 2) can be expected, helping you assess the reward-to-risk ratio for any trade.
2. Customizable Settings:
You can specify the size of your trading account (available $ for Futures trading) and the number of futures contracts you're trading. This allows for tailored risk management that reflects your exact trading conditions.
3. Live Chart Integration:
You add the script to your chart after opening a futures chart in TradingView. Simply click on the chart to set your Entry Price and Stop Loss. The script will instantly calculate and display the risk and reward levels based on the points you set.
Adjusting the entry and stop-loss points later is just as easy: drag and drop the levels directly on the chart, and the risk and reward calculations update automatically.
4. Futures Contract Support:
The script is pre-configured with a list of popular futures symbols (like ES, NQ, CL, GC, and more). If your preferred futures contract isn’t in the list, you can easily add it by modifying the script.
The script uses each symbol’s point value to ensure precise risk calculations, providing you with an accurate dollar risk and potential reward based on the specific contract you're trading.
How to Use the Script:
1. Apply the Script to a Futures Chart:
Open a futures contract chart in TradingView.
Add the Futures Risk Calculator (FRC) script as an indicator.
2. Set Entry and Stop Loss:
Upon applying the script, it will prompt you to select your entry price by clicking the chart where you plan to enter the market.
Next, click on the chart to set your stop-loss level.
The script will then calculate your total risk in dollars and as a percentage of your account size.
3. View Risk, Reward, and (Take Profit):
You can immediately see visual lines representing your entry, stop loss, and the calculated reward-to-risk ratio levels (Take Profit 1 and Take Profit 2).
If you want to adjust the entry or stop loss after plotting them, simply move the points on
the chart, and the script will recalculate everything for you.
4. Configure Account and Contracts:
In the script settings, you can enter your account size and adjust the number of contracts you are trading. These inputs allow the script to calculate risk in monetary terms and as a percentage, making it easier to manage your risk effectively.
5. Understand the Information in the Table:
Once you apply the script, a table will appear in the top-right corner of your chart, providing you with key information about your futures contract and the trade setup. Here's what each field represents:
Account Size: Displays your total account value, which you can set in the script's settings.
Future: Shows the selected futures symbol, along with key details such as its tick size and point value. This gives you a clear understanding of how much one point or tick is worth in dollar terms.
Entry Price: The exact price at which you plan to enter the trade, displayed in green.
Stop Loss Price: The price level where you plan to exit the trade if the market moves against you, shown in red.
Contracts: The number of futures contracts you are trading, which you can adjust in the settings.
Risk: Highlighted in orange, this field shows your total risk in dollars, as well as the percentage risk based on your account size. This is a crucial value to help you stay within your risk tolerance and manage your trades effectively.

Order Block Overlapping Drawing [TradingFinder]🔵 Introduction
Technical analysis is a fundamental tool in financial markets, helping traders identify key areas on price charts to make informed trading decisions. The ICT (Inner Circle Trader) style, developed by Michael Huddleston, is one of the most advanced methods in this field.
It enables traders to precisely identify and exploit critical zones such as Order Blocks, Breaker Blocks, Fair Value Gaps (FVGs), and Inversion Fair Value Gaps (IFVGs).
To streamline and simplify the use of these key areas, a library has been developed in Pine Script, the scripting language for the TradingView platform. This library allows you to automatically detect overlapping zones between Order Blocks and other similar areas, and visually display them on your chart.
This tool is particularly useful for creating indicators like Balanced Price Range (BPR) and ICT Unicorn Model.
🔵 How to Use
This section explains how to use the Pine Script library. This library assists you in easily identifying and analyzing overlapping areas between Order Blocks and other zones, such as Breaker Blocks and Fair Value Gaps.
To add "Order Block Overlapping Drawing", you must first add the following code to your script.
import TFlab/OrderBlockOverlappingDrawing/1
🟣 Inputs
The library includes the "OBOverlappingDrawing" function, which you can use to detect and display overlapping zones. This function identifies and draws overlapping zones based on the Order Block type, trigger conditions, previous and current prices, and other relevant parameters.
🟣 Parameters
OBOverlappingDrawing(OBType , TriggerConditionOrigin, distalPrice_Pre, proximalPrice_Pre , distalPrice_Curr, proximalPrice_Curr, Index_Curr , OBValidGlobal, OBValidDis, MitigationLvL, ShowAll, Show, ColorZone) =>
OBType (string)
TriggerConditionOrigin (bool)
distalPrice_Pre (float)
proximalPrice_Pre (float)
distalPrice_Curr (float)
proximalPrice_Curr (float)
Index_Curr (int)
OBValidGlobal (bool)
OBValidDis (int)
MitigationLvL (string)
ShowAll (bool)
Show (bool)
ColorZone (color)
In this example, various parameters are defined to detect overlapping zones and draw them on the chart. Based on these settings, the overlapping areas will be automatically drawn on the chart.
OBType : All order blocks are summarized into two types: "Supply" and "Demand." You should input your Current order block type in this parameter. Enter "Demand" for drawing demand zones and "Supply" for drawing supply zones.
TriggerConditionOrigin : Input the condition under which you want the Current order block to be drawn in this parameter.
distalPrice_Pre : Generally, if each zone is formed by two lines, the farthest line from the price is termed Pervious "Distal." This input receives the price of the "Distal" line.
proximalPrice_Pre : Generally, if each zone is formed by two lines, the nearest line to the price is termed Previous "Proximal" line.
distalPrice_Curr : Generally, if each zone is formed by two lines, the farthest line from the price is termed Current "Distal." This input receives the price of the "Distal" line.
proximalPrice_Curr : Generally, if each zone is formed by two lines, the nearest line to the price is termed Current "Proximal" line.
Index_Curr : This input receives the value of the "bar_index" at the beginning of the order block. You should store the "bar_index" value at the occurrence of the condition for the Current order block to be drawn and input it here.
OBValidGlobal : This parameter is a boolean in which you can enter the condition that you want to execute to stop drawing the block order. If you do not have a special condition, you should set it to True.
OBValidDis : Order blocks continue to be drawn until a new order block is drawn or the order block is "Mitigate." You can specify how many candles after their initiation order blocks should continue. If you want no limitation, enter the number 4998.
MitigationLvL : This parameter is a string. Its inputs are one of "Proximal", "Distal" or "50 % OB" modes, which you can enter according to your needs. The "50 % OB" line is the middle line between distal and proximal.
ShowAll : This is a boolean parameter, if it is "true" the entire order of blocks will be displayed, and if it is "false" only the last block order will be displayed.
Show : You may need to manage whether to display or hide order blocks. When this input is "On", order blocks are displayed, and when it's "Off", order blocks are not displayed.
ColorZone : You can input your preferred color for drawing order blocks.
🟣 Output
Mitigation Alerts : This library allows you to leverage Mitigation Alerts to detect specific conditions that could lead to trend reversals. These alerts help you react promptly in your trades, ensuring better management of market shifts.
🔵 Conclusion
The Pine Script library provided is a powerful tool for technical analysis, especially in the ICT style. It enables you to detect overlapping zones between Order Blocks and other significant areas like Breaker Blocks and Fair Value Gaps, improving your trading strategies. By utilizing this tool, you can perform more precise analysis and manage risks effectively in your trades.

Supertrend Alert with Arrows and Time FilterOverview
This script is designed to generate trading signals based on the Supertrend indicator, a popular technical analysis tool. The Supertrend indicator is used to identify the direction of the market trend and potential reversal points.
Supertrend Settings
The script uses two sets of Supertrend settings:
Small Supertrend
Factor: 3.0
ATR Period: 10
Big Supertrend
Factor: 10.0
ATR Period: 30
These settings are fixed and should not be altered to maintain the integrity of the signal generation process.
Configurable Parameters
startHour: The hour at which signal generation begins.
endHour: The hour at which signal generation ends.
These parameters allow users to focus on specific trading hours, optimizing the signal relevance to their trading strategy.
Signal Types
The script generates two types of signals:
Type 1: Reversal Signal
Long Signal: Triggered when the big Supertrend is in an uptrend, and the small Supertrend transitions from a downtrend to an uptrend.
Short Signal: Triggered when the big Supertrend is in a downtrend, and the small Supertrend transitions from an uptrend to a downtrend.
Type 2: Trend Change Signal
Long Signal: Triggered when the big Supertrend changes from a downtrend to an uptrend.
Short Signal: Triggered when the big Supertrend changes from an uptrend to a downtrend.
How the Script Works
Initialization: The script initializes with predefined Supertrend settings.
Data Input: Market data (e.g., price data) is fed into the script.
Supertrend Calculation: The script calculates the Supertrend values using the predefined factors and ATR periods.
Signal Detection: The script monitors the Supertrend values and detects the defined signals based on the conditions mentioned above.
Time Filtering: Signals are filtered based on the specified startHour and endHour, ensuring only relevant signals are displayed within the desired timeframe.
Usage
Set Parameters: Define startHour and endHour according to your trading schedule.
Run Script: Execute the script with market data input.
Interpret Signals: Monitor the generated signals and use them to inform your trading decisions.
Originality
Dual Supertrend Usage: The use of both a small and a big Supertrend to generate signals adds a layer of complexity and reliability to the signals.
Time-Based Filtering: Allows traders to focus on specific trading hours, enhancing the relevance and accuracy of signals.
Two Signal Types: The combination of reversal signals and trend change signals provides comprehensive market insights.
Conclusion
This Supertrend Signal Generator is a robust tool for traders seeking to leverage the Supertrend indicator for more informed trading decisions. By combining dual Supertrend settings and configurable trading hours, the script offers unique and flexible signal generation capabilities.

Wiseball RSI Super Advanced Divergences | EssentialThis indicator is a cutting-edge tool designed to elevate your trading strategy by identifying both regular and hidden RSI divergences with unparalleled precision. Moreover, this indicator uniquely offers the capability to visualize divergences as they are forming ("anticipated"), a feature that stands out for its originality and innovation.
Unique Features and How They Work:
This tool distinguishes itself by leveraging its Divergences Detection System (DDS), which incorporates advanced algorithms to analyze market movements and oscillator behavior beyond the capabilities of existing open-source scripts. Here's a brief overview of what makes DDS uniquely effective:
Anticipated and Projected Divergences: DDS goes beyond mere detection of existing divergences. It offers insights into divergences that are currently forming and even projects potential future divergences by analyzing current trends and oscillator levels. This forward-looking feature empowers traders to anticipate market movements, offering a strategic advantage.
Comprehensive Pivot Analysis: Unlike typical divergence indicators, such as the "RSI Divergence Indicator," which only identifies divergences between two consecutive pivots, DDS is engineered to analyze as many previous pivots as the user's configuration allows (duration min/max). This capability ensures that no potential trend or extended divergence is overlooked, providing a more thorough market analysis.
Multiple Divergences Detection: Our system is capable of detecting multiple divergences within the same timeframe. For instance, it can identify a significant bearish divergence alongside a minor bullish divergence, offering a nuanced view of market dynamics that other indicators might miss.
Extensive Customization Options: DDS provides an array of configuration settings, allowing traders to tailor the detection system to their specific needs. Whether adjusting for sensitivity, timeframes, or specific divergence types, these customization options ensure that the tool can adapt to various trading strategies and preferences.
Our commitment to continuous development means that we regularly update the script based on user feedback, ensuring that it remains at the forefront of trading technology.
How to Use This Script:
Setup: Search for "Wiseball RSI Super Advanced Divergences" in the TradingView indicator library. Easily add the script to your TradingView chart and adjust the settings according to your trading preferences.
Analysis: The script automatically identifies divergences and highlights them on your chart, using color-coded lines and patterns for easy interpretation.
Action: Customize alerts to notify you of new divergences, enabling timely trading decisions based on the script's analysis.
Note: This indicator is best used on a dark background, as it has been optimized for this.
Divergence Style Coding:
Bullish Regular Divergence: Green
Bullish Hidden Divergence: Blue
Bearish Regular Divergence: Red
Bearish Hidden Divergence: Orange
Confirmed Divergence: Solid opaque line
Anticipated Divergence: Dotted line in the type's color
Projected Divergence: Dashed line in the type's color
Understand Technical and practical limitations:
This indicator is designed to facilitate ease of use, correspond to standard practices, and cover your essential needs. DDS options are limited to the essentials for simplicity and ease of use. Moreover, these limitations allow for reduced calculation time and a smooth display.
It is limited to displaying 100 divergences, and the number of bars analyzed is fixed at 960. Use the replay mode to view past divergences.
Divergences sharing the same endpoint are limited to the divergence with the longest duration.
Divergences of the same type that cross or share the same time space are filtered to display only one.
The maximum duration of divergences is set to 120 bars.
Anticipated divergences but not projected ones.
Note: As with all trading tools, it's crucial to use this indicator in conjunction with other indicators and fundamental analysis to validate your trading decisions. Our tools are designed to provide you with valuable insights, not to predict the future. Always conduct your research and trade responsibly.

Pro Trading Art - Head And ShouldersHow the Script Works:
1. The script identifies potential Head and Shoulders patterns by searching for specific pivot highs and pivot lows in the price data.
2. It checks for the presence of a left shoulder, head, and right shoulder based on the conditions defined in the script.
3. If a valid Head and Shoulders pattern is found, the script plots lines and labels on the chart to visualize the pattern.
4. The script also identifies Inverted Head and Shoulders patterns using similar logic but with different conditions.
5. It plots lines and labels for the Inverted Head and Shoulders pattern.
6. The script generates short and long conditions based on the patterns. Short conditions trigger when the close price crosses below the neck level of a Head and Shoulders pattern, while long conditions trigger when the close price crosses above the neck level of an Inverted Head and Shoulders pattern.
7. It plots sell and buy signal shapes on the chart when the short and long conditions are met, respectively.
8. The script can also trigger alerts to notify the user when a valid Head and Shoulders or Inverted Head and Shoulders pattern is detected.
9. The script provides visual cues on the chart to help users identify potential trading opportunities.
10. The logic and parameters of the script can be modified by the user to customize the behavior and adapt it to different trading strategies.
How Users Can Make Profit Using This Script:
1. Identify potential short-selling opportunities: When a valid Head and Shoulders pattern is detected and a short condition is met, it indicates a potential trend reversal. Traders can consider opening short positions to profit from a downward price movement.
2. Identify potential long-buying opportunities: When a valid Inverted Head and Shoulders pattern is detected and a long condition is met, it suggests a potential trend reversal. Traders can consider opening long positions to profit from an upward price movement.
3. Combine with additional analysis: Users can utilize this script as a tool in their overall trading strategy. They can combine the signals generated by the script with other technical indicators, fundamental analysis, or market sentiment to make more informed trading decisions.
4. Define appropriate entry and exit points: Traders can use the lines and labels plotted by the script to determine entry and exit points for their trades. For example, they may choose to enter a short position after the price crosses below the neck level and exit when the price reaches a predetermined target or when the pattern is invalidated.
5. Set risk management measures: It is important for users to implement proper risk management strategies when trading based on the script's signals. They should define stop-loss orders to limit potential losses if the trade goes against them and consider setting profit targets to secure profits when the trade moves in their favor.

ZigZag█ OVERVIEW
This library is a Pine Script™ programmer’s tool containing custom user-defined types and functions to calculate Zig Zag indicators within their scripts. It is not a stand-alone indicator.
Pine Script™ libraries are publications that contain reusable code for importing into Pine Script™ indicators, strategies, and other libraries. For more information on libraries and incorporating them into your scripts, see the Libraries section of the Pine Script™ User Manual .
█ CONCEPTS
Zig Zag
Zig Zag is a popular indicator that filters out minor price fluctuations to denoise data and emphasize trends. Traders commonly use Zig Zag for trend confirmation, identifying potential support and resistance, and pattern detection. It is formed by identifying significant local high and low points in alternating order and connecting them with straight lines, omitting all other data points from their output. There are several ways to calculate the Zig Zag's data points and the conditions by which its direction changes. This script uses pivots as the data points, which are the highest or lowest values over a defined number of bars before and after them. The direction only reverses when a newly formed pivot deviates from the last Zig Zag point in the opposite direction by an amount greater than or equal to a specified percentage.
To learn more about Zig Zag and how to calculate it, see this entry from the Help Center.
█ FOR Pine Script™ CODERS
Notes
This script's architecture utilizes user-defined types (UDTs) to create custom objects which are the equivalent of variables containing multiple parts, each able to hold independent values of different types . UDTs are the newest addition to Pine Script™ and the most advanced feature the language has seen to date. The feature's introduction creates a new runway for experienced coders to push the boundaries of Pine. We recommend that newcomers to the language explore the basics first before diving into UDTs and objects.
Demonstration Code
Our example code shows a simple use case by displaying a Zig Zag with user-defined settings. A new ZigZag object is instantiated on the first bar using a Settings object to control its attributes. The fields for the Settings object are declared using variables assigned to input.* functions, allowing control of the field values from the script's settings. The `update()` function is invoked on each bar to update the ZigZag object's fields and create new lines and labels when required.
Look first. Then leap.
█ TYPES
This library contains the following types:
Settings
Provides calculation and display attributes to ZigZag objects.
Fields:
devThreshold : The minimum percentage deviation from a point before the ZigZag will change direction.
depth : The number of bars required for pivot detection.
lineColor : Line color.
extendLast : Condition allowing a line to connect the most recent pivot with the current close.
displayReversalPrice : Condition to display the pivot price in the pivot label.
displayCumulativeVolume : Condition to display the cumulative volume for the pivot segment in the pivot label.
displayReversalPriceChange : Condition to display the change in price or percent from the previous pivot in the pivot label.
differencePriceMode : Reversal change display mode. Options are "Absolute" or "Percent".
draw : Condition to display lines and labels.
Point
A coordinate containing time and price information.
Fields:
tm : A value in UNIX time.
price : A value on the Y axis (price).
Pivot
A level of significance used to determine directional movement or potential support and resistance.
Fields:
ln : A line object connecting the `start` and `end` Point objects.
lb : A label object to display pivot values.
isHigh : A condition to determine if the pivot is a pivot high.
vol : Volume for the pivot segment.
start : The coordinate of the previous Point.
end : The coordinate of the current Point.
ZigZag
An object to maintain Zig Zag settings, pivots, and volume.
Fields:
settings : Settings object to provide calculation and display attributes.
pivots : An array of Pivot objects.
sumVol : The volume sum for the pivot segment.
extend : Pivot object used to project a line from the last pivot to the last bar.
█ FUNCTIONS
This library contains the following functions:
lastPivot(this)
Returns the last Pivot of `this` ZigZag if there is at least one Pivot to return, and `na` otherwise.
Parameters:
this : (series ZigZag) A ZigZag object.
Returns: (Pivot) The last Pivot in the ZigZag.
update(this)
Updates `this` ZigZag object with new pivots, volume, lines, labels.
Parameters:
this : (series ZigZag) a ZigZag object.
Returns: (bool) true if a new Zig Zag line is found or the last Zig Zag line has changed.
newInstance(settings)
Instantiates a new ZigZag object with `settings`. If no settings are provided, a default ZigZag object is created.
Parameters:
settings : (series Settings) A Settings object.
Returns: (ZigZag) A new ZigZag instance.

Tick travel ⍗This script is a further exploration of 'ticks' (only on realtime - live bars), based on my previous script:
- www.tradingview.com -
What are 'ticks'?
... Once the script’s execution reaches the rightmost bar in the dataset, if trading is currently active on the chart’s symbol,
then Pine indicators will execute once every time an update occurs, i.e., price or volume changes ...
(www.tradingview.com)
This script has 2 parts:
1) Option: ' Tick up/down'
This is a further progression of previous work.
During bar development, every time there is an update (tick), a dot is placed.
If for example there is 1 tick (first of new bar), a dot will be placed on 1,
if it is the 8th tick off that bar, there will be a dot placed on 8.
While my previous script had the issue that there was an upper limit per bar (max 32),
this script (because it is working with labels) can place max 500 dots.
For each bar this is better, it has to be mentioned though that looking in history, once the limit of 500 has been reached,
you'll notice the last ones are being deleted. This is one of the reasons the script is not suitable for higher timeframes
(1h and higher, even higher than 5 minutes can give some issues if it is a highly traded ticker), if a bar would have more
than 500 ticks, they won't be drawn anymore (which is not desirable of course)
2) Option: ' Tick progression'
These are the same ticks, but placed on the candle itself, or you can show the candle:
Or 'without' candle (or 'black' colour):
When 'No candles' are enabled, the 'candles' get the colour at the right.
At the moment it is not possible to drawn between 2 candles, this technique uses labels with 'text',
each tick on a candle will have a 'space' added, so you can see a progression to the right.
Colours
- if price is higher than previous tick price -> green
- if price is lower than previous tick price -> red
- otherwise -> blue (dimmed)
There are options to choose the 'dot', when choosing 'custom',
just enter (copy/paste) your symbol of your choice in the 'custom' field:
Caveats:
- Labels and text will not always be exactly on the price itself
- The scripts needs more testings, possibly some ticks don't always get drawn as they should.
The lower the timeframe, the more possible issues can occur
- Since (candle option) the dots move to the right, the higher the timeframe and/or the more ticks,
the sooner ticks will go in the area of next candle.
That's why I made a separate 'start symbol'
-> This is the very first tick on each candle, then you can zoom in/out more easily until the dots don't merge into each other candle area:
A timeframe higher than 5 minutes mostly won't be feasible I believe
This script wouldn't be possible without the help of @LucF, also because of his script
With very much respect I am hugely inspired by him! Many Thanks to him, Tradingview, and everything associated with them!
Cheers!

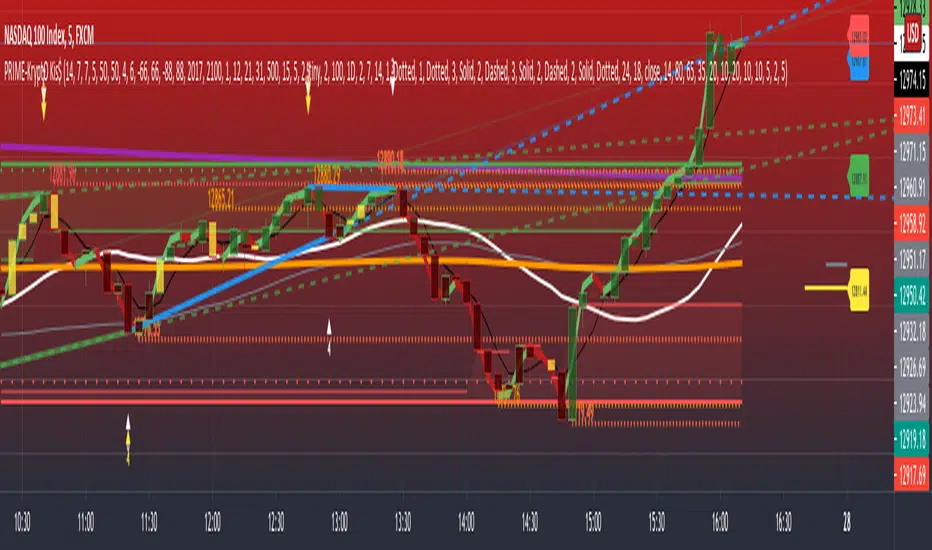
PRIME - Krypto Kiss+CCI+VPIntroducing from Prime Academy, the experimental "KryptO Kis$" algorithm, which combines our most powerful scripts all in one indicator. Available to the user are a full options platform to adjust parameters as well as individually blind indications for precise chart analysis. The following algorithms have been utilized:
* Prime Pulse (3 Candle System) - The original impulse and momentum indication system, it take rsi and tsi data to provide users with the indication of initial impulses, as well as a yellow candle to ascertain when there is a possible change of momentum in the current impulse.
* 5 SMA - The original Sniper Cross system seen from previous strategies, using the 4, 21, 50, 185, and 800 SMA's to determine changes of trend, continuation and support levels.
*CCI Indication on Chart - The system provides realtime CCI data in correlation to price positions within the general chart matrix, receiving system variables from various crosses on the 100 to -100 scale for CCI. Bullish and Bearish indications are clearly defined by separate colors.
* Volume Profile with tags - This system provides current volume data for the current time frame and sequence, also giving available tags at prices holding high volume orders, historically and present as indicated by the difference in length of indications. color saturations indicate the intensity of volume at the price in question .
* Shadow ZoneZ - Provides Support and resistance levels using rsi overbought and over sold data, sourced on the close of previous prices. Also embedded in the code is an additional volume confluence via indications of dotted lines with prices available, giving sequence positions of "Whales" and their support and resistance levels by order volume at price.
* An added bonus of the Shadow ZoneZ is the auto trend line and trend channel function , as well as the highlighted zones of liquidity waiting to be filled from previous impulses and lack of present retracements.
Any questions can be directed here on site via Direct Message. Any feedback is welcomed, and thank you in advance. Trade Well, Family!
- Dee Prime
//Disclaimer:
//Trading success is all about following your trading strategy and the indicators should fit within your trading strategy, and not to be traded upon solely
//The script is for informational and educational purposes only. Use of the script does not constitute professional and/or financial advice.
//You alone have the sole responsibility of evaluating the script output and risks associated with the use of the script.
//In exchange for using the script, you agree not to hold the publishing TradingView user liable for any possible claim for damages arising from any decision you make based on use of the script.
Matrix Library (Linear Algebra, incl Multiple Linear Regression)What's this all about?
Ever since 1D arrays were added to Pine Script, many wonderful new opportunities have opened up. There has been a few implementations of matrices and matrix math (most notably by TradingView-user tbiktag in his recent Moving Regression script: ). However, so far, no comprehensive libraries for matrix math and linear algebra has been developed. This script aims to change that.
I'm not math expert, but I like learning new things, so I took it upon myself to relearn linear algebra these past few months, and create a matrix math library for Pine Script. The goal with the library was to make a comprehensive collection of functions that can be used to perform as many of the standard operations on matrices as possible, and to implement functions to solve systems of linear equations. The library implements matrices using arrays, and many standard functions to manipulate these matrices have been added as well.
The main purpose of the library is to give users the ability to solve systems of linear equations (useful for Multiple Linear Regression with K number of independent variables for example), but it can also be used to simulate 2D arrays for any purpose.
So how do I use this thing?
Personally, what I do with my private Pine Script libraries is I keep them stored as text-files in a Libraries folder, and I copy and paste them into my code when I need them. This library is quite large, so I have made sure to use brackets in comments to easily hide any part of the code. This helps with big libraries like this one.
The parts of this script that you need to copy are labeled "MathLib", "ArrayLib", and "MatrixLib". The matrix library is dependent on the functions from these other two libraries, but they are stripped down to only include the functions used by the MatrixLib library.
When you have the code in your script (pasted somewhere below the "study()" call), you can create a matrix by calling one of the constructor functions. All functions in this library start with "matrix_", and all constructors start with either "create" or "copy". I suggest you read through the code though. The functions have very descriptive names, and a short description of what each function does is included in a header comment directly above it. The functions generally come in the following order:
Constructors: These are used to create matrices (empy with no rows or columns, set shape filled with 0s, from a time series or an array, and so on).
Getters and setters: These are used to get data from a matrix (like the value of an element or a full row or column).
Matrix manipulations: These functions manipulate the matrix in some way (for example, functions to append columns or rows to a matrix).
Matrix operations: These are the matrix operations. They include things like basic math operations for two indices, to transposing a matrix.
Decompositions and solvers: Next up are functions to solve systems of linear equations. These include LU and QR decomposition and solvers, and functions for calculating the pseudo-inverse or inverse of a matrix.
Multiple Linear Regression: Lastly, we find an implementation of a multiple linear regression, including all the standard statistics one can expect to find in most statistical software packages.
Are there any working examples of how to use the library?
Yes, at the very end of the script, there is an example that plots the predictions from a multiple linear regression with two independent (explanatory) X variables, regressing the chart data (the Y variable) on these X variables. You can look at this code to see a real-world example of how to use the code in this library.
Are there any limitations?
There are no hard limiations, but the matrices uses arrays, so the number of elements can never exceed the number of elements supported by Pine Script (minus 2, since two elements are used internally by the library to store row and column count). Some of the operations do use a lot of resources though, and as a result, some things can not be done without timing out. This can vary from time to time as well, as this is primarily dependent on the available resources from the Pine Script servers. For instance, the multiple linear regression cannot be used with a lookback window above 10 or 12 most of the time, if the statistics are reported. If no statistics are reported (and therefore not calculated), the lookback window can usually be extended to around 60-80 bars before the servers time out the execution.
Hopefully the dev-team at TradingView sees this script and find ways to implement this functionality diretly into Pine Script, as that would speed up many of the operations and make things like MLR (multiple linear regression) possible on a bigger lookback window.
Some parting words
This library has taken a few months to write, and I have taken all the steps I can think of to test it for bugs. Some may have slipped through anyway, so please let me know if you find any, and I'll try my best to fix them when I have time to do so. This library is intended to help the community. Therefore, I am releasing the library as open source, in the hopes that people may improving on it, or using it in their own work. If you do make something cool with this, or if you find ways to improve the code, please let me know in the comments.

TE REKABThis indicator is the combination of RECAT & REVVIND published earlier with some extra features.
Core idea behind designing this tool is to IDENTIFY & TRADE REVERSALS in the live market. Reversal can be a TREND REVERSAL or a TEMPORARY PULL BACK. This tool works perfectly in both situations.
LOGIC:
Reversals are identified using:
- failure to break through long term support & resistance, pivots & daily H/L
- volume divergence
- orderflow concept of "skipping of prices".
- flow of price against the momentum during a trend.
Plots are 21/50/100 EMAs which are colour coded to represent the current trend.
ROYAL-BLUE CANDLES represent "ACTION CANDLES"; the high probability candles for finding best reversal trades.
HOW TO USE:
AFTER YOU APPLY THE SCRIPT.
1. WAIT FOR THE FORMATION NEON-BLUE/YELLOW COLOURED BARS AT/NEAR DAY HIGH/LOW.
Accuracy is highest when the REVERSALS are caught at/near DAY HIGH/LOW. I would suggest you to work only on near DAY HIGH/LOW candles.
Do not jump into the trade. Wait for the candle to close.
2. NEON-BLUE represents the start of a BEARISH TREND or simply "SELL SIGNAL".
YELLOW represents the beginning of a BULLISH TREND or simply "BUY SIGNAL".
3. If the NEON-BLUE candle is formed at/near DAY HIGH.
SELL below it's LOW with DAY HIGH as Stoploss. (Keep some BUFFER).
If the YELLOW candle is formed at/near DAY LOW.
BUY above it's HIGH with DAY LOW as Stoploss. (Keep some BUFFER).
4. TARGET
Risk : Reward = 1:1
Trail Stoploss for 1:2, 1:2.5, 1:3
NOTE:
REKAB can be used in any timeframe. However, lower timeframes tend to have more noise as compared to 15mins and above.
REKAB can be used with all the SCRIPTS. However, high volume scripts give better results.
THERE IS ABSOLUTELY NO REPAINTING AFTER THE CANDLE IS CLOSED.
THIS IS A PAID SCRIPT. FOR ACCESS PLEASE SEND A PRIVATE MESSAGE OR WHATSAPP ME (NUMBER IN SIGNATURES)
AS PER TRADINGVIEW POLICY, PLEASE DO NOT ASK FOR ACCESS IN COMMENTS SECTION.
[PX] External LevelHello everyone,
today I'd like to share a script, which enables you to use external logic to plot levels on your chart.
How does it work?
The concept is based on two scripts. One script, which uses an external input as a trigger to print a new level and one script that calculates an output, which will be fetched.
Sounds complicated? It really is not! Let's take a closer look.
// This source code is subject to the terms of the Mozilla Public License 2.0 at mozilla.org
// © paaax
//@version=4
study("RSI OS/OB")
l = input(14, "RSI Length")
ob = input(70, "Overbought")
os = input(30, "Oversold")
r = rsi(close, l)
hline(ob)
hline(os)
plot(r, "RSI", color=color.orange)
// The following plot produces an output, which will be fetched the "External Level"-script.
// It evaluates to one of the following three values: 1.0, -1.0 or 0.0
plot(crossover(r, ob) ? 1.0 : crossunder(r, os) ? -1.0 : 0.0, "Output", transp=100)
The example script above uses an RSI and two threshold levels (70 and 30). The logic here is, that whenever the RSI is crossing down the lower threshold or crossing up the upper threshold we'd consider the current movement to be either oversold or overbought. Therefore, it's a point of interest, which we could visualize with a level.
The script creates an output when the crossover or crossunder of a threshold happens. A crossover would result in a value of 1.0, a crossunder in a value of -1.0. In all other cases the value would be 0.0.
The output of the RSI script would then be used as an input of the External Level script, which has a "Source"-parameter in its input-section. If the fetched input shows 1.0, then the script prints a resistance level. If it shows -1.0 a support level will be printed. And that's basically it. A very simple approach to print levels on your chart with an infinite number of use cases.
For example, you could use fetch outputs from a MACD script, MA script, outputs based on volume or price movement. Just remember the output has to evaluate to either 1.0 or -1.0 and has to be selected in the input-section.
Hope that might be useful to some of you :)
Please click the "Like"-button and follow me for future open-source script publications.
If you are looking for help with your custom PineScript development, don't hesitate to contact me directly here on Tradingview or through the link in my signature :)

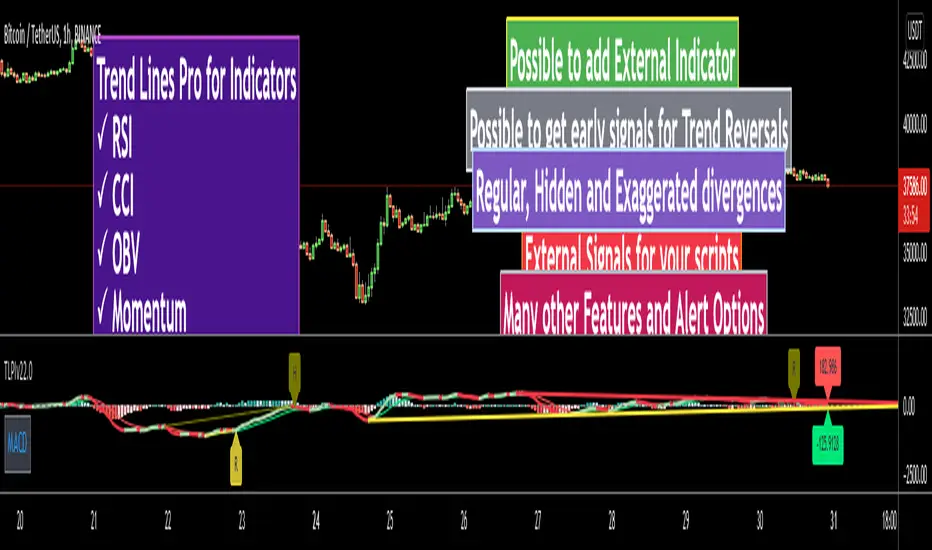
Trend Lines Pro for IndicatorsHello Traders!
We need to make things better & better to solve the puzzle and I try to do my best on this way. now I am here with my new Trend Lines Pro for Indicators script.
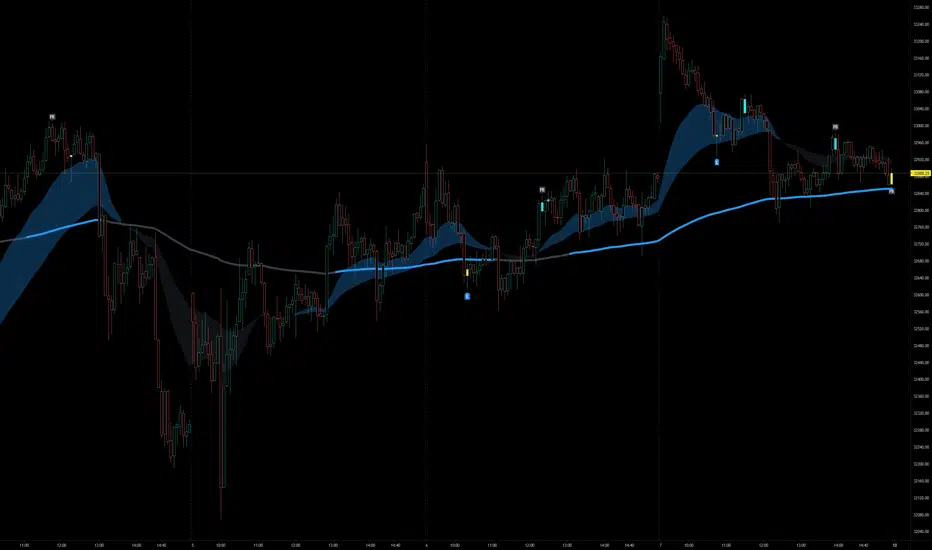
As you know, Trend Lines is very subjective and many people (even professionals) draw different Trend Lines on the same chart. This is confusing and there must be an automation to make the life easer. with this tool I tried to automate it.
The idea in this script is different from my previous trend lines scripts. In this, I use channel idea so it can check number of pivot points it contains. it also checks the angle while choosing trend lines. then we get stronger and useful Trend Lines automatically.
There are some option in the script, let see one by one:
Indicator: the indicator on which you want to see Trend lines, Predefined Indicators are: RSI, CCI(Commodity Channel Index), OBV(On-Balance Volume), Momentum, MACD, CMF(Chaikin Money Flow), External Indicator
External Indicator: with this option you can use other indicators as input and get trend lines for them.
- First add an indicator (such as MFI)
- in "Indicator" option select "External Indicator"
- click "External Indicator" option
- and choose the indicator from the list
Pivot Period: The Length to calculate Pivot Highs/Lows
Threshold Rate: This rate is used for channel width. it you give bigger numbers then you get bigger channels. it's 4 by default
Minimum Angle Rate for new Trendline: if there are different trend lines , there must be an angle between them to choose best trend lines . you can set the angle with this option.
Minimum Strength: there can be many trend lines but we need to choose/use stronger ones. with this option you can set the number of pivot points a trend channel have to contains. default value is 2
Maximum Loopback Length : by default the script can check 40 pivot highs and 40 pivot lows but to make the script faster and useful I needed to add a limitation for the number of bars that the script can go back.
Show Trendlines as: you can see trend lines as "Trendline", "Channel", "Trend Channel". you can see examples below.
Enable Weak Trend Lines : if there is no trend lines strong enough (as defined in "Minimum Strength" option) you have option to see a weak trend line . that is useful sometimes. if you enable this option weak lines are shown as dotted lines.
Show Price Labels on Trendlines: the script can show the price levels to break trend lines . the example
Line Style: trend lines can be Solid or Dashed as you wish
Color theme: colors of the Up/Down Trend lines can be set. Red, Lime, Blue, White, Black, Olive, Gray
Indicator color: colors of the Up/Down Trend lines can be set. Red, Lime, Blue, White, Black, Olive, Gray and Yellow
and last options are for length options for RSI, CCI, Momentum, MACD, CMF
There are many alerts such: Support/Resistance Broken, Price in Support/Resistance channel, Support/Resistance line broken but still in a channel that means it broke S/R but there is another trend lines to break.
Below an example how the script uses external indicator as input and draws trend lines on it. in this example chaikin ossilator was added to the chart and get trend lines for it. (I am going to make a short video about it)
An example of Trend Channel is below. when you use trend channel option you can get "big picture" of whats going on
An example for trend lines in channels, that is the idea behind this trend lines script
An axample for trend lines for CCI:
Trend lines on OBV:
Trend lines on Momentum:
Trend lines on MACD:
Trend lines on CMF:
Different colors and line styles:
Please send me message for access and do not hesitate to ask your questions about this tool.
Enjoy!
DISCLAIMER: No sharing, copying, reselling, modifying, or any other forms of use are authorized for our documents, script / strategy, and the information published with them. This informational planning script / strategy is strictly for individual use and educational purposes only. This is not financial or investment advice. Investments are always made at your own risk and are based on your personal judgement. I am not responsible for any losses you may incur. Please invest wisely.
Trend Lines ProHello Traders!
We need to make things better & better to solve the puzzle and I try to do my best on this way. now I am here with my new Trend Lines Pro script.
As you know, Trend Lines is very subjective and many people (even professionals) draw different Trend Lines on the same chart. This is confusing and there must be an automation to make the life easer. with this tool I tried to automate it.
The idea in this script is different from my previous trend lines scripts. In this, I use channel idea so it can check number of pivot points it contains, it checks H/L/C in the channels as well. it also checks the angle while choosing trend lines. then we get stronger and useful Trend Lines automatically.
There are some option in the script, let see one by one:
Pivot Period: The Length to calculate Pivot Highs/Lows
Source : Option to use "High/Low" or "Close" as the source for Pivot Points
Threshold Rate : This rate is used for channel width. it you give bigger numbers then you get bigger channels. it's 4 by default
Minimum Angle Rate for new Trendline: if there are different trend lines, there must be an angle between them to choose best trend lines. you can set the angle with this option.
Minimum Strength: there can be many trend lines but we need to choose/use stronger ones. with this option you can set the number of pivot points a trend channel have to contains.
Maximum Loopback Length: by default the script can check 40 pivot highs and 40 pivot lows but to make the script faster and useful I needed to add a limitation for the number of bars that the script can go back.
Show Trendlines as: you can see trend lines as "Trendline", "Channel", "Trend Channel". you can see examples below.
Enable Weak Trend Lines: if there is no trend lines strong enough (as defined in "Minimum Strength" option) you have option to see a weak trend line. that is useful sometimes. if you enable this option weak lines are shown as dotted lines.
Show Price Labels on Trendlines: the script can show the price levels to break trend lines. the examples are below
Line Style: trend lines can be Solid or Dashed as you wish
Color theme: colors of the Up/Down Trend lines can be set. 'Red', Lime, Blue, White, Black, Olive, Gray
you can see the Trend Lines as channels:
you can see Trend Channels to see the big picture.also there is dotted trend line as weak trend line defined above.
you can set color/width of trend lines as you wish.
the script is fast enough to run on 1sec chart:
you can use this script on any chart, fx pairs, stocks, indices etc
I made a short video to explain how to use it and some options:
Please PM for access.
Enjoy!
DISCLAIMER: No sharing, copying, reselling, modifying, or any other forms of use are authorized for our documents, script / strategy, and the information published with them. This informational planning script / strategy is strictly for individual use and educational purposes only. This is not financial or investment advice. Investments are always made at your own risk and are based on your personal judgement. I am not responsible for any losses you may incur. Please invest wisely.

888 BOT #backtest█ 888 BOT #backtest
This is an Expert Advisor 'EA' or Automated trading script for ‘longs’ and ‘shorts’, which uses only a Take Profit or, in the worst case, a Stop Loss to close the trade.
It's a much improved version of the previous ‘Repanocha’. It doesn`t use 'Trailing Stop' or 'security()' functions (although using a security function doesn`t mean that the script repaints) and all signals are confirmed, therefore the script doesn`t repaint in alert mode and is accurate in backtest mode.
Apart from the previous indicators, some more and other functions have been added for Stop-Loss, re-entry and leverage.
It uses 8 indicators, (many of you already know what they are, but in case there is someone new), these are the following:
1. Jurik Moving Average
It's a moving average created by Mark Jurik for professionals which eliminates the 'lag' or delay of the signal. It's better than other moving averages like EMA, DEMA, AMA or T3.
There are two ways to decrease noise using JMA. Increasing the 'LENGTH' parameter will cause JMA to move more slowly and therefore reduce noise at the expense of adding 'lag'
The 'JMA LENGTH', 'PHASE' and 'POWER' parameters offer a way to select the optimal balance between 'lag' and over boost.
Green: Bullish, Red: Bearish.
2. Range filter
Created by Donovan Wall, its function is to filter or eliminate noise and to better determine the price trend in the short term.
First, a uniform average price range 'SAMPLING PERIOD' is calculated for the filter base and multiplied by a specific quantity 'RANGE MULTIPLIER'.
The filter is then calculated by adjusting price movements that do not exceed the specified range.
Finally, the target ranges are plotted to show the prices that will trigger the filter movement.
Green: Bullish, Red: Bearish.
3. Average Directional Index (ADX Classic) and (ADX Masanakamura)
It's an indicator designed by Welles Wilder to measure the strength and direction of the market trend. The price movement is strong when the ADX has a positive slope and is above a certain minimum level 'ADX THRESHOLD' and for a given period 'ADX LENGTH'.
The green color of the bars indicates that the trend is bullish and that the ADX is above the level established by the threshold.
The red color of the bars indicates that the trend is down and that the ADX is above the threshold level.
The orange color of the bars indicates that the price is not strong and will surely lateralize.
You can choose between the classic option and the one created by a certain 'Masanakamura'. The main difference between the two is that in the first it uses RMA () and in the second SMA () in its calculation.
4. Parabolic SAR
This indicator, also created by Welles Wilder, places points that help define a trend. The Parabolic SAR can follow the price above or below, the peculiarity that it offers is that when the price touches the indicator, it jumps to the other side of the price (if the Parabolic SAR was below the price it jumps up and vice versa) to a distance predetermined by the indicator. At this time the indicator continues to follow the price, reducing the distance with each candle until it is finally touched again by the price and the process starts again. This procedure explains the name of the indicator: the Parabolic SAR follows the price generating a characteristic parabolic shape, when the price touches it, stops and turns (SAR is the acronym for 'stop and reverse'), giving rise to a new cycle. When the points are below the price, the trend is up, while the points above the price indicate a downward trend.
5. RSI with Volume
This indicator was created by LazyBear from the popular RSI.
The RSI is an oscillator-type indicator used in technical analysis and also created by Welles Wilder that shows the strength of the price by comparing individual movements up or down in successive closing prices.
LazyBear added a volume parameter that makes it more accurate to the market movement.
A good way to use RSI is by considering the 50 'RSI CENTER LINE' centerline. When the oscillator is above, the trend is bullish and when it is below, the trend is bearish.
6. Moving Average Convergence Divergence (MACD) and (MAC-Z)
It was created by Gerald Appel. Subsequently, the histogram was added to anticipate the crossing of MA. Broadly speaking, we can say that the MACD is an oscillator consisting of two moving averages that rotate around the zero line. The MACD line is the difference between a short moving average 'MACD FAST MA LENGTH' and a long moving average 'MACD SLOW MA LENGTH'. It's an indicator that allows us to have a reference on the trend of the asset on which it is operating, thus generating market entry and exit signals.
We can talk about a bull market when the MACD histogram is above the zero line, along with the signal line, while we are talking about a bear market when the MACD histogram is below the zero line.
There is the option of using the MAC-Z indicator created by LazyBear, which according to its author is more effective, by using the parameter VWAP (volume weighted average price) 'Z-VWAP LENGTH' together with a standard deviation 'STDEV LENGTH' in its calculation.
7. Volume Condition
Volume indicates the number of participants in this war between bulls and bears, the more volume the more likely the price will move in favor of the trend. A low trading volume indicates a lower number of participants and interest in the instrument in question. Low volumes may reveal weakness behind a price movement.
With this condition, those signals whose volume is less than the volume SMA for a period 'SMA VOLUME LENGTH' multiplied by a factor 'VOLUME FACTOR' are filtered. In addition, it determines the leverage used, the more volume, the more participants, the more probability that the price will move in our favor, that is, we can use more leverage. The leverage in this script is determined by how many times the volume is above the SMA line.
The maximum leverage is 8.
8. Bollinger Bands
This indicator was created by John Bollinger and consists of three bands that are drawn superimposed on the price evolution graph.
The central band is a moving average, normally a simple moving average calculated with 20 periods is used. ('BB LENGTH' Number of periods of the moving average)
The upper band is calculated by adding the value of the simple moving average X times the standard deviation of the moving average. ('BB MULTIPLIER' Number of times the standard deviation of the moving average)
The lower band is calculated by subtracting the simple moving average X times the standard deviation of the moving average.
the band between the upper and lower bands contains, statistically, almost 90% of the possible price variations, which means that any movement of the price outside the bands has special relevance.
In practical terms, Bollinger bands behave as if they were an elastic band so that, if the price touches them, it has a high probability of bouncing.
Sometimes, after the entry order is filled, the price is returned to the opposite side. If price touch the Bollinger band in the same previous conditions, another order is filled in the same direction of the position to improve the average entry price, (% MINIMUM BETTER PRICE ': Minimum price for the re-entry to be executed and that is better than the price of the previous position in a given %) in this way we give the trade a chance that the Take Profit is executed before. The downside is that the position is doubled in size. 'ACTIVATE DIVIDE TP': Divide the size of the TP in half. More probability of the trade closing but less profit.
█ STOP LOSS and RISK MANAGEMENT.
A good risk management is what can make your equity go up or be liquidated.
The % risk is the percentage of our capital that we are willing to lose by operation. This is recommended to be between 1-5%.
% Risk: (% Stop Loss x % Equity per trade x Leverage) / 100
First the strategy is calculated with Stop Loss, then the risk per operation is determined and from there, the amount per operation is calculated and not vice versa.
In this script you can use a normal Stop Loss or one according to the ATR. Also activate the option to trigger it earlier if the risk percentage is reached. '% RISK ALLOWED'
'STOP LOSS CONFIRMED': The Stop Loss is only activated if the closing of the previous bar is in the loss limit condition. It's useful to prevent the SL from triggering when they do a ‘pump’ to sweep Stops and then return the price to the previous state.
█ BACKTEST
The objective of the Backtest is to evaluate the effectiveness of our strategy. A good Backtest is determined by some parameters such as:
- RECOVERY FACTOR: It consists of dividing the 'net profit' by the 'drawdown’. An excellent trading system has a recovery factor of 10 or more; that is, it generates 10 times more net profit than drawdown.
- PROFIT FACTOR: The ‘Profit Factor’ is another popular measure of system performance. It's as simple as dividing what win trades earn by what loser trades lose. If the strategy is profitable then by definition the 'Profit Factor' is going to be greater than 1. Strategies that are not profitable produce profit factors less than one. A good system has a profit factor of 2 or more. The good thing about the ‘Profit Factor’ is that it tells us what we are going to earn for each dollar we lose. A profit factor of 2.5 tells us that for every dollar we lose operating we will earn 2.5.
- SHARPE: (Return system - Return without risk) / Deviation of returns.
When the variations of gains and losses are very high, the deviation is very high and that leads to a very poor ‘Sharpe’ ratio. If the operations are very close to the average (little deviation) the result is a fairly high 'Sharpe' ratio. If a strategy has a 'Sharpe' ratio greater than 1 it is a good strategy. If it has a 'Sharpe' ratio greater than 2, it is excellent. If it has a ‘Sharpe’ ratio less than 1 then we don't know if it is good or bad, we have to look at other parameters.
- MATHEMATICAL EXPECTATION: (% winning trades X average profit) + (% losing trades X average loss).
To earn money with a Trading system, it is not necessary to win all the operations, what is really important is the final result of the operation. A Trading system has to have positive mathematical expectation as is the case with this script: ME = (0.87 x 30.74$) - (0.13 x 56.16$) = (26.74 - 7.30) = 19.44$ > 0
The game of roulette, for example, has negative mathematical expectation for the player, it can have positive winning streaks, but in the long term, if you continue playing you will end up losing, and casinos know this very well.
PARAMETERS
'BACKTEST DAYS': Number of days back of historical data for the calculation of the Backtest.
'ENTRY TYPE': For '% EQUITY' if you have $ 10,000 of capital and select 7.5%, for example, your entry would be $ 750 without leverage. If you select CONTRACTS for the 'BTCUSDT' pair, for example, it would be the amount in 'Bitcoins' and if you select 'CASH' it would be the amount in $ dollars.
'QUANTITY (LEVERAGE 1X)': The amount for an entry with X1 leverage according to the previous section.
'MAXIMUM LEVERAGE': It's the maximum allowed multiplier of the quantity entered in the previous section according to the volume condition.
The settings are for Bitcoin at Binance Futures (BTC: USDTPERP) in 30 minutes.
For other pairs and other timeframes, the settings have to be adjusted again. And within a month, the settings will be different because we all know the market and the trend are changing.
█ 888 BOT (SPANISH)
Este es un Expert Advisor 'EA' o script de trading automatizado para ‘longs’ y ‘shorts’, el cual, utiliza solo un Take Profit o, en el peor de los casos, un Stop Loss para cerrar el trade.
Es una versión muy mejorada del anterior ‘Repanocha’. No utiliza ‘Trailing Stop’, ni funciones ‘security()’ (aunque usar una función security no significa que el script repinte) y todas las señales son confirmadas, por consiguiente, el script no repinta en modo alertas y es preciso en en el modo backtest.
Aparte de los anteriores indicadores se han añadido algunos más y otras funciones para Stop-Loss, de re-entrada y apalancamiento.
Utiliza 8 indicadores, (muchos ya sabéis sobradamente lo que son, pero por si hay alguien nuevo), son los siguientes:
1. Jurik Moving Average
Es una media móvil creada por Mark Jurik para profesionales la cual elimina el ‘lag’ o retardo de la señal. Es mejor que otras medias móviles como la EMA, DEMA, AMA o T3.
Hay dos formas de disminuir el ruido utilizando JMA. El aumento del parámetro 'LENGTH' hará que JMA se mueva más lentamente y, por lo tanto, reducirá el ruido a expensas de añadir ‘lag’
Los parámetros 'JMA LENGTH', 'PHASE' y 'POWER' ofrecen una forma de seleccionar el equilibrio óptimo entre ‘lag’ y sobre impulso.
Verde : Alcista, Rojo: Bajista.
2. Range filter
Creado por Donovan Wall, su función es la de filtrar o eliminar el ruido y poder determinar mejor la tendencia del precio a corto plazo.
Primero, se calcula un rango de precio promedio uniforme 'SAMPLING PERIOD' para la base del filtro y se multiplica por una cantidad específica 'RANGE MULTIPLIER'.
A continuación, el filtro se calcula ajustando los movimientos de precios que no exceden el rango especificado.
Por último, los rangos objetivo se trazan para mostrar los precios que activarán el movimiento del filtro.
Verde : Alcista, Rojo: Bajista.
3. Average Directional Index (ADX Classic) y (ADX Masanakamura)
Es un indicador diseñado por Welles Wilder para medir la fuerza y dirección de la tendencia del mercado. El movimiento del precio tiene fuerza cuando el ADX tiene pendiente positiva y está por encima de cierto nivel mínimo 'ADX THRESHOLD' y para un periodo dado 'ADX LENGTH'.
El color verde de las barras indica que la tendencia es alcista y que el ADX está por encima del nivel establecido por el threshold.
El color Rojo de las barras indica que la tendencia es bajista y que el ADX está por encima del nivel de threshold.
El color naranja de las barras indica que el precio no tiene fuerza y seguramente lateralizará.
Se puede elegir entre la opción clásica y la creada por un tal 'Masanakamura'. La diferencia principal entre los dos es que en el primero utiliza RMA() y en el segundo SMA() en su cálculo.
4. Parabolic SAR
Este indicador, creado también por Welles Wilder, coloca puntos que ayudan a definir una tendencia. El Parabolic SAR puede seguir al precio por encima o por debajo, la particularidad que ofrece es que cuando el precio toca al indicador, este salta al otro lado del precio (si el Parabolic SAR estaba por debajo del precio salta arriba y viceversa) a una distancia predeterminada por el indicador. En este momento el indicador vuelve a seguir al precio, reduciendo la distancia con cada vela hasta que finalmente es tocado otra vez por el precio y se vuelve a iniciar el proceso. Este procedimiento explica el nombre del indicador: el Parabolic SAR va siguiendo al precio generando una característica forma parabólica, cuando el precio lo toca, se para y da la vuelta (SAR son las siglas en inglés de ‘stop and reverse’), dando lugar a un nuevo ciclo. Cuando los puntos están por debajo del precio, la tendencia es alcista, mientras que los puntos por encima del precio indica una tendencia bajista.
5. RSI with Volume
Este indicador lo creo un tal LazyBear de TV a partir del popular RSI.
El RSI es un indicador tipo oscilador utilizado en análisis técnico y creado también por Welles Wilder que muestra la fuerza del precio mediante la comparación de los movimientos individuales al alza o a la baja de los sucesivos precios de cierre.
LazyBear le añadió un parámetro de volumen que lo hace más preciso al movimiento del mercado.
Una buena forma de usar el RSI es teniendo en cuenta la línea central de 50 'RSI CENTER LINE'. Cuando el oscilador está por encima, la tendencia es alcista y cuando está por debajo la tendencia es bajista.
6. Moving Average Convergence Divergence (MACD) y (MAC-Z)
Fue creado por Gerald Appel. Posteriormente se añadió el histograma para anticipar el cruce de medias. A grandes rasgos podemos decir que el MACD es un oscilador consistente en dos medias móviles que van girando en torno a la línea de cero. La línea del MACD no es más que la diferencia entre una media móvil corta 'MACD FAST MA LENGTH' y una media móvil larga 'MACD SLOW MA LENGTH'. Es un indicador que nos permite tener una referencia sobre la tendencia del activo sobre el cual se está operando, generando de este modo señales de entrada y salida del mercado.
Podemos hablar de mercado alcista cuando el histograma del MACD se sitúe por encima de la línea cero, junto con la línea de señal, mientras que hablaremos de mercado bajista cuando el histograma MACD se situará por debajo de la línea cero.
Está la opción de utilizar el indicador MAC-Z creado por LazyBear que según su autor es más eficaz, por utilizar el parámetro VWAP (precio medio ponderado por volumen) 'Z-VWAP LENGTH' junto con una desviación standard 'STDEV LENGTH' en su cálculo.
7. Volume Condition
El volumen indica el número de participantes en esta guerra entre toros y osos, cuanto más volumen más probabilidad de que se mueva el precio a favor de la tendencia. Un volumen bajo de negociación indica un menor número de participantes e interés por el instrumento en cuestión. Los bajos volúmenes pueden revelar debilidad detrás de un movimiento de precios.
Con esta condición se filtran aquellas señales cuyo volumen es inferior a la SMA de volumen para un periodo 'SMA VOLUME LENGTH' multiplicado por un factor 'VOLUME FACTOR'. Además, determina el apalancamiento utilizado, a más volumen, más participantes, más probabilidad de que se mueva el precio a nuestro favor, es decir, podemos utilizar más apalancamiento. El apalancamiento en este script lo determina las veces que está el volumen por encima de la línea de la SMA.
El apalancamiento máximo es de 8.
8. Bollinger Bands
Este indicador fue creado por John Bollinger y consiste en tres bandas que se dibujan superpuestas al gráfico de evolución del precio.
La banda central es una media móvil, normalmente se emplea una media móvil simple calculada con 20 períodos. ('BB LENGTH' Número de periodos de la media móvil)
La banda superior se calcula sumando al valor de la media móvil simple X veces la desviación típica de la media móvil. ('BB MULTIPLIER' Número de veces la desviación típica de la media móvil)
La banda inferior de calcula restando a la media móvil simple X veces la desviación típica de la media móvil.
la franja comprendida entre las bandas superior e inferior contiene, estadísticamente, casi un 90% de las posibles variaciones del precio, lo que significa que cualquier movimiento del precio fuera de las bandas tiene especial relevancia.
En términos prácticos, las bandas de Bollinger se comporta como si de una banda elástica se tratara de manera que, si el precio las toca, éste tiene mucha probabilidad de rebotar.
En ocasiones, después de rellenarse la orden de entrada, el precio se devuelve hacia el lado contrario. Si toca la banda de Bollinger se rellena otra orden en la misma dirección de la posición para mejorar el precio medio de entrada, (% MINIMUM BETTER PRICE': Precio mínimo para que se ejecute la re-entrada y que sea mejor que el precio de la posición anterior en un % dado) de esta manera damos una oportunidad al trade de que el Take Profit se ejecute antes. La desventaja es que se dobla el tamaño de la posición. 'ACTIVATE DIVIDE TP': Divide el tamaño del TP a la mitad. Más probabilidad de que se cierre el trade pero menos ganancias.
█ STOP LOSS y RISK MANAGEMENT.
Una buena gestión de las pérdidas o gestión del riesgo es lo que puede hacer que tu cuenta suba o se liquide en poco tiempo.
El % de riesgo es el porcentaje de nuestro capital que estamos dispuestos a perder por operación. Este se aconseja que debe estar comprendido entre un 1-5%.
% Risk = (% Stop Loss x % Equity per trade x Leverage) / 100
Primero se calcula la estrategia con Stop Loss, después se determina el riesgo por operación y a partir de ahí se calcula el monto por operación y no al revés.
En este script puedes usar un Stop Loss normal o uno según el ATR. También activar la opción de que salte antes si se alcanza el porcentaje de riesgo. '% RISK ALLOWED'
'STOP LOSS CONFIRMED': Solamente se activa el Stop Loss si el cierre de la barra anterior se encuentra en la condición de límite de pérdidas. Es útil para evitar que se dispare el SL cuando hacen un ‘pump’ para barrer Stops y luego se devuelve el precio a la normalidad.
█ BACKTEST
El objetivo del Backtest es evaluar la eficacia de nuestra estrategia. Un buen Backtest lo determinan algunos parámetros como son:
- RECOVERY FACTOR: Consiste en dividir el ‘beneficio neto’ entre el ‘drawdown’. Un excelente sistema de trading tiene un recovery factor de 10 o más; es decir, genera 10 veces más beneficio neto que drawdown.
- PROFIT FACTOR: El ‘Profit Factor’ es otra medida popular del rendimiento de un sistema. Es algo tan simple como dividir lo que ganan las operaciones con ganancias entre lo que pierden las operaciones con pérdidas. Si la estrategia es rentable entonces por definición el ‘Profit Factor’ va a ser mayor que 1. Las estrategias que no son rentables producen factores de beneficio menores que uno. Un buen sistema tiene un profit factor de 2 o más. Lo bueno del ‘Profit Factor’ es que nos dice lo que vamos a ganar por cada dolar que perdemos. Un profit factor de 2.5 nos dice que por cada dolar que perdamos operando vamos a ganar 2.5.
- SHARPE: (Retorno sistema – Retorno sin riesgo) / Desviación de los retornos.
Cuando las variaciones de ganancias y pérdidas son muy altas, la desviación es muy elevada y eso conlleva un ratio de ‘Sharpe’ muy pobre. Si las operaciones están muy cerca de la media (poca desviación) el resultado es un ratio de ‘Sharpe’ bastante elevado. Si una estrategia tiene un ratio de ‘Sharpe’ mayor que 1 es una buena estrategia. Si tiene un ratio de ‘Sharpe’ mayor que 2, es excelente. Si tiene un ratio de ‘Sharpe’ menor que 1 entonces no sabemos si es buena o mala, hay que mirar otros parámetros.
- MATHEMATICAL EXPECTATION:(% operaciones ganadoras X ganancia media) + (% operaciones perdedoras X pérdida media).
Para ganar dinero con un sistema de Trading, no es necesario ganar todas las operaciones, lo verdaderamente importante es el resultado final de la operativa. Un sistema de Trading tiene que tener esperanza matemática positiva como es el caso de este script.
El juego de la ruleta, por ejemplo, tiene esperanza matemática negativa para el jugador, puede tener rachas positivas de ganancias, pero a la larga, si se sigue jugando se acabará perdiendo, y esto los casinos lo saben muy bien.
PARAMETROS
'BACKTEST DAYS': Número de días atrás de datos históricos para el calculo del Backtest.
'ENTRY TYPE': Para % EQUITY si tienes 10000$ de capital y seleccionas 7.5% tu entrada sería de 750$ sin apalancamiento. Si seleccionas CONTRACTS para el par BTCUSDT sería la cantidad en Bitcoins y si seleccionas CASH sería la cantidad en dólares.
'QUANTITY (LEVERAGE 1X)': La cantidad para una entrada con apalancamiento X! según el apartado anterior.
'MAXIMUM LEVERAGE': Es el máximo multiplicador permitido de la cantidad introducida en el apartado anterior según la condición de volumen.
Los settings son para Bitcoin en Binance Futures (BTC:USDTPERP) en 30 minutos.
Para otro pares y otras temporalidades se tienen que ajustar las opciones de nuevo. Además para dentro de un mes, los ajustes serán otros distintos ya que el mercado y la tendencia es cambiante.

Material Color Palette Library█ OVERVIEW
Unlock a world of color in your Pine Script® projects with the Material Color Palette Library . This library provides a comprehensive and structured color system based on Google's Material Design palette, making it incredibly easy to create visually appealing and professional-looking indicators and strategies.
Forget about guessing hex codes. With this library, you have access to 19 distinct color families, each offering a wide range of shades. Every color can be fine-tuned with saturation, darkness, and opacity levels, giving you precise control over your script's appearance.
To make development even easier, the library includes a visual cheatsheet. Simply add the script to your chart to display a full table of all available colors and their corresponding parameters.
█ KEY FEATURES
Vast Spectrum: 19 distinct color families, from vibrant reds and blues to subtle greys and browns.
Fine-Tuned Control: Each color function accepts parameters for `saturationLevel` (1-13 or 1-9) and `darkLevel` (1-3) to select the perfect shade.
Opacity Parameter: Easily add transparency to any color for fills, backgrounds, or lines.
Quick Access Tones: A simple `tone()` function to grab base colors by name.
Visual Cheatsheet: An on-chart table displays the entire color palette, serving as a handy reference guide during development.
█ HOW TO USE
As a library, this script is meant to be imported into your own indicators or strategies.
1. Import the Library
Add the following line to the top of your script. Remember to replace `YourUsername` with your TradingView username.
import mastertop/ColorPalette/1 as colors
2. Call a Color Function
You can now use any of the exported functions to set colors for your plots, backgrounds, tables, and more.
The primary functions take three arguments: `functionName(saturationLevel, darkLevel, opacity)`
`saturationLevel`: An integer that controls the intensity of the color. Ranges from 1 (lightest) to 13 (most vibrant) for most colors, and 1-9 for `brown`, `grey`, and `blueGrey`.
`darkLevel`: An integer from 1 to 3 (1: light, 2: medium, 3: dark).
`opacity`: An integer from 0 (opaque) to 100 (invisible).
Example Usage:
Let's plot a moving average with a specific shade of teal.
// Import the library
import mastertop/ColorPalette/1 as colors
indicator("My Script with Custom Colors", overlay = true)
// Calculate a moving average
ma = ta.sma(close, 20)
// Plot the MA using a color from the library
// We'll use teal with saturation level 7, dark level 2, and 0% opacity
plot(ma, "MA", color = colors.teal(7, 2, 0), linewidth = 2)
3. Using the `tone()` Function
For quick access to a base color, you can use the `tone()` function.
// Set a red background with 85% transparency
bgcolor(colors.tone('red', 85))
█ VISUAL REFERENCE
To see all available colors at a glance, you can add this library script directly to your chart. It will display a comprehensive table showing every color variant. This makes it easy to pick the exact shade you need without guesswork.
This library is designed for fellow Pine Script® developers to streamline their workflow and enhance the visual quality of their scripts. Enjoy!
Intraday Rising & Reversal ScannerPine Script Description: Intraday Rising & Reversal ScannerThis Pine Script is a TradingView indicator designed to identify stocks with intraday (1-hour timeframe) potential for bullish (rising) or bearish (reversal) movements. It scans for stocks based on user-defined technical criteria, including price change, relative volume, RSI, EMA, ATR, and VWAP. The script plots signals on the chart, displays a summary table, and triggers alerts when conditions are met.FeaturesBullish Signal (Rising Stocks):1H Price Change: > 1% (configurable, e.g., >2% for volatile markets).
Relative Volume: > 2.0 (volume is at least twice the 20-period average).
RSI (14): Between 50 and 70 (strong but not overbought momentum).
Price vs EMA 13: Price above the 13-period EMA (confirms short-term uptrend).
ATR (14): Current ATR above its 20-period average (indicates volatility).
VWAP: Price above VWAP (optional, shown on chart for manual confirmation).
Bearish Signal (Reversal Stocks):1H Price Change: < -1% (configurable, e.g., <-2% for stronger reversals).
Relative Volume: > 2.0 (high volume confirms selling pressure).
RSI (14): > 70 (overbought, increasing reversal likelihood).
Price vs EMA 13: Price below the 13-period EMA (confirms short-term downtrend).
ATR (14): Current ATR above its 20-period average (indicates volatility).
VWAP: Price below VWAP (optional, shown on chart for manual confirmation).
Visualization:Bullish Signal: Green triangle below the bar.
Bearish Signal: Red triangle above the bar.
VWAP: Plotted as a blue line for manual verification.
Table: Displays real-time metrics (Change %, Relative Volume, RSI, Price vs EMA, ATR, VWAP) in the top-right corner, color-coded (green for bullish, red for bearish).
Alerts:Separate alerts for bullish ("Intraday Bullish Signal") and bearish ("Intraday Bearish Signal") conditions.
Customizable alert messages include parameter values for easy tracking.
How It WorksThe script runs on the 1-hour (1H) timeframe, ensuring all calculations are based on hourly data.
Indicators are computed:Change %: Percentage price change over the last hour.
Relative Volume: Current volume divided by the 20-period SMA of volume.
RSI: 14-period Relative Strength Index.
EMA 13: 13-period Exponential Moving Average.
ATR: 14-period Average True Range, compared to its 20-period SMA.
VWAP: Volume Weighted Average Price, plotted for visual confirmation.
Signals are generated when all conditions for either bullish or bearish criteria are met.
A table summarizes key metrics, and alerts can be set up for real-time notifications.
Usage InstructionsApply the Script:Open TradingView’s Pine Editor.
Copy and paste the script.
Click "Add to Chart" and set the chart to the 1-hour (1H) timeframe.
Set Up Alerts:Right-click on the chart > "Add Alert".
Select "Intraday Bullish Signal" or "Intraday Bearish Signal" as the condition.
Configure notifications (e.g., SMS, email, or TradingView alerts).
Manual VWAP Check:VWAP is plotted as a blue line. Verify that the price is above VWAP for bullish signals or below for bearish signals using the table or chart.
To make VWAP a mandatory filter, uncomment the VWAP conditions in the bull_signal and bear_signal definitions.
