Uptrick: Imbalance MA Trailing System
### **Overview**
The "Uptrick: Imbalance MA Trailing System" is a complex trading indicator designed to help traders identify potential bullish and bearish imbalances in the market, coupled with a trailing stop mechanism to manage trades. The indicator uses a combination of moving averages, Average True Range (ATR), and custom logic to detect trading signals and plot various levels on the chart to assist traders in making informed decisions.
### **Key Components and Functionality**
#### 1. **Inputs and Configuration**
- **Imbalance Filter (`imbalanceFilter`)**: This input sets the filter for detecting imbalances based on the difference between two price points. The value is a float and can be adjusted to fine-tune the sensitivity of imbalance detection. The default value is `0.0`, with a step size of `0.1`.
- **Moving Average Settings (`maLength1`, `maLength2`, `maColor1`, `maColor2`)**:
- `maLength1` and `maLength2` define the lengths of the two moving averages used in the indicator. By default, they are set to `50` and `200` periods, respectively.
- `maColor1` and `maColor2` specify the colors of these moving averages on the chart. The first MA is colored blue, and the second is red.
- **Take Profit and Stop Loss Settings (`displayTP`, `tpMultiplier`, `tpColor`, `displaySL`, `slMultiplier`, `slColor`)**:
- `displayTP` and `displaySL` are boolean inputs that control whether the TP and SL areas are displayed on the chart.
- `tpMultiplier` and `slMultiplier` are multipliers used to calculate the TP and SL levels relative to the detected imbalance level using the ATR value.
- `tpColor` and `slColor` define the colors of these areas. The TP area is green (with a transparency of 50), and the SL area is red (with a transparency of 50).
- **Trailing Stop Settings (`trailMultiplier`)**: This setting determines the multiplier used to calculate the trailing stop level based on the ATR value. The default multiplier is `2.5`.
- **Style Settings (`bullishColor`, `bearishColor`)**:
- `bullishColor` and `bearishColor` set the colors for bullish and bearish zones created when an imbalance is detected. The bullish zone is green, and the bearish zone is red.
- **Signal Label Size (`labelSizeOption`)**: The size of the signal labels displayed on the chart can be adjusted. The options include `Tiny`, `Small`, `Normal`, `Large`, and `Huge`. The selected size affects the visual prominence of the labels.
#### 2. **ATR Calculation (`atrValue`)**
- The ATR value is calculated using a period of 14, which is a standard setting for measuring market volatility. This value is used extensively throughout the indicator to calculate TP, SL, and trailing stop levels.
#### 3. **Imbalance Detection and Zone Creation**
- The indicator detects potential imbalances in the market by comparing certain price points, using a custom function (`imbalanceCondition`).
- **Bullish Imbalance Detection (`bullishSignal`)**:
- A bullish imbalance is detected when the low of three bars ago is higher than the high of one bar ago, and the current close is above the low of three bars ago.
- Additional conditions include checking that the current close is above the calculated average of the two moving averages (`ma1` and `ma2`), and that the imbalance exceeds the threshold set by the `imbalanceFilter`.
- **Bearish Imbalance Detection (`bearishSignal`)**:
- A bearish imbalance is detected under conditions where the low of one bar ago is higher than the high of three bars ago, and the current close is below the high of three bars ago.
- Like the bullish signal, the close must also be below the average of the two moving averages, and the imbalance must exceed the `imbalanceFilter` threshold.
- Upon detection of an imbalance (either bullish or bearish), the indicator creates a zone using `box.new` that highlights the price range of the imbalance. The box color corresponds to the bullish or bearish nature of the signal.
- The center of the imbalance range is marked with a dashed line, and a corresponding label (`🔴` for bearish and `🟢` for bullish) is placed on the chart to indicate the detected signal.
#### 4. **Take Profit and Stop Loss Calculation (`calculateTPSL`)**
- When an imbalance is detected, the indicator calculates potential TP and SL levels based on the ATR value and the respective multipliers.
- If the TP or SL areas are enabled, the indicator plots these areas as colored boxes on the chart.
- The function also tracks whether these levels are hit by subsequent price action, updating the status (`reached`) as appropriate.
#### 5. **Trailing Stop Logic (`applyTrailingStop`)**
- The trailing stop feature is a dynamic mechanism that adjusts the stop level as the price moves in the trader's favor.
- The trailing stop is calculated using the ATR value multiplied by the `trailMultiplier`.
- If the trailing stop is triggered (i.e., the price crosses the trailing stop level), the indicator marks the trade as stopped out.
#### 6. **Plotting and Visualization**
- The indicator plots the two moving averages on the chart with the specified colors and line width.
- If a trailing stop is active, it plots the trailing stop level on the chart, updating as the stop moves.
- The bar color changes based on the status of the current signal and whether the trailing stop or TP/SL levels have been hit.
### **Detailed Execution Flow**
1. **Initialization**: The indicator initializes several variables, including lines, boxes, and the current signal state. This setup ensures that the script can dynamically update these elements as new price data comes in.
2. **Moving Average Calculation**: The moving averages (`ma1` and `ma2`) are calculated using simple moving average (SMA) functions, which are foundational for many of the indicator's conditions.
3. **Imbalance Detection**: The script evaluates price action to detect potential bullish or bearish imbalances, applying filters based on the user-defined `imbalanceFilter`.
4. **Zone Creation and Labeling**: Upon detecting an imbalance, the script creates visual zones on the chart using the `box.new` function and labels the zones for easy identification.
5. **Take Profit and Stop Loss Logic**: The TP and SL areas are calculated and plotted if the relevant settings are enabled. The script continuously checks if these levels are reached as new bars form.
6. **Trailing Stop Calculation**: The script dynamically adjusts the trailing stop level based on the price movement and ATR value. The trailing stop helps lock in profits as the trade progresses.
7. **Plotting**: The moving averages, trailing stop levels, and bar colors are plotted on the chart, providing a visual representation of the indicator's signals and trade management levels.
8. **Final Checks and Updates**: The script concludes each bar's processing by updating the status of various elements, such as whether levels have been reached or if the trailing stop has been triggered.
### **Conclusion**
The "Uptrick: Imbalance MA Trailing System" is a highly versatile indicator designed for traders who want to identify market imbalances and manage their trades effectively using a combination of moving averages, ATR-based calculations, and custom logic. The indicator offers a wide range of customization options, allowing traders to adjust the sensitivity of imbalance detection, the size of the signal labels, and the visibility of various trade management levels (TP, SL, and trailing stop).
The combination of these features makes it a powerful tool for both novice and experienced traders, providing clear visual cues and robust trade management capabilities directly on the chart.
Komut dosyalarını "take profit" için ara

Simple Fibonacci Retracement Strategy This strategy uses Fibonacci retracement to identify key levels in the market and helps traders find good entry and exit points. By understanding and using this strategy, traders can improve their trading decisions and increase their chances of success in the market.
This strategy, called the "Simple Fibonacci Retracement Strategy," is designed to help traders identify potential entry and exit points in the market based on Fibonacci retracement levels. The code is written in Pine Script and runs on the TradingView platform.
Overall Function
The strategy uses Fibonacci retracement levels to identify potential support and resistance levels in the market. This helps traders find good entry and exit points for trades, as well as set stop-loss and take-profit levels to minimize risk and maximize gains.
Main Components of the Code
1. Input Parameters
Lookback Period: The number of bars used to identify the highest high and lowest low.
Fibonacci Direction: The choice of whether Fibonacci levels are calculated from top to bottom or bottom to top.
Fibonacci Levels: Specific Fibonacci levels (23.6%, 38.2%, 50%, 61.8%) used to identify important price levels.
Take Profit and Stop Loss: The number of pips used to set take profit and stop loss levels.
2. Identification of Highest and Lowest Points
The code uses the lookback period to find the highest high (highestHigh) and the lowest low (lowestLow). These levels form the basis for calculating the Fibonacci levels.
3. Calculation of Fibonacci Levels
Based on the direction chosen by the user, the code calculates the various Fibonacci levels (0%, 23.6%, 38.2%, 50%, 61.8%, 100%).
4. Trading Logic
Long Signal: Generated when the price crosses above the 61.8% Fibonacci level from bottom to top.
Short Signal: Generated when the price crosses below the 38.2% Fibonacci level from top to bottom.
When a long or short signal is generated, the strategy opens a position and sets take profit and stop loss levels based on the input parameters.
5. Visualization
The strategy plots the Fibonacci levels on the chart to provide a visual representation of the calculated levels. This helps traders see where the levels are in relation to the current price.
6. Alerts
The code also has functionality to create alerts (commented out), which can notify traders of buy or sell signals.
How to Use the Strategy
Configure Parameters: Adjust the lookback period, Fibonacci direction, and levels for take profit and stop loss to your preferences.
View the Chart: The Fibonacci levels will be plotted on the chart, providing a visual overview of potential support and resistance levels.
Trade Signals: Follow the generated buy and sell signals. Set your parameters in settings and adjust according to the generated buy and sell signals in the strategy tester. The strategy will automatically set your take profit and stop loss levels.
Evaluation and Adjustment: Monitor the performance of the strategy and make adjustments as needed to optimize the results.
Norwegian
Denne strategien, kalt "Simple Fibonacci Retracement Strategy", er designet for å hjelpe tradere med å identifisere mulige inngangs- og utgangspunkter i markedet basert på Fibonacci-retracementnivåer. Koden er skrevet i Pine Script og kjøres på TradingView-plattformen.
Overordnet Funksjon
Strategien bruker Fibonacci-retracementnivåer for å identifisere potensielle støtte- og motstandsnivåer i markedet. Dette hjelper tradere med å finne gode inngangs- og utgangspunkter for handler, samt å sette stop-loss og take-profit nivåer for å minimere risiko og maksimere gevinster.
Hovedkomponenter i Koden
1. Input Parametere
Lookback Period: Antall barer som brukes til å identifisere høyeste høydepunkt og laveste lavpunkt.
Fibonacci Direction: Valg om Fibonacci-nivåene skal beregnes fra topp til bunn eller bunn til topp.
Fibonacci Levels: Spesifikke Fibonacci-nivåer (23.6%, 38.2%, 50%, 61.8%) som brukes til å identifisere viktige prisnivåer.
Take Profit og Stop Loss: Antall pips som brukes til å sette take profit og stop loss nivåer.
2. Identifikasjon av Høyeste og Laveste Punkt
Koden bruker lookback perioden for å finne det høyeste høydepunktet (highestHigh) og det laveste lavpunktet (lowestLow). Disse nivåene er grunnlaget for å beregne Fibonacci-nivåene.
3. Beregning av Fibonacci-nivåer
Basert på retningen valgt av brukeren, beregner koden de forskjellige Fibonacci-nivåene (0%, 23.6%, 38.2%, 50%, 61.8%, 100%).
4. Handelslogikk
Long Signal: Genereres når prisen krysser over 61.8% Fibonacci-nivået fra bunn til topp.
Short Signal: Genereres når prisen krysser under 38.2% Fibonacci-nivået fra topp til bunn.
Når et long eller short signal genereres, åpner strategien en posisjon og setter take profit og stop loss nivåer basert på inputparametrene.
5. Visualisering
Strategien plottet Fibonacci-nivåene på chartet for å gi en visuell representasjon av de beregnede nivåene. Dette hjelper tradere med å se hvor nivåene er i forhold til den nåværende prisen.
6. Varsler
Koden har også funksjonalitet for å lage varsler (kommentert ut), som kan varsle tradere om kjøps- eller salgssignaler.
Slik Bruker Du Strategien
Konfigurer Parametere: Juster lookback perioden, Fibonacci-retningen, og nivåene for take profit og stop loss til dine preferanser.
Se på Chartet: Fibonacci-nivåene vil bli plottet på chartet, noe som gir deg en visuell oversikt over potensielle støtte- og motstandsnivåer.
Handle Signaler: Sett dine parametere i innstillinger og juster etter genererte kjøps- og salgssignalene i strategy testeren. Strategien vil automatisk sette dine take profit og stop loss nivåer.
Evaluering og Justering: Overvåk ytelsen til strategien og gjør justeringer etter behov for å optimalisere resultatene.

Strategy SEMA SDI WebhookPurpose of the Code:
The strategy utilizes Exponential Moving Averages (EMA) and Smoothed Directional Indicators (SDI) to generate buy and sell signals. It includes features like leverage, take profit, stop loss, and trailing stops. The strategy is intended for backtesting and automating trades based on the specified indicators and conditions.
Key Components and Functionalities:
1.Strategy Settings:
Overlay: The strategy will overlay on the price chart.
Slippage: Set to 1.
Commission Value: Set to 0.035.
Default Quantity Type: Percent of equity.
Default Quantity Value: 50% of equity.
Initial Capital: Set to 1000 units.
Calculation on Order Fills: Enabled.
Process Orders on Close: Enabled.
2.Date and Time Filters:
Inputs for enabling/disabling start and end dates.
Filters to execute strategy only within specified date range.
3.Leverage and Quantity:
Leverage: Adjustable leverage input (default 3).
USD Percentage: Adjustable percentage of equity to use for trades (default 50%).
Initial Capital: Calculated based on leverage and percentage of equity.
4.Take Profit, Stop Loss, and Trailing Stop:
Inputs for enabling/disabling take profit, stop loss, and trailing stop.
Adjustable parameters for take profit percentage (default 25%), stop loss percentage (default 4.8%), and trailing stop percentage (default 1.9%).
Calculations for take profit, stop loss, trailing price, and maximum profit tracking.
5.EMA Calculations:
Fast and slow EMAs.
Smoothed versions of the fast and slow EMAs.
6.SDI Calculations:
Directional movement calculation for positive and negative directional indicators.
Difference between the positive and negative directional indicators, smoothed.
7.Buy/Sell Conditions:
Long (Buy) Condition: Positive DI is greater than negative DI, and fast EMA is greater than slow EMA.
Short (Sell) Condition: Negative DI is greater than positive DI, and fast EMA is less than slow EMA.
8.Strategy Execution:
If buy conditions are met, close any short positions and enter a long position.
If sell conditions are met, close any long positions and enter a short position.
Exit conditions for long and short positions based on take profit, stop loss, and trailing stop levels.
Close all positions if outside the specified date range.
Usage:
This strategy is used to automate trading based on the specified conditions involving EMAs and SDI. It allows backtesting to evaluate performance based on historical data. The strategy includes risk management through take profit, stop loss, and trailing stops to protect gains and limit losses. Traders can customize the parameters to fit their specific trading preferences and risk tolerance. Differently, it can perform leverage analysis and use it as a template.
By using this strategy, traders can systematically execute trades based on technical indicators, helping to remove emotional bias and improve consistency in trading decisions.
Important Note:
This script is provided for educational and template purposes and does not constitute financial advice. Traders and investors should conduct their research and analysis before making any trading decisions.

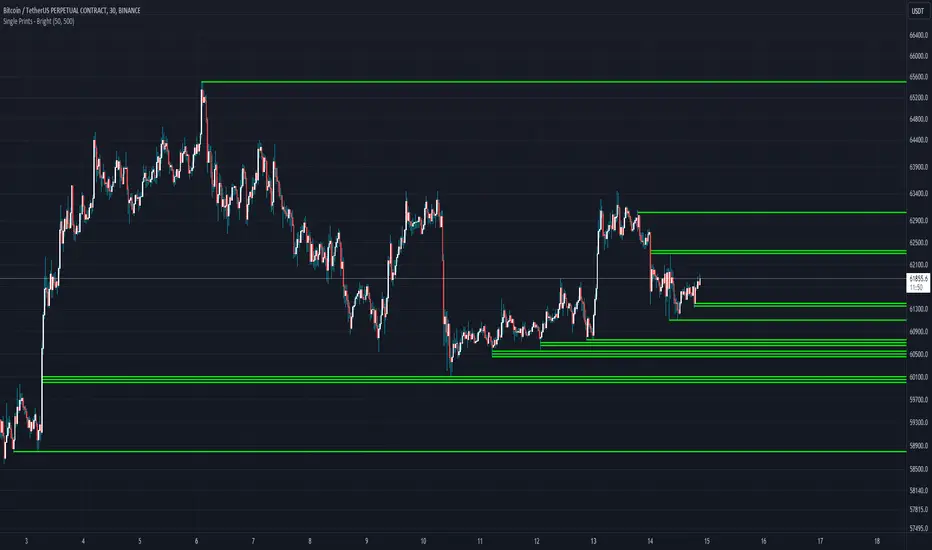
Single Prints - BrightSingle Prints - Bright is a Pine Script indicator designed to identify and visualize significant price levels based on the concept of "single prints." Single prints are price levels where trading activity occurred but with little or no follow-up trading. This indicator plots these levels as lines on the chart, allowing traders to easily identify areas of potential support and resistance.
Features:
Customizable Line Distance: Adjust the distance between single print lines to suit your trading style and time frame.
Maximum Array Size: Set the maximum number of single print lines to be displayed on the chart.
Remove Gaps: Option to remove lines if the price gaps over them.
Multiple Time Frames: Choose to display single prints for daily, weekly, monthly, or yearly sessions.
Color Gradient: Lines are color-coded from red (oldest) to green (newest), providing a visual indication of their relative age.
Thicker, Lime-Colored Lines: Improved visibility with thicker lines and a more lime-like color scheme for easier identification on the chart.
How to Use:
Adding the Indicator:
Open TradingView and navigate to the chart where you want to apply the indicator.
Click on "Indicators" in the top menu.
Select "Pine Editor" and paste the provided Pine Script code into the editor.
Click "Add to Chart" to apply the indicator to your chart.
Configuring the Indicator:
Distance Between Lines (i_line_distance): Set the distance between single print lines. Adjust this value based on the volatility and time frame of the asset you are trading.
Maximum Array Size (i_max_array): Define the maximum number of single print lines to be displayed on the chart. This helps in managing the clutter on the chart.
Remove Gaps (i_remove_gaps): Enable or disable the option to remove lines if the price gaps over them.
Show Daily Single Prints (ShowDailySP): Enable or disable the display of daily single print lines.
Show Daily Extended Single Prints (ShowDailyExtendSP): Enable or disable the display of extended daily single print lines.
Show Weekly Single Prints (ShowWeeklySP): Enable or disable the display of weekly single print lines.
Show Monthly Single Prints (ShowMonthlySP): Enable or disable the display of monthly single print lines.
Show Yearly Single Prints (ShowYearlySP): Enable or disable the display of yearly single print lines.
Interpreting the Lines:
Color Gradient: The lines are color-coded to indicate their relative age. Red lines are the oldest, transitioning through orange and yellow to green, which are the newest. This color gradient helps in identifying how long a particular level has been significant.
Support and Resistance: Use the lines as potential support and resistance levels. Multiple lines close together indicate stronger levels of support or resistance.
Volatility Analysis: The number of lines within a gap can provide insights into market volatility. More lines indicate higher volatility and multiple potential reversal points within that range.
Trading Strategies:
Entry Points: Consider using the single print lines as entry points. For example, if the price approaches a support level with multiple lines, it may be a good buying opportunity.
Stop Loss and Take Profit: Use the single print lines to set stop-loss and take-profit levels. Placing stop-loss orders below multiple support lines can provide additional protection.
Trend Analysis: Analyze the overall trend and momentum in conjunction with the single print lines to make informed trading decisions. If the price is in an uptrend and approaching resistance lines, watch for potential breakouts or reversals.
Fibonacci Trend Reversal StrategyIntroduction
This publication introduces the " Fibonacci Retracement Trend Reversal Strategy, " tailored for traders aiming to leverage shifts in market momentum through advanced trend analysis and risk management techniques. This strategy is designed to pinpoint potential reversal points, optimizing trading opportunities.
Overview
The strategy leverages Fibonacci retracement levels derived from @IMBA_TRADER's lance Algo to identify potential trend reversals. It's further enhanced by a method called " Trend Strength Over Time " (TSOT) (by @federalTacos5392b), which utilizes percentile rankings of price action to measure trend strength. This also has implemented Dynamic SL finder by utilizing @veryfid's ATR Stoploss Finder which works pretty well
Indicators:
Fibonacci Retracement Levels : Identifies critical reversal zones at 23.6%, 50%, and 78.6% levels.
TSOT (Trend Strength Over Time) : Employs percentile rankings across various timeframes to gauge the strength and direction of trends, aiding in the confirmation of Fibonacci-based signals.
ATR (Average True Range) : Implements dynamic stop-loss settings for both long and short positions, enhancing trade security.
Strategy Settings :
- Sensitivity: Set default at 18, adjustable for more frequent or sparse signals based on market volatility.
- ATR Stop Loss Finder: Multiplier set at 3.5, applying the ATR value to determine stop losses dynamically.
- ATR Length: Default set to 14 with RMA smoothing.
- TSOT Settings: Hard-coded to identify percentile ranks, with no user-adjustable inputs due to its intrinsic calculation method.
Trade Direction Options : Configurable to support long, short, or both directions, adaptable to the trader's market assessment.
Entry Conditions :
- Long Entry: Triggered when the price surpasses the mid Fibonacci level (50%) with a bullish TSOT signal.
- Short Entry: Activated when the price falls below the mid Fibonacci level with a bearish TSOT indication.
Exit Conditions :
- Employs ATR-based dynamic stop losses, calibrated according to current market volatility, ensuring effective risk management.
Strategy Execution :
- Risk Management: Features adjustable risk-reward settings and enables partial take profits by default to systematically secure gains.
- Position Reversal: Includes an option to reverse positions based on new TSOT signals, improving the strategy's responsiveness to evolving market conditions.
The strategy is optimized for the BYBIT:WIFUSDT.P market on a scalping (5-minute) timeframe, using the default settings outlined above.
I spent a lot of time creating the dynamic exit strategies for partially taking profits and reversing positions so please make use of those and feel free to adjust the settings, tool tips are also provided.
For Developers: this is published as open-sourced code so that developers can learn something especially on dynamic exits and partial take profits!
Good Luck!
Disclaimer
This strategy is shared for educational purposes and must be thoroughly tested under diverse market conditions. Past performance does not guarantee future results. Traders are advised to integrate this strategy with other analytical tools and tailor it to specific market scenarios. I was only sharing what I've crafted while strategizing over a Solana Meme Coin.

Channels With NVI Strategy [TradeDots]The "Channels With NVI Strategy" is a trading strategy that identifies oversold market instances during a bullish trading market. Specifically, the strategy integrates two principal indicators to deliver profitable opportunities, anticipating potential uptrends.
2 MAIN COMPONENTS
1. Channel Indicators: This strategy gives users the flexibility to choose between Bollinger Band Channels or Keltner Channels. This selection can be made straight from the settings, allowing the traders to adjust the tool according to their preferences and strategies.
2. Negative Volume Indicator (NVI): An indicator that calculates today's price rate of change, but only when today's trading volume is less than the previous day's. This functionality enables users to detect potential shifts in the trading volume with time and price.
ENTRY CONDITION
First, the assets price must drop below the lower band of the channel indicator.
Second, NVI must ascend above the exponential moving average line, signifying a possible flood of 'smart money' (large institutional investors or savvy traders), indicating an imminent price rally.
EXIT CONDITION
Exit conditions can be customized based on individual trading styles and risk tolerance levels. Traders can define their ideal take profit or stop loss percentages.
Moreover, the strategy also employs an NVI-based exit policy. Specifically, if the NVI dips under the exponential moving average – suggestive of a fading trading momentum, the strategy grants an exit call.
RISK DISCLAIMER
Trading entails substantial risk, and most day traders incur losses. All content, tools, scripts, articles, and education provided by TradeDots serve purely informational and educational purposes. Past performances are not definitive predictors of future results.

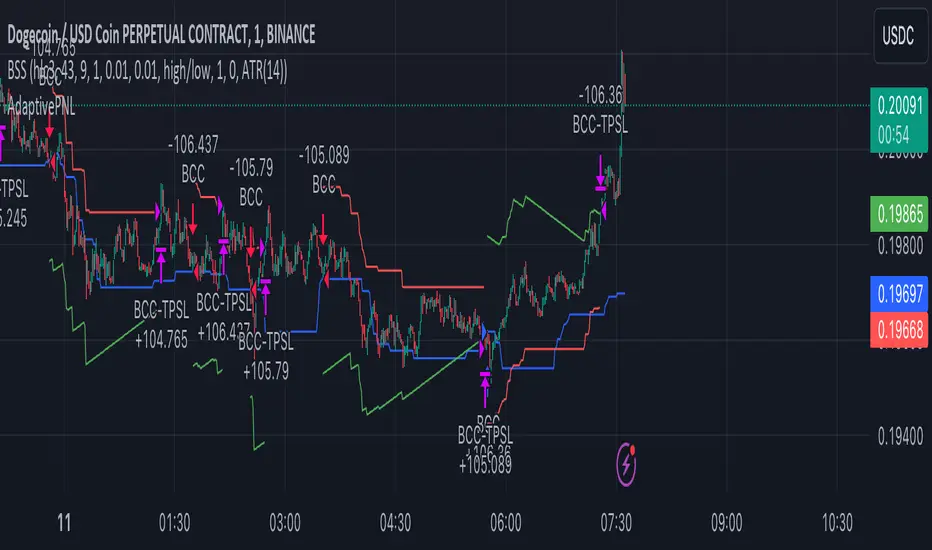
AdaptivePNLLibrary "Adaptive Profit And Loss"
Provide Take profit and Stop loss values depending on source.
TakeProfitPriceTypes()
Provides supported Take profit sources
Returns: Supported Take profit sources
StopLossPriceTypes()
Provides supported Take profit sources
Returns: Supported Take profit sources
Price(type)
Get price value by selected price type
Parameters:
type (string) : price type from @TakeProfitPriceTypes() or @StopLossPriceTypes()
Returns: Required price value.
LinearProfit(initPerc, stepPerc)
Lineary changed profit
Parameters:
initPerc (float) : Initial profit value in percent unit
stepPerc (float) : Amount of change per every bar since last entry. Posiitive value will decrease profit in time.
Returns: Profit value lineary increased/decreased since last entry. If there is no opened trade, value is NaN
AdaptedProfit(initPerc, stepPerc, source)
Profit adapted to lowest/highest value of given source and lineary changes after it
Parameters:
initPerc (float) : Initial profit value in percent unit
stepPerc (float) : Amount of change per every bar since last entry. Posiitive value will decrease profit in time.
source (float) : Source according to is profit adapted. If it reach high, profit is increased for long positions, same for low and short positions.
Returns: Profit value lineary increased/decreased and adjusted since last entry. If there is no active trade, value is NaN
LinearStopLoss(initPerc, stepPerc)
Lineary changed stop loss
Parameters:
initPerc (float) : Initial stop loss value in percent unit
stepPerc (float) : Amount of change per every bar since last entry. Posiitive value will increase stop loss in time.
Returns: Stop loss value lineary increased/decreased since last entry. If there is no opened trade, value is NaN
AdaptedStopLoss(initPerc, stepPerc, source)
Stop loss adapted to highest/lowest value of given source and lineary changes after it
Parameters:
initPerc (float) : Initial stop loss value in percent unit
stepPerc (float) : Amount of change per every bar since last entry. Posiitive value will increase stop loss in time.
source (float) : Source according to is stop loss adapted. If it reach high, stop loss is increased for long positions, same for low and short positions.
Returns: Stop loss value lineary increased/decreased and adjusted since last entry. If there is no active trade, value is NaN
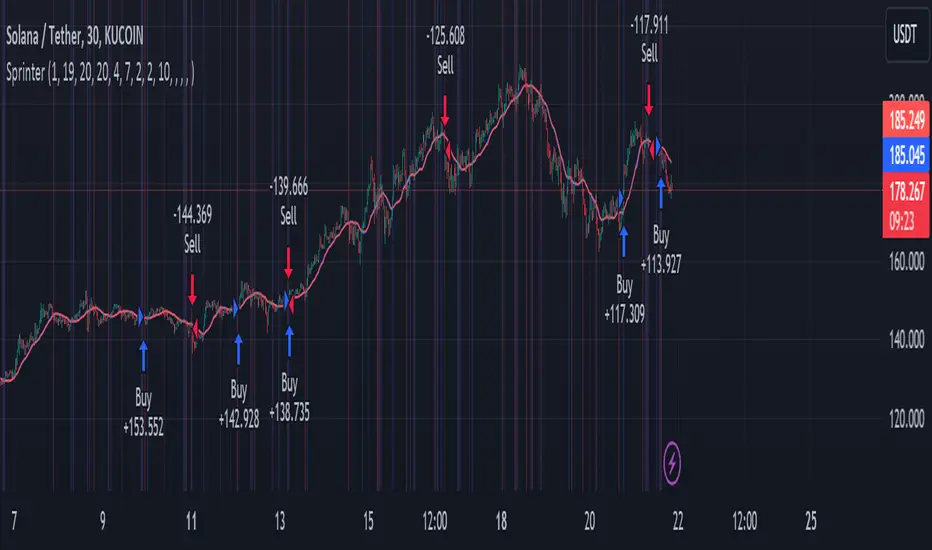
Big RunnerPresenting the "Big Runner" technique, dubbed "Sprinter," which is intended to help traders looking for momentum chances recognise important market swings. This approach maximises profit potential while controlling risk by using trend ribbons and moving averages to identify entry and exit locations.
Important characteristics:
Moving Averages: To determine the direction of the underlying trend, moving averages, both rapid and slow, are used. Depending on their preferred trading strategy, traders can alter the duration of these averages.
Trend Ribbon: Shows phases of bullish and bearish momentum by using a ribbon indicator to visualise the strength of the trend. Trend transitions are simple to spot for traders so they can make wise decisions.
Buy and Sell Signals: This tool generates buy and sell signals that indicate possible entry and exit opportunities based on the crossing and crossunder of moving averages.
Stop Loss/Take Profit Management: This feature enables traders to successfully apply risk management methods by giving them the ability to set stop loss and take profit levels as a percentage of the entry price.
Dynamic Position Sizing: Optimises capital allocation for every trade by dynamically calculating position size depending on leverage and portfolio proportion.
Implementation:
Long Entry: Started when a bullish trend is indicated by a price cross above the fast and slow moving averages. To control risk and lock in earnings, stop loss and take profit thresholds are established appropriately.
Short Entry: Indicates a bearish trend when the price crosses below both moving averages. The concepts of risk management are similar, with dynamic calculations used to determine take-profit and stop-loss levels.
Extra Personalisation:
Take Profit/Stop Loss Management: Provides the ability to select a take profit and stop loss
API Integration: This feature improves execution flexibility and efficiency by enabling traders to include custom parameters for automated trading.
Notice:
Trading entails risk, and performances in the past do not guarantee future outcomes. Before making any trades with this approach, careful analysis and risk management are necessary.
In summary:
By integrating risk management procedures with technical indicators, the "Big Runner" strategy provides a thorough method for identifying noteworthy market changes and achieving the best possible trading results. Traders can adjust parameters to suit their interests and style of trading, giving them the confidence to traverse volatile market situations.
ATR Bands with Optional Risk/Reward Colors█ OVERVIEW
This indicator projects ATR bands and, optionally, colors them based on a risk/reward advantage for those who trade breakouts/breakdowns using moving averages as partial or full exit points.
█ DEFINITIONS
► True Range
The True Range is a measure of the volatility of a financial asset and is defined as the maximum difference among one of the following values:
- The high of the current period minus the low of the current period.
- The absolute value of the high of the current period minus the closing price of the previous period.
- The absolute value of the low of the current period minus the closing price of the previous period.
► Average True Range
The Average True Range was developed by J. Welles Wilder Jr. and was introduced in his 1978 book titled "New Concepts in Technical Trading Systems". It is calculated as an average of the true range values over a certain number of periods (usually 14) and is commonly used to measure volatility and set stop-loss and profit targets (1).
For example, if you are looking at a daily chart and you want to calculate the 14-day ATR, you would take the True Range of the previous 14 days, calculate their average, and this would be the ATR for that day. The process is then repeated every day to obtain a series of ATR values over time.
The ATR can be smoothed using different methods, such as the Simple Moving Average (SMA), the Exponential Moving Average (EMA), or others, depending on the user's preferences or analysis needs.
► ATR Bands
The ATR bands are created by adding or subtracting the ATR from a reference point (usually the closing price). This process generates bands around the central point that expand and contract based on market volatility, allowing traders to assess dynamic support and resistance levels and to adapt their trading strategies to current market conditions.
█ INDICATOR
► ATR Bands
The indicator provides all the essential parameters for calculating the ATR: period length, time frame, smoothing method, and multiplier.
It is then possible to choose the reference point from which to create the bands. The most commonly used reference points are Open, High, Low, and Close, but you can also choose the commonly used candle averages: HL2, HLC3, HLCC4, OHLC4. Among these, there is also a less common "OC2", which represents the average of the candle body. Additionally, two parameters have been specifically created for this indicator: Open/Close and High/Low.
With the "Open/Close" parameter, the upper band is calculated from the higher value between Open and Close, while the lower one is calculated from the lower value between Open and Close. In the case of bullish candles, therefore, the Close value is taken as the starting point for the upper band and the Open value for the lower one; conversely, in bearish candles, the Open value is used for the upper band and the Close value for the lower band. This setting can be useful for precautionally generating broader bands when trading with candlesticks like hammers or inverted hammers.
The "High/Low" parameter calculates the upper band starting from the High and the lower band starting from the Low. Among all the available options, this one allows drawing the widest bands.
Other possible options to improve the drawing of ATR bands, aligning them with the price action, are:
• Doji Smoothing: When the current candle is a doji (having the same Open and Close price), the bands assume the values they had on the previous candle. This can be useful to avoid steep fluctuations of the bands themselves.
• Extend to High/Low: Extends the bands to the High or Low values when they exceed the value of the band.
• Round Last Cent: Expands the upper band by one cent if the price ends with x.x9, and the lower band if the price ends with x.x1. This function only works when the asset's tick is 0.01.
► Risk/Reward Advantage
The indicator optionally colors the ATR bands after setting a breakpoint, one or two risk/reward ratios, and a series of moving averages. This function allows you to know in advance whether entering a trade can provide an advantage over the risk. The band is colored when the ratio between the distance from the break point to the band and the distance from the break point to the first available moving average reaches at least the set ratio value. It is possible to set two colorings, one for a minimum risk/reward ratio and one for an optimal risk/reward ratio.
The break point can be chosen between High/Low (High in case of breakout, Low in case of breakdown) or Open/Close (on breakouts, Close with bullish candles or Open with bearish candles; on breakdowns, Close with bearish candles or Open with bullish candles).
It is possible to choose up to 10 moving averages of various types, including the VWAP with the Anchor Period (2).
Depending on the "Price to MA" setting, the bands can be individually or simultaneously colored.
By selecting "Single Direction," the risk/reward calculation is performed only when all moving averages are above or below the break point, resulting in only one band being colored at a time. For this reason, when the break point is in between the moving averages, the calculation is not executed. This setting can be useful for strategies involving price movement from a level towards a series of specific moving averages (for example, in reversals starting from a certain level towards the VWAP with possible partial take profits on some previous moving averages, or simply in trend following towards one or more moving averages).
Choosing "Both Directions" the risk/reward ratio is calculated based on the first available moving averages both above and below the price. This setting is useful for those who operate in range bound markets or simply take advantage of movements between moving averages.
█ NOTE
This script may not be suitable for scalping strategies that require immediate entries due to the inability to know the ATR of a candle in advance until its closure. Once the candle is closed, you should have time to place a stop or stop-limit order, so your strategy should not anticipate an immediate start with the next candle. Even more conveniently, if your strategy involves an entry on a pullback, you can place a limit order at the breakout level.
(1) www.tradingview.com
(2) For convenience, the code for the Anchor Period has been entirely copied from the VWAP code provided by TradingView.

Trailing Support and Resistance Zones
This Script code is used to plot support and resistance levels on a chart. Here's how it works:
Input Parameters: The code starts by defining an input parameter lookback_period, which determines the number of bars to look back when calculating support and resistance levels. You can adjust this parameter based on your preferences or trading strategy. I recommend 50 for longer trends and larger profits.
Calculate Support and Resistance Levels: The calculateSR() function is defined to calculate the support and resistance levels based on the lowest low and highest high prices within the specified lookback period. It uses the ta.lowest() function to find the lowest low price and the ta.highest() function to find the highest high price over the specified number of bars.
Plotting: The function calculateSR() is called to compute the support and resistance levels, and the results are stored in the variables support_level and resistance_level, respectively. These levels are then plotted on the chart using the plot() function. The support levels are plotted in green, while the resistance levels are plotted in red. Both lines are drawn with a specified line width and style (plot.style_stepline).
By visualizing these support and resistance levels on the chart, you can identify potential price levels where the market might find buying or selling pressure. These levels are crucial for making trading decisions, such as setting entry and exit points, defining stop-loss and take-profit levels, and assessing the overall market sentiment.
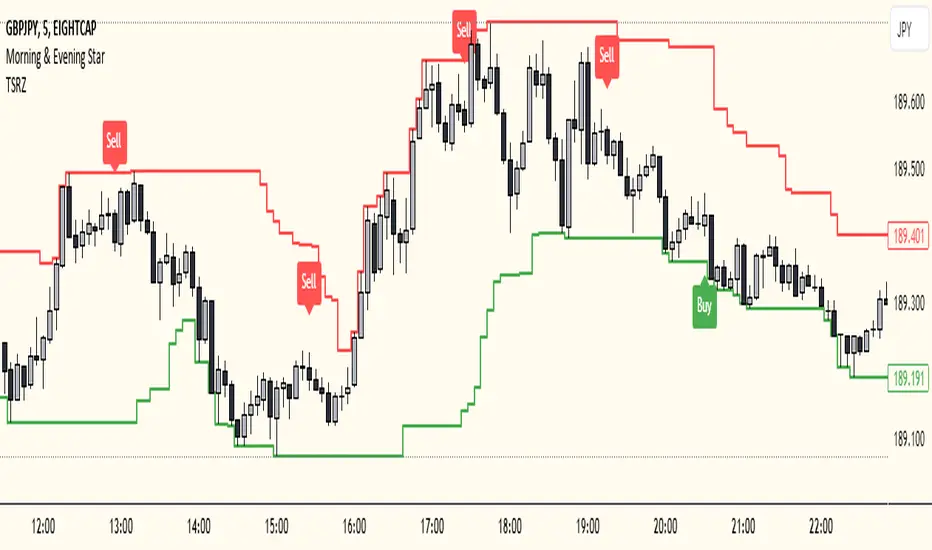
I recommend using this indicator together with my morning & Evening Star Indicator to find entry zones.
Xen's Flag Pattern Scalper1. Input Parameters:
FlagLength: Determines the length of the flag pattern.
TakeProfit1Ratio, takeProfit2Ratio, takeProfit3Ratio: Define the ratios for calculating
the take-profit levels relative to the entry price.
RiskRewardRatio: Specifies the risk-reward ratio for calculating the stop-loss level
relative to the entry price.
2 Flag Conditions:
BullishFlag: Checks if the current bar meets the conditions for a bullish flag pattern. It
evaluates to true if the low of the current bar is lower than the low flagLength bars
ago, and the close of the current bar is higher than the high flagLength bars ago.
BearishFlag: Checks if the current bar meets the conditions for a bearish flag pattern. It evaluates to true if the high of the current bar is higher than the high flagLength bars
ago, and the close of the current bar is lower than the low flagLength bars ago.
3. Entry Price:
EntryPrice: Calculates the entry price based on whether a bullish or bearish flag
pattern is identified. For a bullish flag, the entry price is set to the low of the current bar.
For a bearish flag, the entry price is set to the high of the current bar.
4. Stop Loss:
StopLoss: Determines the stop-loss level based on the entry price and the specified
riskRewardRatio . For a bullish flag, the stop-loss level is calculated by subtracting the
difference between the high and low of the current bar multiplied by the riskRewardRatio from the low of the current bar. For a bearish flag, the stop-loss level
is calculated similarly but added to the high of the current bar.
5. Take Profit Levels:
Three take-profit levels ( takeProfit1, takeProfit2, takeProfit3 ) are calculated based on
the entry price, stop-loss level, and specified take-profit ratios ( takeProfit1Ratio,
takeProfit2Ratio, takeProfit3Ratio ).
6. Plotting Signals and Levels:
Bullish and bearish flag patterns are plotted using triangle shapes ( shape.triangleup for
bullish and shape.triangledown for bearish) above or below the bars, respectively.
Entry, stop-loss, and take-profit levels are plotted using horizontal lines ( line.new )
with different colors and styles. Entry and stop-loss levels are labeled with "Entry" and "SL",
respectively, while take-profit levels are labeled with "TP 1", "TP 2", and "TP 3".
The colors for bullish flags are white for entry, red for stop-loss, and green for take-profit levels. For bearish flags, the colors are the same, but the labels are plotted above the bars.
7. Label Placement:
Labels for entry, stop-loss, and take-profit levels are placed a distance of 4 bars to the right
of the entry price using bar_index + 4 .
This indicator is intended to help traders identify flag patterns on price charts and visualize potential entry, stop-loss, and take-profit levels associated with these patterns.
Please use risk management and when TP1 is hit, move stoploss to breakeven .

Backtest any Indicator v5Happy Trade,
here you get the opportunity to backtest any of your indicators like a strategy without converting them into a strategy. You can choose to go long or go short and detailed time filters. Further more you can set the take profit and stop loss, initial capital, quantity per trade and set the exchange fees. You get an overall result table and even a detailed, scroll-able table with all trades. In the Image 1 you see the provided info tables about all Trades and the Result Summary. Further more every trade is marked by a background color, Labels and Levels. An opening Label with the trade direction and trade number. A closing Label again with the trade number, the trades profit in % and the total amount of $ after all past trades. A green line for the take profit level and a red line for the stop loss.
Image 1
Example
For this description we choose the Stochastic RSI indicator from TradingView as it is. In Image 2 is shown the performance of it with decent settings.
Timeframe=45, BTCUSD, 2023-08-01 - 2023-10-20
Stoch RSI: k=30, d=40, RSI-length=140, stoch-length=140
Backtest any Indicator: input signal=Stoch RSI, goLong, take profit=9.1%, stop loss=2.5%, start capital=1000$, qty=5%, fee=0.1%, no Session Filter
Image 2
Usage
1) You need to know the name of the boolean (or integer) variable of your indicator which hold the buy condition. Lets say that this boolean variable is called BUY. If this BUY variable is not plotted on the chart you simply add the following code line at the end of your pine script.
For boolean (true/false) BUY variables use this:
plot(BUY ? 1:0,'Your buy condition hold in that variable BUY',display = display.data_window)
And in case your script's BUY variable is an integer or float then use instate the following code line:
plot(BUY ,'Your buy condition hold in that variable BUY',display = display.data_window)
2) Probably the name of this BUY variable in your indicator is not BUY. Simply replace in the code line above the BUY with the name of your script's trade condition variable.
3) Save your changed Indicator script.
4) Then add this 'Backtest any Indicator' script to the chart ...
5) and go to the settings of it. Choose under "Settings -> Buy Signal" your Indicator. So in the example above choose .
The form is usually: ' : BUY'. Then you see something like Image 2
6) Decide which trade direction the BUY signal should trigger. A go Long or a go Short by set the hook or not.
Now you have a backtest of your Indicator without converting it into a strategy. You may change the setting of your Indicator to the best results and setup the following strategy settings like Time- and Session Filter, Stop Loss, Take Profit etc. More of it below in the section Settings Menu.
Appereance
In the Image 2 you see on the right side the List of Trades . To scroll down you go into the settings again and decrease the scroll value. So you can see all trades that have happened before. In case there is an open trade you will find it at the last position of the list.
Every Long trade is green back grounded while Short trades are red.
Every trade begins with a label that show goLong or goShort and its number. And ends with another label again with its number, Profit in % and the resulting total amount of cash.
If activated you further see the Take Profit as a green line and the Stop Loss as a orange line. In the settings you can set their percentage above or below the entry price.
You also see the Result Summary below. Here you find the usual stats of a strategy of all closed trades. The profit after total amount of fees , amount of trades, Profit Factor and the total amount of fees .
Settings Menu
In the settings menu you will find the following high-lighted sections. Most of the settings have a question mark on their right side. Move over it with the cursor to read specific explanation.
Input Signal of your Indicator: Under Buy you set the trade signal of your Indicator. And under Target you set the value when a trade should happen. In the Example with the Stochastic RSI above we used 20. Below you can set the trade direction, let it be go short when hooked or go long when unhooked.
Trade Settings & List of Trades: Take Profit set the target price of any trade. Stop Loss set the price to step out when a trade goes the wrong direction. Check mark the List of Trades to see any single trade with their stats. In case that there are more trades as fits in the list you can scroll down the list by decrease the value Scroll .
Time Filter: You can set a Start Time or deactivate it by leave it unhooked. The same with End Time .
Session Filter: here you can choose to activate it on weekly base. Which days of the week should be trading and those without. And also on daily base from which time on and until trade are possible. Outside of all times and sessions there will be no new trades if activated.
Invest Settings: here you can choose the amount of cash to start with. The Quantity percentage define for every trade how much of the cash should be invested and the Fee percentage which have to be payed every trade. Open position and closing position.
Other Announcements
This Backtest script don't use the strategy functions of TradingView. It is programmed as an indicator. All trades get executed at candle closing. This script use the functionality "Indicator-on-Indicator" from TradingView.
Conclusion
So now it is your turn, take your promising indicators and connect it to that Backtest script. With it you get a fast impression of how successful your indicator will trade. You don't have to relay on coders who maybe add cheating code lines. Further more you can check with the Time Filter under which market condition you indicator perform the best or not so well. Also with the Session Filter you can sort out repeating good market conditions for your indicator. Even you can check with the GoShort XOR GoLong check mark the trade signals of you indicator in opposite trade direction with one click. And compare your indicators under the same conditions and get the results just after 2 clicks. Thanks to the in-build fee setting you get an impression how much a 0.1% fee cost you in total.
Cheers

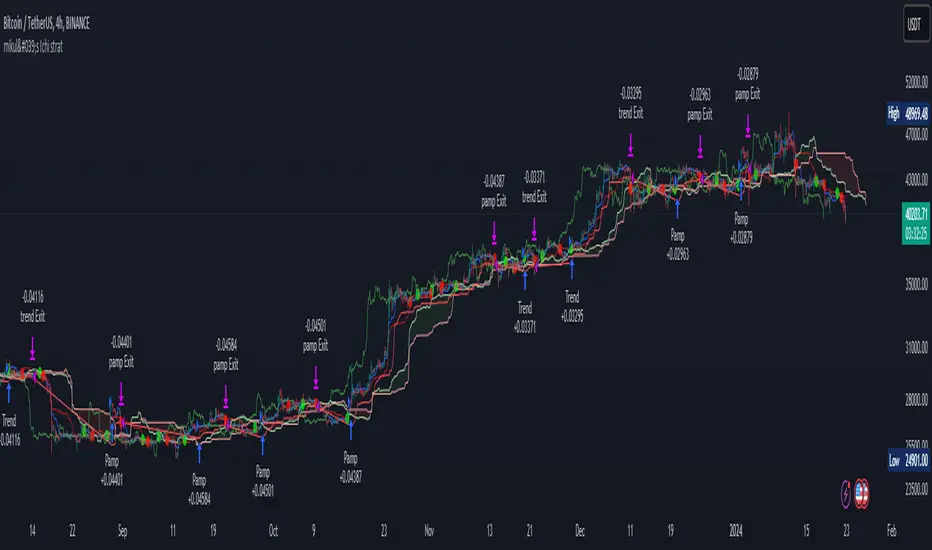
mikul's Ichimoku Cloud Strategy v 2.0This is an Ichimoku cloud (long) strategy with both pump signals and trend signals.
It has both ATR stop loss, trailing percentage stop loss and also ichomoku cloud exit signal.
You can also combine the ATR stop loss and the trailing percentage stop loss with the Ichimoku cloud exit signal and a the take profit percentage.
In this example I use the default ATR stop loss method for taking profit.
10000$ is my initial capital and I risking 10% every trade. Commission is set to 0.075%.
Everything is set to default in this example.
There is also a moving average filter that is available, set to 200 EMA and turned off by default.
Conditions for taking a long position:
Trend Signal:
• Positive cross above the cloud
• Chikou span(lagging span) above price action
• Price above the Cloud
Pump Signal:
• Cloud ahead of you is green
• Price above the cloud
• Positive cross (Doesn’t Matter Where)
• Chikou span(lagging span) above the cloud
Ichimoku cloud exit signals:
• Negative cross
• Chikou span(lagging span) touches the price action
This strategy is totally free as freedom and as in free beer!
I do this for myself, but I like sharing and I want everyone to have the ability to use what I make no matter your economic situation.
If you have any suggestions for this strategy or perhaps any filtering options that could be fun to experiment with, then please leave a comment with your suggestion and maybe I can add it to the next version.
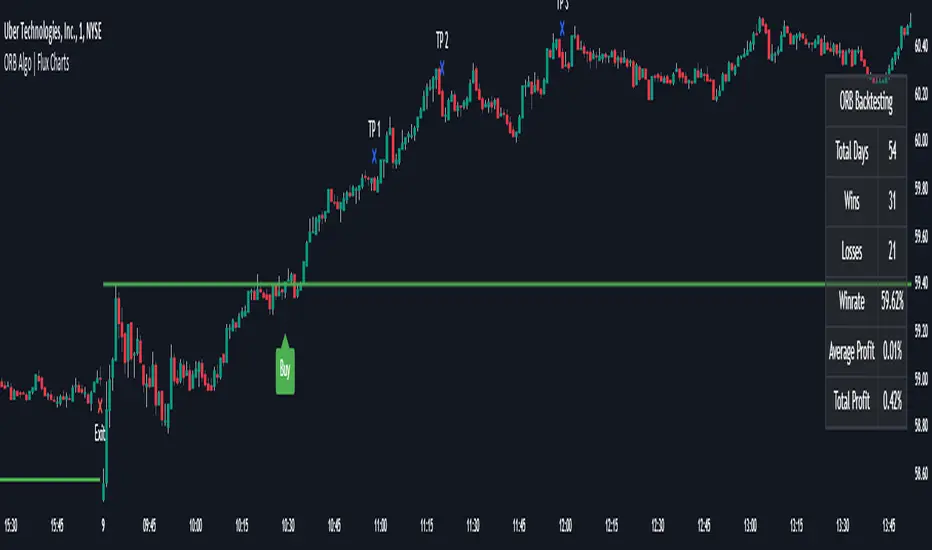
ORB Algo | Flux Charts💎 GENERAL OVERVIEW
Introducing our new ORB Algo indicator! ORB stands for "Opening Range Breakout" which is a common trading strategy. The indicator can analyze the market trend in the current session and give "Buy / Sell", "Take Profit" and "Stop Loss" signals. For more information about the analyzing process of the indicator, you can read "How Does It Work ?" section of the description.
Features of the new ORB Algo indicator :
Buy & Sell Signals
Up To 3 Take Profit Signals
Stop-Loss Signals
Alerts for Buy / Sell, Take-Profit and Stop-Loss
Customizable Algoritm
Session Dashboard
Backtesting Dashboard
📌 HOW DOES IT WORK ?
This indicator works best in 1-minute timeframe. The idea is that the trend of the current session can be forecasted by analyzing the market for a while after the session starts. However, each market has it's own dynamics and the algorithm will need fine-tuning to get the best performance possible. So, we've implemented a "Backtesting Dashboard" that shows the past performance of the algorithm in the current ticker with your current settings. Always keep in mind that past performance does not guarantee future results.
Here are the steps of the algorithm explained briefly :
1. The algorithm follows and analyzes the first 30 minutes (can be adjusted) of the session.
2. Then, algorithm checks for breakouts of the opening range's high or low.
3. If a breakout happens in a bullish or a bearish direction, the algorithm will now check for retests of the breakout. Depending on the sensitivity setting, there must be 0 / 1 / 2 / 3 failed retests for the breakout to be considered as reliable.
4. If the breakout is reliable, the algorithm will give an entry signal.
5. After the position entry, algorithm will now wait for Take-Profit or Stop-Loss zones and signal if any of them occur.
If you wonder how does the indicator find Take-Profit & Stop-Loss zones, you can check the "Settings" section of the description.
🚩UNIQUENESS
While there are indicators that show the opening range of the session, they come short with features like indicating breakouts, entries, and Take-Profit & Stop-Loss zones. We are also aware of that different stock markets have different dynamics, and tuning the algorithm for different markets is really important for better results, so we decided to make the algorithm fully customizable. Besides all that, our indicator contains a detailed backtesting dashboard, so you can see past performance of the algorithm in the current ticker. While past performance does not yield any guarantee for future results, we believe that a backtesting dashboard is necessary for tuning the algorithm. Another strength of this indicator is that there are multiple options for detection of Take-Profit and Stop-Loss zones, which the trader can select one of their liking.
⚙️SETTINGS
Keep in mind that best chart timeframe for this indicator to work is the 1-minute timeframe.
TP = Take-Profit
SL = Stop-Loss
EMA = Exponential Moving Average
OR = Opening Range
ATR = Average True Range
1. Algorithm
ORB Timeframe -> This setting determines the timeframe that the algorithm will analyze the market after a new session begins before giving any signals. It's important to experiment with this setting and find the best option that suits the current ticker for the best performance. More volatile stocks will often require this setting to be larger, while more stabilized stocks may have this setting shorter.
Sensitivity -> This setting determines how much failed retests are needed to take a position entry. Higher senstivity means that less retests are needed to consider the breakout as reliable. If you think that the current ticker makes strong movements in a bullish & bearish direction after a breakout, you should set this setting higher. If you think the opposite, meaning that the ticker does not decide the trend right after a breakout, this setting show be lower.
(High = 0 Retests, Medium = 1 Retest, Low = 2 Retests, Lowest = 3 Retests)
Breakout Condition -> The condition for the algorithm to detect breakouts.
Close = Bar needs to close higher than the OR High Line in a bullish breakout, or lower than the OR Low Line in a bearish breakout. EMA = The EMA of the bar must be higher / lower than OR Lines instead of the close price.
TP Method -> The method for the algorithm to use when determining TP zones.
Dynamic = This TP method essentially tries to find the bar that price starts declining the current trend and going to the other direction, and puts a TP zone there. To achieve this, it uses an EMA line, and when the close price of a bar crosses the EMA line, It's a TP spot.
ATR = In this TP method, instead of a dynamic approach the TP zones are pre-determined using the ATR of the entry bar. This option is generally for traders who just want to know their TP spots beforehand while trading. Selecting this option will also show TP zones at the ORB Dashboard.
"Dynamic" option generally performs better, while the "ATR" method is safer to use.
EMA Length -> This setting determines the length of the EMA line used in "Dynamic TP method" and "EMA Breakout Condition". This is completely up to the trader's choice, though the default option should generally perform well. You might want to experiment with this setting and find the optimal length for the current ticker.
Stop-Loss -> Algorithm will place the Stop-Loss zone using setting.
Safer = The SL zone will be placed closer to the OR High for a bullish entry, and closer to the OR Low for a bearish entry.
Balanced = The SL zone will be placed in the center of OR High & OR Low
Risky = The SL zone will be placed closer to the OR Low for a bullish entry, and closer to the OR High for a bearish entry.
Adaptive SL -> This option only takes effect if the first TP zone is hit.
Enabled = After the 1st TP zone is hit, the SL zone will be moved to the entry price, essentially making the position risk-free.
Disabled = The SL zone will never change.
2. ORB Dashboard
ORB Dashboard shows the information about the current session.
3. ORB Backtesting
ORB Backtesting Dashboard allows you to see past performance of the algorithm in the current ticker with current settings.
Total amount of days that can be backtested depends on your TV subscription.
Backtesting Exit Ratios -> You can select how much of percent your entry will be closed at any TP zone while backtesting. For example, %90, %5, %5 means that %90 of the position will be closed at the first TP zone, %5 of it will be closed at the 2nd TP zone, and %5 of it will be closed at the last TP zone.
Fair Value Gap Finder with Integrated Gann BoxTitle: Fair Value Gap Finder with Integrated Gann Box Analysis
Description:
The "Fair Value Gap Finder with Integrated Gann Box Analysis" is a unique technical indicator designed for traders who wish to incorporate the concepts of Fair Value Gaps (FVG) and Gann Box methodologies into their trading strategy. This tool is beneficial for both trend-following and scalping techniques across various markets and timeframes.
Functionality:
The indicator identifies Fair Value Gaps, which are areas on the chart where price has skipped a range, creating a 'gap'. Recognizing these zones can be crucial for understanding potential price support and resistance areas. Alongside FVG detection, this script employs Gann Box principles to project potential levels of interest. Gann Boxes are drawn automatically when an FVG is identified, providing additional insights based on W.D. Gann's theories, which relate to time and price symmetry.
Usage:
Upon detecting an FVG, the indicator will highlight the gap on the chart and overlay a Gann Box between the high and low points of the gap. Traders can use these zones to make informed decisions about entry and exit points, stop loss, and take profit levels. The script offers customization options for the appearance and behavior of the FVG boxes and Gann Lines, allowing users to adapt the tool to their preferences.
Originality:
What sets this indicator apart is the integration of FVG with Gann Box levels within a single tool, streamlining the analysis process. It takes the classic approach of identifying gaps and enriches it with the geometric significance of Gann's work, all while allowing users to visualize and interact with these levels in a user-friendly manner.
Open-Source Nature:
This script is open-source, making it a transparent solution for those who wish to understand the underlying calculations. While not all traders are versed in Pine Script, the logic of identifying FVGs and applying Gann Box levels is explained through the script's annotations and the user interface itself.
Instructions for Use:
Apply the script to your chart, and it will automatically detect FVGs.
Adjust the settings in the indicator's input menu to match your trading style and preferences.
Use the FVG and Gann Box levels as potential areas of interest for trade setups.
This script does not guarantee profits and should be used as part of a comprehensive trading plan. It is best used in conjunction with other analysis methods to confirm signals and strategies.

BreakoutTrendFollowingINFO:
The "BreakoutTrendFollowing" indicator is a comprehensive trading system designed for trend-following in various market environments. It combines multiple technical indicators, including Moving Averages (MA), MACD, and RSI,
along with volume analysis and breakout detection from consolidation, to identify potential entry points in trending markets. This strategy is particularly effective for assets that exhibit strong trends and significant price movements.
Note that using the consolidation filter reduces the amount of entries the strategy detects significantly, and needs to be used if we want to have an increased confidence in the trend via breakout.
However, the strategy can be easily transformed to various only trend-following strategies, by applying different filters and configurations.
The indicator can be used to connect to the Signal input of the TTS (TempalteTradingStrategy) by jason5480 in order to backtest it, thus effectively turning it into a strategy (instructions below in TTS CONNECTIVITY section)
DETAILS:
The strategy's core is built upon several key components:
Moving Average (MA): Used to determine the general trend direction. The strategy checks if the price is above the selected MA type and length.
MACD Filter: Analyzes the relationship between two moving averages to confirm the trend's momentum.
Consolidation Detection: Identifies periods of price consolidation and triggers trades on breakouts from these ranges.
Volume Analysis: Assesses trading volume to confirm the strength and validity of the breakout.
RSI: Used to avoid overbought conditions, ensuring trades are entered in favorable market situations.
Wick filters: make sure there is not a long wick that indicates selling pressure from above
The strategy generates buy signals when several conditions are met concurrently (each one of them can be individually enabled/disabled)"
The price is above the selected MA.
A breakout occurs from a configurable consolidation range.
The MACD line is above the signal line, indicating bullish momentum.
The RSI is below the overbought threshold.
There's an increase in trading volume, confirming the breakout's strength.
Currently the strategy fires SL signals, as the approach is to check for loss of momentum - i.e. crossunder of the MACD line and signal line, but that is to everyone to determine the exit conditions.
The buy and SL signals are set on the chart using green or orange triangles on the below/above the price action.
SETTINGS:
Users can customize various parameters, including MA type and period, MACD settings, consolidation length, and volume increase percentage. The strategy is equipped with alert conditions for both entry (buy signals) and exit (set stop loss) points, facilitating both manual and automated trading.
Each one of the technical indicators, as well as the consilidation range and breakout/wick settings can be configured and enabled/disabled individually.
Please thoroughly review the available settings of the script, but here is an outline of the most important ones:
Use bar wicks (instead of open/close) - the ref_high/low will be taken based on the bar wicks, rather than the open/close when determining the breakout and MA
Enter position only on green candles - additional filters to make sure that we enter only on strong momentum
MA Filter: (enable, source, type, length) - general settings for MA filter to be checked against the stock price (close or upper wick)
MACD Filter: (enable, source, Osc MA type, Signal MA type, Fast MA length, Slow MA length, Low MACD Hist) - detailed settings for fine MACD tuning
Consolidation:
Consolidation Type: we have two different ways of detecting the consolidation, note the types below.
CONSOLIDATION_BASIC - consolidation areas by looking for the pivot point of a trend and counts the number of bars that have not broken the consolidation high/low levels.
CONSOLIDATIO_RANGE_PERCENT - identifies consolidation by comparing the range between the highest and lowest price points over a specified period.
So in summary the CONSOLIDATIO_RANGE_PERCENT uses a percentage-based range to define consolidation, while CONSOLIDATION_BASIC uses a count of bars within a high-low range to establish consolidation.
Thus the former is more focused on the tightness of the price range, whereas the latter emphasizes the duration of the consolidation phase.
The CONSOLIDATIO_RANGE_PERCENT might be more sensitive to recent price movements and suitable for shorter-term analysis, while CONSOLIDATION_BASIC could be better for identifying longer-term consolidation patterns.
Min consolidation length - applicable for CONSOLIDATION_BASIC case, the min number of bars for the price to be in the range to consider consolidation
Consolidation Loopback period - applicable for CONSOLIDATION_BASIC case, the loopback number of bars to look for consolidation
Consolidation Range percent - applicable for CONSOLIDATIO_RANGE_PERCENT, the percent between the high and low in the range to consider consolidation
Plot consolidation - enables plotting of the consolidation (only for debug purposes)
Breakout: (enable, low, high) - the definition of the breakout from the previous consolidation range, the price should be between to determine the breakout as successfull
Upper wick: (enable, percent) - defines the percent of the upper wick compared to the whole candle to allow breakout (if the wick is too big part of the candle we can consider entering the position riskier)
RSI: (enable, length, overbought) - general settings for RSI TA
Volume (enbale, percentage increase, average volume filter en, loopback bars) - percentage of increase of the volume to consider for a breakout. There are two modes - percentage increase compared to the previous bar, or percentage against the average volume for the last loopback bars.
Note that there are many different configuration that you can play with, and I believe this is the strength of the strategy, as it can provide a single solution for different cases and scenarios.
My advice is to try and play with the different options for different markets based on the approach you want to implement and try turning features on/off and tuning them further.
TTS SETTINGS (NEEDED IF USED TO BACKTEST WITH TTS):
The TempalteTradingStrategy is a strategy script developed in Pine by jason5480, which I recommend for quick turn-around of testing different ideas on a proven and tested framework
I cannot give enough credit to the developer for the efforts put in building of the infrastructure, so I advice everyone that wants to use it first to get familiar with the concept and by checking
by checking jason5480's profile www.tradingview.com
The TTS itself is extremely functional and have a lot of properties, so its functionality is beyond the scope of the current script -
Again, I strongly recommend to be thoroughly explored by everyone that plans on using it.
In the nutshell it is a script that can be feed with buy/sell signals from an external indicator script and based on many configuration options it can determine how to execute the trades.
The TTS has many settings that can be applied, so below I will cover only the ones that differ from the default ones, at least according to my testing - do your own research, you may find something even better :)
The current/latest version that I've been using as of writing and testing this script is TTSv48
Settings which differ from the default ones:
Deal Conditions Mode - External (take enter/exit conditions from an external script)
🔌Signal 🛈➡ - BreakoutTrendFollowing: 🔌Signal to TTS (this is the output from the indicator script, according to the TTS convention)
Order Type - STOP (perform stop order)
Distance Method - HHLL (HigherHighLowerLow - in order to set the SL according to the strategy definition from above)
The next are just personal preferences, you can feel free to experiment according to your trading style
Take Profit Targets - 0 (either 100% in or out, no incremental stepping in or out of positions)
Dist Mul|Len Long/Short- 10 (make sure that we don't close on profitable trades by any reason)
Quantity Method - EQUITY (personal backtesting preference is to consider each backtest as a separate portfolio, so determine the position size by 100% of the allocated equity size)
Equity % - 100 (note above)

TrailingTakeProfit exampleQuite recently I came upon a concept of Trailing Take Profit and I couldn't find a PineScript which implements it for the fastest possible execution, so here it is :)
Everybody knows Trailing StopLoss - an invisible mechanism follows the price and exits the trade once the price retreats too much from its recent most extended favourable value. Trailing TakeProfit does the similar thing, but at the opposite end - the trade gets closed if a price moves too well, in too favourable extent.
Why close the trade if it is going so good? Well, whatever goes up, must go down and vice versa. It is expected, that after fast rally a market will soon fall and after a dump it will go up. So Trailing TakeProfit's role is to secure profits.
But how does Trailing TakeProfit differ from the standard one? "Trailing" means, the exit level is moving. Its role is to be executed only after a rapid favourable move within 1-2 candles, not more. We never know when a rapid move happens, but when it does, we wanna catch those pips and quickly exit without looking back.
Visually Trailing TakeProfit levels are... bands. In this script example these are ATR multiplied bands (aka Keltner Channel), but they could also be Bollinger Bands or something else.
The code is simple just to focus on this single functionality, so you can quickly copy-paste it into your script. Entries are triggered by default SMA crosses.
P.S. I wouldn't be myself, if I didn't add alert messages compatible with the syntax of recently revamped TradingConnector - both in the code already and in the table showing them.

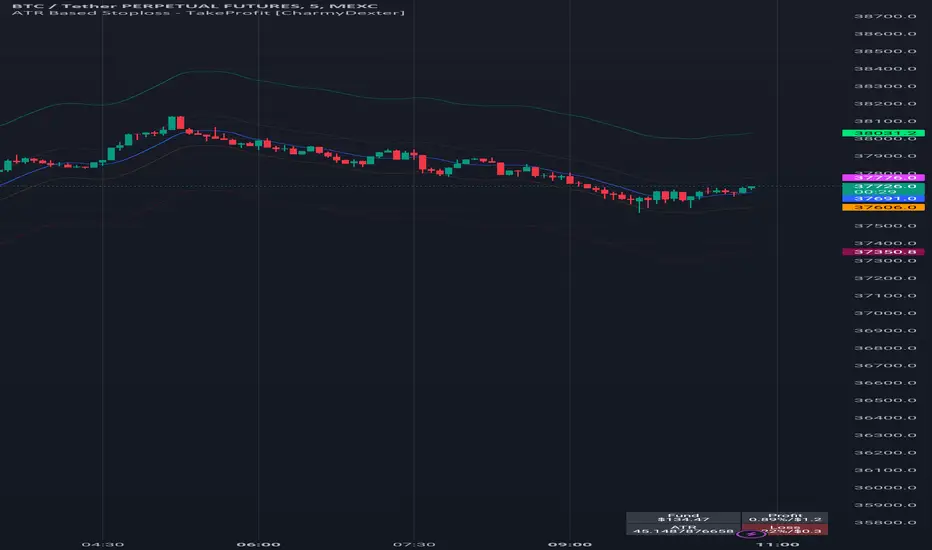
ATR Based Stoploss - TakeProfit [CharmyDexter]
This script combines the power of Average True Range (ATR) and a Moving Average (MA) to dynamically set stop-loss and take-profit levels. It introduces a volatility surge condition and includes a risk management table for comprehensive trade insights.
1) **Originality:**
- This script is original in its approach to combining Average True Range (ATR) with a Moving Average (MA) to create a dynamic stop-loss and take-profit strategy. The addition of a volatility surge condition and the inclusion of a risk management table further contribute to its uniqueness.
2) **Functionality:**
- The script aims to provide traders with a dynamic stop-loss and take-profit strategy based on ATR, incorporating a volatility surge condition and a moving average. The risk management table displays crucial information, including the fund size, potential profit/loss, ATR values, and risk.
3) **Operation:**
- The script uses ATR to calculate volatility, identifying surges in volatility. It adjusts the stop-loss and take-profit levels based on the average of ATR during these surge periods. The moving average acts as a trend indicator, and the script dynamically adjusts stop-loss and take-profit levels accordingly.
4) **Usage:**
- Traders can use this script by applying it to their preferred financial instrument's chart. The script automatically plots the moving average and dynamically adjusts stop-loss and take-profit levels based on ATR and volatility surges. Users can observe the levels on the chart for potential trade management.
5) **Concepts:**
- The script employs concepts of ATR for volatility, moving average for trend identification, and a dynamic adjustment mechanism during volatility surges. Risk management is incorporated by calculating potential profit/loss percentages based on user-defined risk.
6) **Mashup Explanation:**
- The script combines ATR, moving average, and volatility conditions to create a comprehensive strategy. ATR determines the market's volatility, the moving average serves as a trend indicator, and volatility surges trigger dynamic adjustments to stop-loss and take-profit levels. The risk management table enhances the script's utility.
7) **Line Descriptions:**
- Blue Line (Moving Average): Indicates the trend direction.
- Lime Line (Long Take Profit): Represents the level for taking profit in a long position.
- Maroon Line (Short Take Profit): Represents the level for taking profit in a short position.
- Fuchsia Line (Short Stop Loss): Represents the level for setting a stop loss in a short position.
- Orange Line (Long Stop Loss): Represents the level for setting a stop loss in a long position.
8) **Line Usage:**
- Use the blue line for trend identification.
- When taking long positions, the close should be above the blue line.
- For long positions, the lime line is a potential take-profit level, and the orange line is a potential stop-loss level.
- For short positions, the maroon line is a potential take-profit level, and the fuchsia line is a potential stop-loss level.
- The risk management table provides insights into fund size, potential profit/loss, ATR values, and risk.
Note: The profit/loss calculations in this script may not be entirely accurate due to factors like market execution. Market execution may not always occur at the exact levels specified by the script due to slippage or delays in order processing. This can impact the realized profit or loss compared to the calculated levels.
It is crucial to note that this ATR Based Stop-loss - Take-Profit indicator is merely one tool among many that traders can employ to establish trading targets. Additional technical indicators are essential for taking trades and making informed decisions.
Commented-out sections for alerts and shape plotting are provided, allowing for visual and auditory notifications if desired.
It's crucial for traders to be aware of these factors and use the script as a tool within a broader trading strategy. Additionally, regular monitoring and adjustments based on real-time market conditions are recommended to enhance the accuracy of profit/loss assessments.
simple pull back TJlv26This is a very simple strategy for swing trade in stock indexes.
this strategy only trade long position, recommend to use this in day chart of sp500 or nas100.
SPX
NDX
Buy condition:
close price above long term SMA(default period 200),close price under short term SMA(default period 10), RSI is under 30(default period 3)
Sell condition:
1:if close price is above short period SMA and current close price is lower than low price of previous bar
2:hit the take profit target(default value 10%)
3:hit the stop loss target(default value 5%)
from author:
As you can see, it's a very simple logic. You only start trading when the price is above long-term moving average, so you can avoid risk by taking positions only in the uptrend. You also use stop-loss, so even in situations where there is a significant downturn, you can minimize losses.
However, it's important to note that this strategy performs well only in markets where long-term (approximately 10 years) upward movements are expected. It often yields disappointing results during prolonged bear markets. This is where each user's fundamental analysis comes into play, as there is no such thing as a perfect trading logic.
Another noteworthy point is that, as seen in the results of back testing, this strategy tends to underperform buy-and-hold in most cases. As mentioned earlier, it's a strategy focused on risk mitigation and starting trades at the most advantageous prices, so I believe that using leverage of 2-4 times can maximize profits. However, trading with leverage is highly risky, so it should be assessed based on each individual's risk tolerance.

MACD_RSI_trend_followingINFO:
This indicator can be used to build-up a strategy for trading of assets which are currently in trending phase.
My preference is to use it on slowly moving assets like GOLD and on higher timeframes, but practice may show that we find more usefull cases.
This script uses two indicators - MACD and RSI, as the timeframe that those are extracted for is configurable (defaults with the Chart TF, but can be any other selected by the user).
The strategy has the following simple idea - buy if any if the conditions below is true:
The selected TF MACD line crosses above the signal line and the TF RSI is above the user selected trigger value
The selected TF MACD line is above the signal line and the TF RSI crosses above the user selected trigger value
Once we're in position we wait for the selected TF MACD line to cross below the signal line, and then we set a SL at the low of that bar
DETAILS and USAGE:
In the current implementation I find two possible use cases for the indicator:
as a stand-alone indicator on the chart which can also fire alerts that can help to determine if we want to manually enter/exit trades based on them
can be used to connect to the Signal input of the TTS (TempalteTradingStrategy) by jason5480 in order to backtest it, thus effectively turning it into a strategy (instructions below in TTS CONNECTIVITY section)
In the example below we see a position opened at the bar after the buy indicator from the script has been triggered, and then later after the SL indicator from the script has been triggered a SL has been set on the lower wick of the closing candle, and the position eventually got closed once the price hit that level. Note that most of the drawing on the example snapshot below are from the TTS indicator following the buy/sell/SL conditions themseves:
Trading period can be selected from the indicator itself to limit to more interesting periods.
Arrow indications are drawn on the chart to indicate the trading conditions met in the script - green arrow for a buy signal indication and orange for LTF crossunder to indicate setting of SL.
SETTINGS:
Leaving all of the settings as in vanilla use case, as both the MACD and RSI indicator's settings follow the default ones for the stand-alone indicators themselves.
The start-end date is a time filter that can be extermely usefull when backtesting different time periods.
Pesonal preference is using the script on a D/W timeframe, while the indicator is configured to use Monthly chart.
The default value of the RSI filter is left to 50, which can be changed. I.e. if the RSI is above 50 we have a regime filter based on the MACD criteria.
EXTERNAL LIBRARIES:
The script uses a couple of external libraries:
HeWhoMustNotBeNamed/enhanced_ta/14 - collection of TA indicators
jason5480/tts_convention/3 - more details about the Template Trading Strategy below
I would like to highly appreciate and credit the work of both HeWhoMustNotBeNamed and jason5480 for providing them to the community.
TTS SETTINGS (NEEDED IF USED TO BACKTEST WITH TTS):
The TempalteTradingStrategy is a strategy script developed in Pine by jason5480, which I recommend for quick turn-around of testing different ideas on a proven and tested framework
I cannot give enough credit to the developer for the efforts put in building of the infrastructure, so I advice everyone that wants to use it first to get familiar with the concept and by checking
by checking jason5480's profile www.tradingview.com
The TTS itself is extremely functional and have a lot of properties, so its functionality is beyond the scope of the current script -
Again, I strongly recommend to be thoroughly epxlored by everyone that plans on using it.
In the nutshell it is a script that can be feed with buy/sell signals from an external indicator script and based on many configuration options it can determine how to execute the trades.
The TTS has many settings that can be applied, so below I will cover only the ones that differ from the default ones, at least according to my testing - do your own research, you may find something even better :)
The current/latest version that I've been using as of writing and testing this script is TTSv48
Settings which differ from the default ones:
from - False (time filter is from the indicator script itself)
Deal Conditions Mode - External (take enter/exit conditions from an external script)
🔌Signal 🛈➡ - MACD_RSI_trend_following: 🔌Signal to TTSv48 (this is the output from the indicator script, according to the TTS convention)
Sat/Sun - true (for crypto, in order to trade 24/7)
Order Type - STOP (perform stop order)
Distance Method - HHLL (HigherHighLowerLow - in order to set the SL according to the strategy definition from above)
The next are just personal preferenes, you can feel free to experiment according to your trading style
Take Profit Targets - 0 (either 100% in or out, no incremental stepping in or out of positions)
Dist Mul|Len Long/Short- 10 (make sure that we don't close on profitable trades by any reason)
Quantity Method - EQUITY (personal backtesting preference is to consider each backtest as a separate portfolio, so determine the position size by 100% of the allocated equity size)
Equity % - 100 (note above)

Dual_MACD_trendingINFO:
This indicator is useful for trending assets, as my preference is for low-frequency trading, thus using BTCUSD on 1D/1W chart
In the current implementation I find two possible use cases for the indicator:
- as a stand-alone indicator on the chart which can also fire alerts that can help to determine if we want to manually enter/exit trades based on the signals from it (1D/1W is good for non-automated trading)
- can be used to connect to the Signal input of the TTS (TempalteTradingStrategy) by jason5480 in order to backtest it, thus effectively turning it into a strategy (instructions below in TTS CONNECTIVITY section)
Trading period can be selected from the indicator itself to limit to more interesting periods.
Arrow indications are drawn on the chart to indicate the trading conditions met in the script - light green for HTF crossover, dark green for LTF crossover and orange for LTF crossunder.
Note that the indicator performs best in trending assets and markets, and it is advisable to use additional indicators to filter the trading conditions when market/asset is expected to move sideways.
DETAILS:
It uses a couple of MACD indicators - one from the current timeframe and one from a higher timeframe, as the crossover/crossunder cases of the MACD line and the signal line indicate the potential entry/exit points.
The strategy has the following flow:
- If the weekly MACD is positive (MACD line is over the signal line) we have a trading window.
- If we have a trading window, we buy when the daily macd line crosses AND closes above the signal line.
- If we are in a position, we await the daily MACD to cross AND close under the signal line, and only then place a stop loss under the wick of that closing candle.
The user can select both the higher (HTF) and lower (LTF) timeframes. Preferably the lower timeframe should be the one that the Chart is on for better visualization.
If one to decide to use the indicator as a strategy, it implements the following buy and sell criterias, which are feed to the TTS, but can be also manually managed via adding alerts from this indicator.
Since usually the LTF is preceeding the crossover compared to the HTF, then my interpretation of the strategy and flow that it follows is allowing two different ways to enter a trade:
- crossover (and bar close) of the macd over the signal line in the HIGH TIMEFRAME (no need to look at the LOWER TIMEFRMAE)
- crossover (and bar close) of the macd over the signal line in the LOW TIMEFRAME, as in this case we need to check also that the macd line is over the signal line for the HIGH TIMEFRAME as well (like a regime filter)
The exit of the trade is based on the lower timeframe MACD only, as we create a stop loss equal to the lower wick of the bar, once the macd line crosses below the signal line on that timeframe
SETTINGS:
All of the indicator's settings are for the vanilla/general case.
User can set all of the MACD parameters for both the higher and lower (current) timeframes, currently left to default of the MACD stand-alone indicator itself.
The start-end date is a time filter that can be extermely usefull when backtesting different time periods.
TTS SETTINGS (NEEDED IF USED TO BACKTEST WITH TTS)
The TempalteTradingStrategy is a strategy script developed in Pine by jason5480, which I recommend for quick turn-around of testing different ideas on a proven and tested framework
I cannot give enough credit to the developer for the efforts put in building of the infrastructure, so I advice everyone that wants to use it first to get familiar with the concept and by checking
by checking jason5480's profile www.tradingview.com
The TTS itself is extremely functional and have a lot of properties, so its functionality is beyond the scope of the current script -
Again, I strongly recommend to be thoroughly epxlored by everyone that plans on using it.
In the nutshell it is a script that can be feed with buy/sell signals from an external indicator script and based on many configuration options it can determine how to execute the trades.
The TTS has many settings that can be applied, so below I will cover only the ones that differ from the default ones, at least according to my testing - do your own research, you may find something even better :)
The current/latest version that I've been using as of writing and testing this script is TTSv48
Settings which differ from the default ones:
- from - False (time filter is from the indicator script itself)
- Deal Conditions Mode - External (take enter/exit conditions from an external script)
- 🔌Signal 🛈➡ - Dual_MACD: 🔌Signal to TTSv48 (this is the output from the indicator script, according to the TTS convention)
- Sat/Sun - true (for crypto, in order to trade 24/7)
- Order Type - STOP (perform stop order)
- Distance Method - HHLL (HigherHighLowerLow - in order to set the SL according to the strategy definition from above)
The next are just personal preferenes, you can feel free to experiment according to your trading style
- Take Profit Targets - 0 (either 100% in or out, no incremental stepping in or out of positions)
- Dist Mul|Len Long/Short- 10 (make sure that we don't close on profitable trades by any reason)
- Quantity Method - EQUITY (personal backtesting preference is to consider each backtest as a separate portfolio, so determine the position size by 100% of the allocated equity size)
- Equity % - 100 (note above)
EXAMPLES:
If used as a stand-alone indicator, the green arrows on the bottom will represent:
- light green - MACD line crossover signal line in the HTF
- darker green - MACD line crossover signal line in the LTF
- orange - MACD line crossunder signal line in the LTF
I recommend enabling the alerts from the script to cover those cases.
If used as an input to the TTS, we'll get more decorations on the chart from the TTS itself.
In the example below we open a trade on the next day of LTF crossover, then a few days later a crossunder in the LTF occurs, so we set a SL at the low of the wick of this day. Few days later the price doesn't recover and hits that SL, so the position is closed.

EUR/USD 45 MIN Strategy - FinexBOTThis strategy uses three indicators:
RSI (Relative Strength Index) - It indicates if a stock is potentially overbought or oversold.
CCI (Commodity Channel Index) - It measures the current price level relative to an average price level over a certain period of time.
Williams %R - It is a momentum indicator that shows whether a stock is at the high or low end of its trading range.
Long (Buy) Trades Open:
When all three indicators suggest that the stock is oversold (RSI is below 25, CCI is below -130, and Williams %R is below -85), the strategy will open a buy position, assuming there is no current open trade.
Short (Sell) Trades Open:
When all three indicators suggest the stock is overbought (RSI is above 75, CCI is above 130, and Williams %R is above -15), the strategy will open a sell position, assuming there is no current open trade.
SL (Stop Loss) and TP (Take Profit):
SL (Stop Loss) is 0.45%.
TP (Take Profit) is 1.2%.
The strategy automatically sets these exit points as a percentage of the entry price for both long and short positions to manage risks and secure profits. You can easily adopt these inputs according to your strategy. However, default settings are recommended.

Price - TP/SLPrices
With this library, you can easily manage prices such as stop loss, take profit, calculate differences, prices from a lower timeframe, and get the order size and commission from the strategy properties tab.
Note that the order size and commission only work with strategies!
Usage
Take Profit & Stop Loss
var bool open_trade = false
open_trade := strategy.position_size != 0
bars_since_opened = strategy.opentrades > 0 ? bar_index - strategy.opentrades.entry_bar_index(strategy.opentrades - 1) + 1 : 0
// ############################################################
// # TAKE PROFIT
// ############################################################
take_profit = input.string(title='Take Profit', defval='OFF', options= , group='TAKE PROFIT')
take_profit_percentage = input.float(title='Take Profit (% or X)', defval=0, minval=0, step=0.1, group='TAKE PROFIT')
take_profit_bars = input.int(title='Take Profit Bars', defval=0, minval=0, step=1, group='TAKE PROFIT')
take_profit_indication = input.string(title='Take Profit Plot', defval='OFF', options= , group='TAKE PROFIT')
take_profit_color = input.color(title='Take Profit Color', defval=#26A69A, group='TAKE PROFIT')
take_profit_price = math.round_to_mintick(strategy.position_avg_price)
take_profit_plot = plot(take_profit == 'ON' and take_profit_indication == 'ON' and open_trade and bars_since_opened >= take_profit_bars and take_profit_percentage > 0 and nz(take_profit_price) ? take_profit_price : na, color=take_profit_color, style=plot.style_linebr, linewidth=1, title='TP', offset=0)
// ############################################################
// # STOP LOSS
// ############################################################
stop_loss = input.string(title='Stop Loss', defval='OFF', options= , group='STOP LOSS')
stop_loss_percentage = input.float(title='Stop Loss (% or X)', defval=0, minval=0, step=0.1, group='STOP LOSS')
stop_loss_bars = input.int(title='Stop Loss Bars', defval=0, minval=0, step=1, group='STOP LOSS')
stop_loss_indication = input.string(title='Stop Loss Plot', defval='OFF', options= , group='STOP LOSS')
stop_loss_color = input.color(title='Stop Loss Color', defval=#FF5252, group='STOP LOSS')
stop_loss_price = math.round_to_mintick(strategy.position_avg_price)
stop_loss_plot = plot(stop_loss == 'ON' and stop_loss_indication == 'ON' and open_trade and bars_since_opened >= stop_loss_bars and stop_loss_percentage > 0 and nz(stop_loss_price) ? stop_loss_price : na, color=stop_loss_color, style=plot.style_linebr, linewidth=1, title='SL', offset=0)
// ############################################################
// # STRATEGY
// ############################################################
var limit_price = 0.0
var stop_price = 0.0
limit_price := take_profit == 'ON' ? price.take_profit_price(take_profit_price, take_profit_percentage, take_profit_bars, bars_since_opened) : na
stop_price := stop_loss == 'ON' ? price.stop_loss_price(stop_loss_price, stop_loss_percentage, stop_loss_bars, bars_since_opened) : na
strategy.exit(id='TP/SL', comment='TP/SL', from_entry='LONG', limit=limit_price, stop=stop_price)
Calculate difference between 2 prices:
price.difference(close, close )
Get last price from lower timeframe:
price.ltf(request.security_lower_tf(ticker, '1', close))
Get the order size from the properties tab:
price.order_size()
Get the commission from the properties tab.
price.commission()