TitanGrid L/S SuperEngineTitanGrid L/S SuperEngine
Experimental Trend-Aligned Grid Signal Engine for Long & Short Execution
🔹 Overview
TitanGrid is an advanced, real-time signal engine built around a tactical grid structure.
It manages Long and Short trades using trend-aligned entries, layered scaling, and partial exits.
Unlike traditional strategy() -based scripts, TitanGrid runs as an indicator() , but includes its own full internal simulation engine.
This allows it to track capital, equity, PnL, risk exposure, and trade performance bar-by-bar — effectively simulating a custom backtest, while remaining compatible with real-time alert-based execution systems.
The concept was born from the fusion of two prior systems:
Assassin’s Grid (grid-based execution and structure) + Super 8 (trend-filtering, smart capital logic), both developed under the AssassinsGrid framework.
🔹 Disclaimer
This is an experimental tool intended for research, testing, and educational use.
It does not provide guaranteed outcomes and should not be interpreted as financial advice.
Use with demo or simulated accounts before considering live deployment.
🔹 Execution Logic
Trend direction is filtered through a custom SuperTrend engine. Once confirmed:
• Long entries trigger on pullbacks, exiting progressively as price moves up
• Short entries trigger on rallies, exiting as price declines
Grid levels are spaced by configurable percentage width, and entries scale dynamically.
🔹 Stop Loss Mechanism
TitanGrid uses a dual-layer stop system:
• A static stop per entry, placed at a fixed percentage distance matching the grid width
• A trend reversal exit that closes the entire position if price crosses the SuperTrend in the opposite direction
Stops are triggered once per cycle, ensuring predictable and capital-aware behavior.
🔹 Key Features
• Dual-side grid logic (Long-only, Short-only, or Both)
• SuperTrend filtering to enforce directional bias
• Adjustable grid spacing, scaling, and sizing
• Static and dynamic stop-loss logic
• Partial exits and reset conditions
• Webhook-ready alerts (browser-based automation compatible)
• Internal simulation of equity, PnL, fees, and liquidation levels
• Real-time dashboard for full transparency
🔹 Best Use Cases
TitanGrid performs best in structured or mean-reverting environments.
It is especially well-suited to assets with the behavioral profile of ETH — reactive, trend-intraday, and prone to clean pullback formations.
While adaptable to multiple timeframes, it shows strongest performance on the 15-minute chart , offering a balance of signal frequency and directional clarity.
🔹 License
Published under the Mozilla Public License 2.0 .
You are free to study, adapt, and extend this script.
🔹 Panel Reference
The real-time dashboard displays performance metrics, capital state, and position behavior:
• Asset Type – Automatically detects the instrument class (e.g., Crypto, Stock, Forex) from symbol metadata
• Equity – Total simulated capital: realized PnL + floating PnL + remaining cash
• Available Cash – Capital not currently allocated to any position
• Used Margin – Capital locked in open trades, based on position size and leverage
• Net Profit – Realized gain/loss after commissions and fees
• Raw Net Profit – Gross result before trading costs
• Floating PnL – Unrealized profit or loss from active positions
• ROI – Return on initial capital, including realized and floating PnL. Leverage directly impacts this metric, amplifying both gains and losses relative to account size.
• Long/Short Size & Avg Price – Open position sizes and volume-weighted average entry prices
• Leverage & Liquidation – Simulated effective leverage and projected liquidation level
• Hold – Best-performing hold side (Long or Short) over the session
• Hold Efficiency – Performance efficiency during holding phases, relative to capital used
• Profit Factor – Ratio of gross profits to gross losses (realized)
• Payoff Ratio – Average profit per win / average loss per loss
• Win Rate – Percent of profitable closes (including partial exits)
• Expectancy – Net average result per closed trade
• Max Drawdown – Largest recorded drop in equity during the session
• Commission Paid – Simulated trading costs: maker, taker, funding
• Long / Short Trades – Count of entry signals per side
• Time Trading – Number of bars spent in active positions
• Volume / Month – Extrapolated 30-day trading volume estimate
• Min Capital – Lowest equity level recorded during the session
🔹 Reference Ranges by Strategy Type
Use the following metrics as reference depending on the trading style:
Grid / Mean Reversion
• Profit Factor: 1.2 – 2.0
• Payoff Ratio: 0.5 – 1.2
• Win Rate: 50% – 70% (based on partial exits)
• Expectancy: 0.05% – 0.25%
• Drawdown: Moderate to high
• Commission Impact: High
Trend-Following
• Profit Factor: 1.5 – 3.0
• Payoff Ratio: 1.5 – 3.5
• Win Rate: 30% – 50%
• Expectancy: 0.3% – 1.0%
• Drawdown: Low to moderate
Scalping / High-Frequency
• Profit Factor: 1.1 – 1.6
• Payoff Ratio: 0.3 – 0.8
• Win Rate: 80% – 95%
• Expectancy: 0.01% – 0.05%
• Volume / Month: Very high
Breakout Strategies
• Profit Factor: 1.4 – 2.2
• Payoff Ratio: 1.2 – 2.0
• Win Rate: 35% – 60%
• Expectancy: 0.2% – 0.6%
• Drawdown: Can be sharp after failed breakouts
🔹 Note on Performance Simulation
TitanGrid includes internal accounting of fees, slippage, and funding costs.
While its logic is designed for precision and capital efficiency, performance is naturally affected by exchange commissions.
In frictionless environments (e.g., zero-fee simulation), its high-frequency logic could — in theory — extract substantial micro-edges from the market.
However, real-world conditions introduce limits, and all results should be interpreted accordingly.
"supertrend" için komut dosyalarını ara

Trend Targets [AlgoAlpha]OVERVIEW
This script combines a smoothed trend-following model with dynamic price rejection logic and ATR-based target projection to give traders a complete visual framework for trading trend continuations. It overlays on price and automatically detects potential trend shifts, confirms rejections near dynamic support/resistance, and displays calculated stop-loss and take-profit levels to support structured risk-reward management. Unlike traditional indicators that only show trend direction or signal entries, this tool brings together a unique mix of signal validation, volatility-aware positioning, and layered profit-taking to guide decision-making with more context.
CONCEPTS
The core trend logic is built on a custom Supertrend that uses an ATR-based band structure with long smoothing chains—first through a WMA, then an EMA—allowing the trend line to respond to major shifts while ignoring noise. A key addition is the use of rejection logic: the script looks for consolidation candles that "hug" the smoothed trend line and counts how many consecutive bars reject from it. This behavior often precedes significant moves. A user-defined threshold filters out weak tests and highlights only meaningful rejections.
FEATURES
Trend Detection : Automatically identifies trend direction using a smoothed Supertrend (WMA + EMA), with shape markers on trend shifts and color-coded bars for clarity.
Rejection Signals : Detects price rejections at the trend line after a user-defined number of consolidation bars; plots ▲/▼ icons to highlight strong continuation setups.
Target Projection : On trend confirmation, plots entry, stop-loss (ATR-based), and three dynamic take-profit levels based on customizable multiples.
Dynamic Updates : All levels (entry, SL, TP1–TP3) auto-adjust based on volatility and are labeled in real time on the chart.
Customization : Users can tweak trend parameters, rejection confirmation count, SL/TP ratios, smoothing lengths, and appearance settings.
Alerts : Built-in alerts for trend changes, rejection events, and when TP1, TP2, or TP3 are reached.
Chart Overlay : Plots directly on price chart with minimal clutter and clearly labeled levels for easy trading.
USAGE
Start by tuning the Supertrend factor and ATR period to fit your asset and timeframe—higher values will catch bigger swings, lower values catch faster moves. The confirmation count should match how tightly you want to filter rejection behavior—higher values make signals rarer but stronger. When the trend shifts, the indicator colors the bars and line accordingly, and if enabled, plots the full entry-TP-SL structure. Rejection markers appear only after enough qualifying bars confirm price pressure at the trend line. This is especially useful for continuation plays where price retests the trend but fails to break it. All calculations are based on volatility (ATR), so targets naturally adjust with market conditions. Add alerts to get notified of important signals even when away from the chart.

MarktQuants Supertrend"MarktQuants Supertrend" is an indicator designed to help traders visualize market trends using a combination of moving averages and dynamic range calculations. It adapts to market conditions, providing insights into potential trend directions:
Trend Identification:
Utilizes a customizable moving average (MA Type) with options like SMA, EMA, SMMA, WMA, VWMA, TEMA, DEMA, LSMA, HMA, or ALMA to smooth price action.
Calculates a dynamic range based on the highest high over a specified period (Length), adjusted by multipliers (Multiplier Alpha and Multiplier Beta).
Signal Generation:
The indicator assesses price relative to both the moving average and the calculated range (Average Range or Lookback Alpha and Beta).
Scores are computed to determine if the price action suggests a long (bullish) or short (bearish) trend via crossover signals from these scores.
Visual Indicators:
Candlesticks: The color changes based on the trend direction; greenish for long conditions and purplish for short conditions, enhancing visual trend recognition.
Moving Average Line: Plotted in semi-transparent color matching the trend, with a bold line for clarity.
Range Indicator: A line representing the average range, filled with semi-transparent color to show potential support or resistance levels.
Customization:
Users can toggle between using the average range or specific lookback periods for trend signals via the Use Average Range option.
Adjustable parameters for the moving average and range calculations allow for fine-tuning to various market instruments or trading styles.
Inputs:
Range Settings:
Length: Defines the period for calculating the highest high.
Lookback Alpha & Lookback Beta: Different lookback periods for range calculation.
Multiplier Alpha & Multiplier Beta: Multipliers for adjusting the range.
Use Average Range: Switch to use average or specific range for signals.
Source: Pick the preferred source for the range calculations.
Moving Average Settings:
Type: Choice of moving average type.
Length: Length of the moving average.
Source: The price source for the moving average calculation (default is close price).
Alert Options:
MQ - Supertrend Long for Long trades (Buy) when the Long Condition is met.
MQ - Supertrend Short for Short trades (Sell) when the Short Condition is met.
Note: This indicator is best used alongside other analysis tools to confirm trends and signals. Always consider the broader market context.

Pivot Points + Day First Candle Breakout + VWAP + Supertrend This indicator amalgamates several key indicators to provide a comprehensive analysis for trading decisions, including SuperTrend, Pivot Points, VWAP, along with the Day First Candle Breakout strategy.
Key Features:
Day First Candle Breakout: Identifies potential breakout opportunities based on the first candle of the trading day. It utilizes the high and low of the initial trading range to determine entry points.
Timeframe Selection: Allows users to select the timeframe for analyzing the first candle (e.g., 5, 15, or 60 minutes).
Previous Day and Week High/Low: Displays the high and low of the previous day and week to provide additional context for trading decisions and assess the strength of the trend.
Trend Strength Analysis: Indicates whether the current price is above or below the previous day's high or low, signaling a stronger bullish or bearish trend respectively.
SuperTrend Indicator: Visualizes the trend direction and potential reversal points based on the SuperTrend indicator. It helps traders to stay aligned with the prevailing trend and avoid premature exits.
Pivot Points: Presents key support and resistance levels derived from Pivot Points, assisting traders in identifying potential reversal or breakout zones.
VWAP (Volume Weighted Average Price): Plots VWAP to provide insight into the average price traded over a given period, aiding in determining the fair value of the asset and potential buying/selling zones.
Trading Signals:
Buy Signal: Triggered when the price exceeds the high of the initial trading range after an upward price gap.
Sell Signal: Generated when the price falls below the low of the initial trading range after a downward price gap.
Caveats for Effective Trading:
Extended Trading Ranges: Adjusts support and resistance levels if the initial trading range extends beyond the defined timeframe.
Morning Noise Consideration: Exercises caution during volatile morning sessions to avoid false breakouts and whipsaws.
Pullbacks and Narrow Range Bars: Looks for opportunities during pullbacks or when the price forms narrow range bars to enter trades, reducing the risk of sudden reversals.

kyle algo v1
Integration of multiple technical indicators: The strategy mainly combines two technical indicators - Keltner Channels and Supertrend, to generate trading signals. It also calculates fifteen exponential moving averages (EMAs) for the high price with different periods ranging from 9 to 51.
Unique combination of indicators: The traditional Supertrend typically uses Average True Range (ATR) to calculate its upper and lower bands. In contrast, this script modifies the approach to use Keltner Channels instead.
Flexible sensitivity adjustment: This strategy provides a "sensitivity" input parameter for users to adjust, which controls the multiplier for the range in the Supertrend calculation. This can make the signals more or less sensitive to price changes, allowing users to tailor the strategy to their own risk tolerance and trading style.
EMA Energy Representation: The code offers a visualization of "EMA Energy", which color-codes the EMA lines based on whether the closing price is above or below the EMA line. This can provide an intuitive understanding of market trends.
Clear visual signals: The strategy generates clear "BUY" and "SELL" signals, represented as labels on the chart. This makes it easy to identify potential entry and exit points in the market.
Customizable: The script provides several user inputs, making it possible to fine-tune the strategy according to different market conditions and individual trading preferences.
EMA (Exponential Moving Average) Principle:
The EMA is a type of moving average that assigns more weight to the most recent data.
It responds more quickly to recent price changes and is used to capture short-term price trends.
Principle of Color Change :
In this trading strategy, the color of the EMA line changes based on whether the closing price is above or below the EMA. If the closing price is above the EMA, the EMA line turns green,
indicating an upward price trend. Conversely, if the closing price is below the EMA, the EMA line turns red,
indicating a downward price trend. These color changes help traders to more intuitively identify price trends
In short, our team provides a lot of practical space
That is your development space

Dodge Trend [MyTradingCoder]Introducing the "Dodge Trend" indicator, an innovative variant of the Supertrend indicator designed to help traders better avoid fakeouts and maintain positions in established trends.
Like the Supertrend, the Dodge Trend uses Average True Range (ATR) but incorporates a unique adaptive adjustment feature that differentiates it from its counterparts. While the conventional Supertrend rises with the trend and only descends when the price crosses it, the Dodge Trend is designed to 'dodge' potential fakeouts.
This 'dodging' mechanism works by allowing the Dodge Trend to fall slightly during pullbacks, reducing the risk of a premature exit due to a temporary price drop. The recovery rate after the pullback is quicker but is slightly lower than the rate at which a new Dodge Trend high would be established in an uptrend. This unique adjustment feature allows the Dodge Trend to chase price action in an exponential fashion, potentially enabling a quicker exit when the trend shifts.
Key Settings:
Length: Adjust how much price action is taken into consideration for the ATR average. Lower values yield higher responsiveness to recent price action.
Size: Determines the initial deviation of the Dodge Trend when it resets after every flip/break.
Source: Specifies the data point (close, high, open, low, hl2, etc.) used for the Dodge Trend.
Dodge Intensity: Adjusts the intensity of the pullback effect. Higher values result in more intense pullbacks. Range is limited between 0 and 99, with 95 as the recommended default.
Bullish Color Setting: Sets the color for the uptrend Dodge Trend.
Bearish Color Setting: Sets the color for the downtrend Dodge Trend.
Dodge Trend is a powerful tool for traders looking to ride trends and avoid unnecessary exits due to short-term price fluctuations. While it offers a unique feature that may potentially improve trading outcomes, it should be used in conjunction with other indicators and analysis methods for a comprehensive trading strategy. As with all tools, it does not guarantee profitable trades but aims to give traders more actionable and precise information to base their decisions on.
Experience trend-following in a more adaptive and efficient manner with the Dodge Trend indicator, a tool designed to help you 'dodge' false exits and stay in line with the overall trend.

CPR with MAs, Super Trend & VWAP by MackraniThis script will allow to add CPR with Standard Pivots and 4 Indicators.
Standard Pivot has 9 levels of support and 9 levels of resistance lines. It has CPR , 3 levels of Day-wise pivots , 3 levels of Weekly pivots and 3 Levels of Monthly Pivots .
In Addition to the CPR and Pivot , this script will allow user to Add 4 more Indicators - SMA , EMA , VWAP and SuperTrend as well.
All the Support and resistance levels can be enabled / disabled from settings. It will allow to select multiple combinations of support and resistance levels across 3 levels at any of the 3 time-frames individually and combined.
All 4 Indicators can be can be enabled / disabled from settings. This will allow the indicators to be plotted individually and combined along with any combination of CPR & Pivots .
These number of combinations will allow user to visualize the charts with desired indicators, pivot support & resistance levels on all or any of the 3 time frames.
For Ease of access, listed few points on how the script works..
- CPR and day-wise level 1 & 2 (S1 & R1) enabled by default and can be changed from settings
- Day-wise Level 2 & 3 (S2, R2, S3 & L3) can be enabled from settings
- Weekly 3 levels and Monthly 3 levels can be enabled from settings
- CPR & pivot levels colored in blue lines
- All support levels colored in Green
- All resistance levels Colored in Red
- Day-wise pivot , support & resistance are straight lines
- Weekly pivot , support & resistance are cross (+) lines
- Weekly pivot , support & resistance are circle (o) lines
- SMA , EMA , VWAP and SuperTrend Enabled by Default
- SMA Colored in Orange
- EMA Colored in Red
- EMA Colored in Teal
- SuperTrend Colored in standard Red & Green with triangle arrows
- Any combinations can be selected from settings-> Inputs & style

Super SSLSuper SSL Indicator.
SSL + SuperTrend signal filtering.
Signals are delivered by SSL, signals are then filtered out by SuperTrend, in the nnfx way of trading (C1 = SSL, C2 = ST).
SSL deliver signals. Supertrend filter them.
Included 1CR rule option : in the nnfx way, we allow C2 to agree 1 candle later.
Some configuration settings of this tool pass the VP's 5 benchmark (can't be used to pass the private group admission though).

CPR with SMA, EMA, VWAP & Super Trend by GuruprasadMeduriThis script will allow to add CPR with Standard Pivots and 4 Indicators.
Standard Pivot has 9 levels of support and 9 levels of resistance lines. It has CPR , 3 levels of Day-wise pivots , 3 levels of Weekly pivots and 3 Levels of Monthly Pivots .
In Addition to the CPR and Pivot, this script will allow user to Add 4 more Indicators - SMA, EMA, VWAP and SuperTrend as well.
All the Support and resistance levels can be enabled / disabled from settings. It will allow to select multiple combinations of support and resistance levels across 3 levels at any of the 3 time-frames individually and combined.
All 4 Indicators can be can be enabled / disabled from settings. This will allow the indicators to be plotted individually and combined along with any combination of CPR & Pivots.
These number of combinations will allow user to visualize the charts with desired indicators, pivot support & resistance levels on all or any of the 3 time frames.
For Ease of access, listed few points on how the script works..
- CPR and day-wise level 1 & 2 (S1 & R1) enabled by default and can be changed from settings
- Day-wise Level 2 & 3 (S2, R2, S3 & L3) can be enabled from settings
- Weekly 3 levels and Monthly 3 levels can be enabled from settings
- CPR & pivot levels colored in blue lines
- All support levels colored in Green
- All resistance levels Colored in Red
- Day-wise pivot , support & resistance are straight lines
- Weekly pivot , support & resistance are cross (+) lines
- Weekly pivot , support & resistance are circle (o) lines
- SMA, EMA, VWAP and SuperTrend Enabled by Default
- SMA Colored in Orange
- EMA Colored in Red
- EMA Colored in Teal
- SuperTrend Colored in standard Red & Green with triangle arrows
- Any combinations can be selected from settings-> Inputs & style

High Aggregate Supertrend [jwammo12]This script adds an aggregate input to Supertrend to provide a Supertrend that approximates a higher time frame, but updates on the current time frame and therefore is more responsive.
The aggregate input acts as a multiplier on the current time frame, so an aggregate of 4 on a 1h chart would approximate a supertrend with the same parameters on a 4h chart by aggregating the last 4 bars into one bar.

(5M) REG SuperTrend Pullback SystemThis indicator implements a rule-based SuperTrend pullback system
designed for short-term trend continuation.
Core features:
• Regression-based SuperTrend with flip detection
• Pullback + reclaim entry logic (non-repainting, bar-close confirmed)
• Regime filter (Trend vs Range suppression)
• Exhaustion detection to avoid late entries
• ADX + EMA bias alignment
• USDT Dominance risk filter (risk-on / risk-off)
• Clear BUY / SELL and Pullback AI-style entry labels
This is NOT a trading bot and does NOT place orders.
All signals are for analytical and educational purposes only.

Sebastine All in One Indicator Sebastine All in One Indicator
Introduction
Markets speak in many dialects.
Sometimes they whisper through volume, sometimes they shout via momentum, at times they breathe through volatility, and occasionally they leave footprints in OBV, PVT, RSI, or TSI.
Most traders respond by stacking indicator after indicator—until the chart resembles a tangled fishing net.
This indicator was built to untangle that net.
Instead of plotting multiple indicators simultaneously, this tool lets you focus on one dimension of market behavior at a time, while preserving structure through a Darvas-style box framework.
The box logic used here is inspired by Darvas-style structural bounding, applied to non-price data such as volume, momentum, and volatility.
🔍 What This Indicator Does
• Combines Volume, OBV, PVT, RSI, Momentum, Volatility, TSI, and Supertrend
• Displays only one selected data stream at a time, reducing noise
• Wraps the selected indicator inside a dynamic Darvas-style box
• Highlights:
o Breakouts & breakdowns
o Compression (energy build-up)
o Structural shifts
o Momentum inflections
o Mean-reversion zones
Think of it as one lens, many filters—you rotate the lens, not clutter the chart.
🧠 How to Use It (Practical Insight)
• Volume / OBV / PVT → Institutional intent & accumulation/distribution
• Momentum / RSI / TSI → Strength, exhaustion, and early reversals
• Volatility → Expansion after contraction (the market’s deep breath)
• Supertrend (as data source) → Trend structure without price bias
The Darvas-style box adds context:
• Narrow boxes = stored energy
• Box expansion = energy release
• Source touching box edges = reaction zones
• Zero-line crossings = regime shifts (where applicable)
• 🎯 Who Is This For?
• Traders who want clarity over clutter
• Discretionary traders who adapt tools to market phase
• System builders seeking structure with flexibility
• Anyone who believes less noise = more signal
📝 Points to Note (Important for Proper Interpretation)
1. Color Coding & Structure
• The upper box line (green) represents the upper structural boundary
• The lower box line (red) represents the lower structural boundary
• The white step-line represents the selected source indicator (e.g., PVT, RSI, Momentum)
2. Pane Scaling & Visibility (Very Important)
• This indicator is designed for use in the bottom pane
• Different sources have very different numerical ranges:
o RSI is bounded between 0 and 100
o PVT, OBV, and Volume can have large absolute values
• Users should manually drag and scale the indicator vertically for optimal visibility
• This is intentional and preserves the raw integrity of each data source rather than force-normalizing it
3. Histogram for Comparative Insight
• A histogram of the selected source is included for quick visual comparison
• Helps identify expansion, contraction, acceleration, and divergence, especially during compression phases inside the box
📌 Recommended Usage (Clarity Over Clutter)
Although multiple sources are available, it is strongly recommended to use one chart with one selected source at a time for best clarity and analytical depth.
For first-time users, PVT (Price Volume Trend) is an ideal starting point.
It blends price movement and volume flow into a single continuous narrative and often reveals institutional participation earlier than price alone. PVT works especially well within the Darvas-style box framework.
Once comfortable, users may switch to RSI, Momentum, Volatility, OBV, or other sources—but always one at a time. This preserves the philosophy of focused observation rather than indicator overload.
🌱 Philosophy Behind the Tool
This indicator rewards patience and observation.Give it space.
It will quietly show when the market is gathering energy—and when it is ready to move.
Markets don’t change indicators. We change how we listen.
This indicator doesn’t predict. It reveals.
Think of it not as a dashboard, but as a rotating telescope—you change lenses, not skies.

Trend Cloud with Buy/Sell Text [wjdtks255]Indicator Title: Trend Cloud with Buy/Sell Signal Pro
Short Description
A high-probability trend-following indicator based on Supertrend dynamics, enhanced with a Volume Filter to pinpoint explosive entries while minimizing false breakouts.
Detailed Description (Overview)
The Trend Cloud with Buy/Sell Text is designed for traders who prioritize clarity and momentum. It visualizes market trends through a "Trend Cloud" system and generates real-time BUY/SELL signals only when price action is backed by significant trading volume.
Key Technical Pillars
Dynamic Trend Cloud: Fills the area between the price and the Supertrend line, providing immediate visual feedback on trend strength and potential support/resistance zones.
Smart Volume Filter: A unique logic that compares current volume against a 20-period moving average. Labels only appear when a trend shift occurs with above-average volume, filtering out weak "fakeouts."
No-Repaint Labels: Signals are calculated and fixed at the close of the candle, ensuring that the BUY/SELL text remains permanent for reliable historical backtesting and live execution.
The Alpha Hunter Strategy (How to Trade)
1. Long Entry (Buy)
Condition: The cloud turns Aqua and a "BUY" label appears below the candle.
Confirmation: Ensure the price remains above the Aqua Trend Line.
Volume Check: The indicator automatically verifies if the volume is higher than the 20-period average before displaying the label.
Exit: Exit when a "SELL" signal appears or the price closes below the Aqua line.
2. Short Entry (Sell)
Condition: The cloud turns Red and a "SELL" label appears above the candle.
Confirmation: Price should stay below the Red Trend Line.
Exit: Exit when a "BUY" signal appears or the price closes above the Red line.
Input Parameters & Optimization
ATR Period (Default: 10): Determines the sensitivity to price volatility.
ATR Factor (Default: 3.0): Controls the distance of the trend line. Increase to 3.5 - 4.0 to reduce noise in choppy markets.
Volume Filter (Toggle): When enabled, only high-momentum signals are shown.
Recommended Usage
Best Timeframes: 15m, 1h, 4h.
Asset Classes: Highly effective for Crypto (BTC/ETH) and high-volume stocks.

Regression SuperTrend WAIT🔹 DESCRIPTION
Regression SuperTrend + WAIT Panel is a trend-filter and market regime indicator designed to help traders identify the dominant market direction and avoid low-quality trading conditions.
This script combines:
Regression-based SuperTrend to define the primary trend (UP / DOWN)
A WAIT panel to filter tradable conditions
ADX, RSI, and CCI values displayed in a compact panel for quick context
Buy / Sell labels on the chart do not represent entry signals.
They only indicate trend regime changes.
🔹 How to Use
1. Trend Direction
Green line (UP) → Focus on LONG setups only
Red line (DOWN) → Focus on SHORT setups only
2. WAIT Panel
WAIT(L) → Long bias environment, wait for proper entries
WAIT(S) → Short bias environment, wait for proper entries
Low ADX → Weak or ranging market, trading is not recommended
RSI and CCI values are shown for momentum context only.
🔹 Best Practice
This indicator is not a standalone trading system.
It is intended to be used as:
A higher-timeframe bias tool
A trend and regime filter for lower-timeframe strategies or oscillators
Example:
Regression UP + WAIT(L) → Only look for long setups on lower timeframes
🔹 Who Is This For?
Trend-based traders
ICT / market structure traders
Traders who want to clearly identify when NOT to trade
⚠️ Disclaimer
This script is for educational purposes only.
It is not financial advice.
All trading decisions and risk management are the user’s responsibility.

AlphaStrike: Zen ModeDescription:
1. The Philosophy: Reducing Cognitive Load Modern charts are often cluttered with dozens of noisy lines (Bollinger Bands, Moving Averages, Oscillators) that lead to "Analysis Paralysis." This script is designed with a "Zen" philosophy: P rocess the complexity in the background, but display only the decision.
This is not a simple indicator overlay. It is a Risk-Based Trading Engine that runs multiple validation checks (Momentum, Volatility, and Price Action) simultaneously but hides the underlying calculations to keep the chart clean. It focuses the trader's attention on the two things that matter most: Trend Direction and Position Sizing.
2. The "Invisible" Technical Engine The script operates on a Dual-State Logic system that adapts to market conditions. It uses standard indicators as filters, not just visuals.
A. Trend State (The Backbone) The script calculates a volatility-adjusted Trend Baseline (SuperTrend).
Green State: The market is in a markup phase. The script looks for continuation.
Red State: The market is in a markdown phase. The script looks for defense.
B. The "Confluence" Reversal Logic Instead of cluttering the screen with Bollinger Bands and RSI windows, the script performs these checks internally:
Condition 1 (Volatility): Is price extending beyond the 2.0 Standard Deviation (Bollinger Lower/Upper)?
Condition 2 (Momentum): Is RSI overextended (<35 or >65)?
Condition 3 (Price Action): Is there a specific Pin Bar candle pattern (Long wick rejection)?
Result: Only when all three conditions align does the script print a "Reversal Circle." This filters out weak signals that usually occur in strong trends.
3. The Risk Management Calculator (Key Feature) Most traders fail not because of bad entries, but because of inconsistent sizing. This script features a built-in Dynamic Position Sizing Dashboard located in the bottom right.
Adaptive Stop Loss:
In a Trend: The Stop Loss is automatically set to the Trend Line (SuperTrend).
In a Reversal: The script internally scans for the nearest Swing Low/High (using hidden Pivot calculations) and sets the Stop Loss there.
Position Sizing Math: The dashboard reads your Account Size and Risk % inputs. It instantly calculates the "Max Size" (contract/share amount) allowed for the current trade.
Formula: Position Size = (Account Value * Risk %) / Distance to Stop.
Benefit: This ensures you risk the exact same dollar amount on every trade, whether the stop loss is 1% away or 10% away.
4. How to Read the Signals
Triangles (Breakouts): These represent a shift in the dominant trend direction.
Green Triangle: Bullish Trend Start.
Red Triangle: Bearish Trend Start.
Circles (Mean Reversion): These are high-probability counter-trend plays.
Blue Circle: Buy Reversal (Oversold + Pinbar + Bollinger Support).
Orange Circle: Sell Reversal (Overbought + Pinbar + Bollinger Resistance).
5. Settings
Trend Settings: Adjust the ATR Period and Factor to change the sensitivity of the trend line.
Reversal Settings: Tweak the RSI and Bollinger thresholds to filter out more/less signals.
Risk Management: Input your total Account Size and desired Risk Per Trade (e.g., 1%) to calibrate the Dashboard.
Disclaimer This tool provides algorithmic analysis and risk calculations. It does not guarantee profits or provide financial advice. Always verify position sizes before executing.

4 EMA + VWAP + UT Bot + SuperTrend + Daily Pivot Checklist📌 Description
This indicator is a multi-indicator trend confirmation checklist designed to simplify decision-making by combining several widely used technical tools into one clean on-chart dashboard.
The goal of this script is clarity, not complexity — helping traders quickly see market bias, trend strength, and trade direction without switching between multiple indicators.
🔹 Indicators Included
EMA 10 / 20 / 50 / 200
VWAP
UT Bot (ATR-based trailing stop with BUY / SELL signals)
SuperTrend (correct trend color logic)
Daily Pivot Point (today only)
All conditions are displayed in a YES / NO + BUY / SELL checklist panel for fast confirmation.
🔹 How to Use
Follow UT Bot BUY / SELL as the primary direction
Use EMA 200 & SuperTrend for overall trend bias
VWAP and Daily Pivot act as intraday filters
Stronger setups occur when most checklist conditions align
This indicator works best when combined with proper risk management and price action.
👥 Credits / Author Note
This script was conceptualized, tested, and refined by the publisher based on real trading use cases.
The development, logic structuring, and UI optimization were done collaboratively with AI-assisted scripting support to ensure clean code, clarity, and non-repainting behavior.
Final responsibility for trading decisions always remains with the user.
⚠️ Disclaimer
This indicator is provided for educational and informational purposes only.
It does not guarantee profits and should not be considered financial advice.
Always trade responsibly.

MTF Trend Dashboard (PSAR, SuperTrend, 200EMA, 9/30 EMA)This script is a multi–timeframe trend dashboard designed to quickly show the market bias across several timeframes in one place.
It does not generate buy/sell signals – it is a visual decision tool to support your own strategy.
What it shows
For up to 5 selectable timeframes, the table displays:
Parabolic SAR – whether PSAR is below (bullish) or above (bearish) the candle.
Supertrend – whether the Supertrend line is below or above the price.
200 EMA status – whether price is trading above (bullish trend) or below (bearish trend) the 200 EMA.
9 / 30 EMA crossover – whether 9 EMA is above (bullish) or below (bearish) the 30 EMA.
Green cells represent bullish conditions, red cells represent bearish conditions.
How to use
Quickly check higher–timeframe trend alignment before entering trades.
Use it as a trend filter for scalping or intraday entries on lower timeframes.
Combine with your own price action / SMC / support–resistance rules for actual entries and exits.

Hello Crypto! Modern Combo Snapshot
Unified long/short analyzer blending EMA structure, SuperTrend, WaveTrend, QQE, and volume pressure.
Background shading flags “watch” and “ready” states; optional long/short modules let you focus on one side.
Alerts fire when every checklist item aligns, while the side-panel table summarizes trend, momentum, liquidity, and overall score in real time.
Indicator → Trend Analysis
Indicator → Momentum Oscillators
Indicator → Volume Indicators
Tags:
cryptocurrency, bitcoin, altcoins, trend-following, momentum, volume, ema, supertrend, intraday, swing-trading, alerts, checklist, trading-strategy, risk-management

MACD + Supertrend + DEMA StrategySTRATEGY 📊 STRATEGY LOGIC:
Long Entry: When ALL of these occur simultaneously:
MACD histogram crosses above 0
Supertrend is bullish (green)
Short DEMA > Long DEMA
Short Entry: When ALL of these occur simultaneously:
MACD histogram crosses below 0
Supertrend is bearish (red)
Short DEMA < Long DEMA
Exits: Based on your TP/SL percentages from entry price
This follows the same clean structure as your MACD strategy but adds the alignment concept and proper risk management!

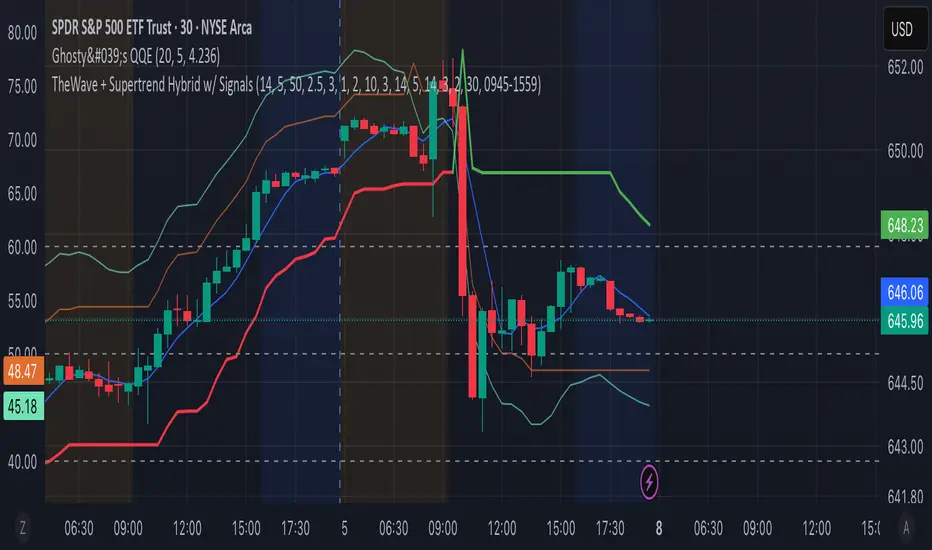
TheWave + Supertrend Hybrid w/ Signals• Green triangle below bar → Long entry signal
• Red triangle above bar → Short entry signal
• Small lime cross above/below → Take-profit hit
• Small maroon cross above/below → Stop-loss hit
• SMA5 and Supertrend lines for trend context
This version makes all entries and exits visually obvious while keeping the hybrid TheWave + Supertrend logic intact.
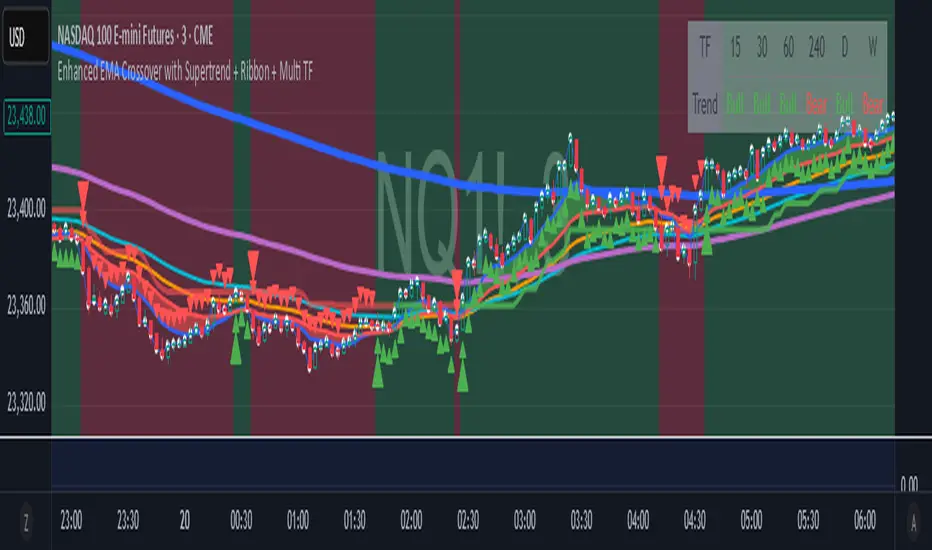
Enhanced EMA Crossover with Supertrend + Ribbon + Multi TFThe indicator has 4 core indicators in 1, the supertrend, the 2ema crossover, the moving average ribbon and a multi-timeframe trend indicator. I have modified the code for better visuals, all the indicators are fully customizable for better visuals and trend identification. Specially the 2 ema crossover indicator ribbon should guide you in the direction of the overall trend in different timeframes. The white dots were added to the real price close on everu candle , it is very usefull visually to see exactly where the price is closing specially when using heiken ashi candles. The small arrows on every candle should guide you in the direction of the overall trend when adjusting the 2 ema crossover lengths, the bigger arrow plots on the first candle only when the 2 ema crossover happens to either direction, using the supertrend indicator with the moving averages will also help you keep in the right trend direction.
Advanced Supertrend StrategyA comprehensive Pine Script v5 strategy featuring an enhanced Supertrend indicator with multiple technical filters, risk management, and advanced signal confirmation for automated trading on TradingView.
## Features
- **Enhanced Supertrend**: Configurable ATR-based trend following with improved accuracy
- **RSI Filter**: Optional RSI-based signal filtering to avoid overbought/oversold conditions
- **Moving Average Filter**: Trend confirmation using SMA/EMA/WMA with customizable periods
- **Risk Management**: Built-in stop-loss and take-profit based on ATR multiples
- **Trend Strength Analysis**: Filters weak signals by requiring minimum trend duration
- **Breakout Confirmation**: Optional price breakout validation for stronger signals
- **Visual Interface**: Comprehensive chart plotting with multiple indicator overlays
- **Advanced Alerts**: Multiple alert conditions with detailed signal information
- **Backtesting**: Full strategy backtesting with commission and realistic execution
