Stochastic BTC OptimizedEnhanced Stochastic for Bitcoin (BTC) – Optimized for Daily Timeframe
This enhanced Stochastic oscillator is specifically fine-tuned for BTC/USD on the 1D timeframe, leveraging historical data from Bitstamp (2011–2025) to minimize false signals and maximize reliability in Bitcoin's volatile swings.
Unlike the classic Stochastic (14, 3, 3), this version uses optimized parameters:
- K Period = 21 – smoother reaction, better suited for BTC’s macro cycles
- D Period = 3, Smooth K = 3 – reduces noise while preserving responsiveness
- Overbought = 85, Oversold = 15 – accounts for BTC’s tendency to trend strongly within extreme zones without immediate reversal
✅ Smart Signal Logic:
Buy/sell signals appear only when %K crosses %D inside the oversold (≤15) or overbought (≥85) zones, and only the first signal is shown to avoid whipsaws.
Visual Enhancements:
- Thick lines when %K/%D are in overbought/oversold zones
- Green/red background highlights on valid signals
- Optional up/down arrows for clear entry visualization
- Customizable colors, line widths, and transparency
🔒 No alerts included – clean, focused on price action and momentum.
💡 Pro Tip: For even higher accuracy, use this indicator in combination with a long-term trend filter (e.g., EMA 200). The oscillator excels in ranging or retracement phases but should not be used alone in strong parabolic moves.
Based on Mozilla Public License v2.0 – feel free to use, modify, and share. Perfect for swing traders and long-term Bitcoin analysts seeking high-probability reversal zones.
перевод на русский
Улучшенный Stochastic для Bitcoin (BTC) — оптимизирован для дневного таймфрейма
Этот улучшенный осциллятор Stochastic специально настроен под BTC/USD на дневном графике, с учётом исторических данных Bitstamp (2011–2025), чтобы минимизировать ложные сигналы и повысить надёжность в условиях высокой волатильности биткоина.
В отличие от классического Stochastic (14, 3, 3), эта версия использует оптимизированные параметры:
- Период K = 21 — более плавная реакция, лучше соответствует макроциклам BTC
- Период D = 3, Сглаживание K = 3 — снижает шум, сохраняя отзывчивость
- Уровень перекупленности = 85, перепроданности = 15 — учитывает склонность BTC к сильным трендам в экстремальных зонах без немедленного разворота
✅ Интеллектуальная логика сигналов:
Покупка/продажа отображается только при пересечении %K и %D внутри зоны перепроданности (≤15) или перекупленности (≥85), и только первый сигнал фиксируется, чтобы избежать «хлыстов».
Улучшенная визуализация:
- Жирные линии, когда %K/%D находятся в экстремальных зонах
- Зелёный/красный фон при появлении сигналов
- Опциональные стрелки для чёткого отображения точек входа
- Настройка цветов, толщины линий и прозрачности
🔒 Без алертов — чистый инструмент, сфокусированный на цене и импульсе.
💡 Совет профессионала: для ещё большей точности используйте этот индикатор вместе с трендовым фильтром (например, EMA 200). Осциллятор лучше всего работает в фазах консолидации или отката, но не стоит применять его в одиночку во время сильных параболических движений.
На основе Mozilla Public License v2.0 — свободно используйте, модифицируйте и делитесь. Идеален для свинг-трейдеров и аналитиков Bitcoin, ищущих зоны с высокой вероятностью разворота.
"stoch" için komut dosyalarını ara

Stoch Money Flow (ADMF) & Absolute Strength Index (ASI) [cI8DH]This indicator can apply my previous indicator, Historical and Standard Stochastic, to Money Flow (ADMF) or Absolute Strength Index (ASI) or both at the same time. It can also display those two indicators in regular mode as well as showing visual cues when the indicators make new ATH or ATL.
ASI is basically a new name I am giving to my Gain/Loss Moving Average indicator. If you normalize ASI with the moving average of all the changes in price, it becomes identical to RSI. So ASI is basically non-normalized RSI, that is why it should be a more accurate representation of price momentum.
ADMF is an accumulation/distribution and money flow momentum indicator. Both ASI and ADMF are not range-bound so it is not easy to compare them against each other. When stochastic equation is applied to them, they both become range-bound and comparable. The gaps between the two indicator can reveal valuable information about market dynamics. The chart below shows some examples (note the settings).
For conventional usages of stochastic, please read www.tradingview.com(STOCH) and www.tradingview.com(STOCH_RSI). I recommend you to find the optimal length by playing with the stoch length in the indicator settings. If this parameter is calibrated properly, this indicator can be a powerful tool for identifying market cycle.
You can get these features ( ATH , ATL detection and historical stochastic) for any other indicator using the script below:

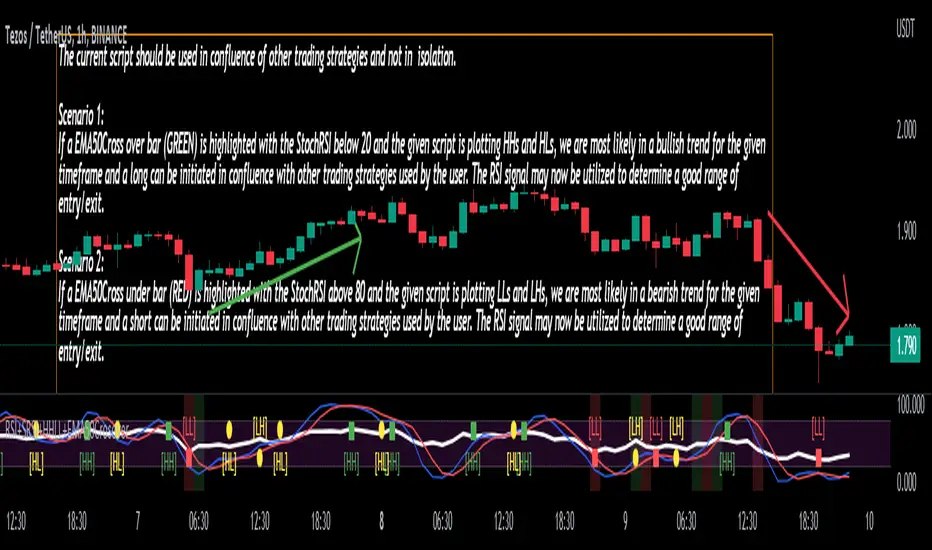
Stoch/RSI with EMA50 Cross & HHLLA hybrid but simple indicator that plots 4 strategies in one pane .
1) RSI Indicator
2) Stoch RSI
3) EMA50 Cross (To determine direction in current timeframe)
4) Higher Highs & Lower Lows to analyze the trend and break of trend
The relative strength index (RSI) is a momentum indicator used in technical analysis. It is displayed as an oscillator (a line graph) on a scale of zero to 100. When the RSI indicator crosses 30 on the RSI chart, it is a bullish sign and when it crosses 70, it is a bearish sign.
The Stochastic RSI (StochRSI) is also a momentum indicator used in technical analysis. It is displayed as an oscillator (a line graph) on a scale of zero to 100. When the StochRSI indicator crosses 20 on the RSI chart, it is a bullish sign and when it crosses 80, it is a bearish sign.
The EMA50Cross denotes two cases in the script:
a) A crossover of CMP on the EMA50 is highlighted by a green bar signals a possible bullish trend
b) A crossunder of CMP on the EMA50 is highlighted by a red bar signals a possible bearish trend
The HHLL is denoted by mneumonics HH, HL,LH, LL. A combination of HHs and HLs denotes a uptrend while the combination of LLs and LHs denoted a downtrend
The current script should be used in confluence of other trading strategies and not in isolation.
Scenario 1:
If a EMA50Cross over bar (GREEN) is highlighted with the StochRSI below 20 and the given script is plotting HHs and HLs, we are most likely in a bullish trend for the given timeframe and a long can be initiated in confluence with other trading strategies used by the user. The RSI signal may now be utilized to determine a good range of entry/exit.
Scenario 2:
If a EMA50Cross under bar (RED) is highlighted with the StochRSI above 80 and the given script is plotting LLs and LHs, we are most likely in a bearish trend for the given timeframe and a short can be initiated in confluence with other trading strategies used by the user. The RSI signal may now be utilized to determine a good range of entry/exit.
Disclaimer:
The current script should be used in confluence with other trading strategies and not in isolation. The scripts works best on 4H and 1D Timeframes and should be used with caution on lower timeframes.
This indicator is not intended to give exact entry or exit points for a trade but to provide a general idea of the trend & determine a good range for entering or exiting the trade. Please DYOR
Credit & References:
This script uses the default technical analysis reference library provided by PineScript (denoted as ta)
Lane's Stochastics (yasujiy)This script is original Lane's Stochastics.
Default script uses SMA for %D, but this %D is calculated separately numerator and denominator.

Super StochAdded signal functionality to StochRSI 2
Set Default Resolution of StochRSI 1 to "D" and StochRSI 2 to "240"
StochFusion – Multi D-LineStochFusion – Multi D-Line
An advanced fusion of four Stochastic %D lines into one powerful oscillator.
What it does:
Combines four user-weighted Stochastic %D lines—from fastest (9,3) to slowest (60,10)—into a single “Fusion” line that captures both short-term and long-term momentum in one view.
How to use:
Adjust the four weights (0–10) to emphasize the speed of each %D component.
Watch the Fusion line crossing key zones:
– Above 80 → overbought condition, potential short entry.
– Below 20 → oversold condition, potential long entry.
– Around 50 → neutral/midline, watch for trend shifts.
Applications:
Entry/exit filter: Only take trades when the Fusion line confirms zone exits.
Trend confirmation: Analyze slope and cross of the midline for momentum strength.
Multi-timeframe alignment: Use on different chart resolutions to find confluence.
Tips & Tricks:
Default weights give more influence to slower %D—good for trend-focused strategies.
Equal weights provide a balanced oscillator that mimics an ensemble average.
Experiment: Increase the fastest weight to capture early reversal signals.
Developed by: TradeQUO — inspired by DayTraderRadio John
“The best momentum indicator is the one you adapt to your own trading rhythm.”

Stochastic Fusion Elite [trade_lexx]📈 Stochastic Fusion Elite is your reliable trading assistant!
📊 What is Stochastic Fusion Elite ?
Stochastic Fusion Elite is a trading indicator based on a stochastic oscillator. It analyzes the rate of price change and generates buy or sell signals based on various technical analysis methods.
💡 The main components of the indicator
📊 Stochastic oscillator (K and D)
Stochastic shows the position of the current price relative to the price range for a certain period. Values above 80 indicate overbought (an early sale is possible), and values below 20 indicate oversold (an early purchase is possible).
📈 Moving Averages (MA)
The indicator uses 10 different types of moving averages to smooth stochastic lines.:
- SMA: Simple moving average
- EMA: Exponential moving average
- WMA: Weighted moving average
- HMA: Moving Average Scale
- KAMA: Kaufman Adaptive Moving Average
- VWMA: Volume-weighted moving average
- ALMA: Arnaud Legoux Moving Average
- TEMA: Triple exponential moving average
- ZLEMA: zero delay exponential moving average
- DEMA: Double exponential moving average
The choice of the type of moving average affects the speed of the indicator's response to market changes.
🎯 Bollinger Bands (BB)
Bands around the moving average that widen and narrow depending on volatility. They help determine when the stochastic is out of the normal range.
🔄 Divergences
Divergences show discrepancies between price and stochastic:
- Bullish divergence: price is falling and stochastic is rising — an upward reversal is possible
- Bearish divergence: the price is rising, and stochastic is falling — a downward reversal is possible
🔍 Indicator signals
1️⃣ KD signals (K and D stochastic lines)
- Buy signal:
- What happens: the %K line crosses the %D line from bottom to top
- What does it look like: a green triangle with the label "KD" under the chart and the label "Buy" below the bar
- What does this mean: the price is gaining an upward momentum, growth is possible
- Sell signal:
- What happens: the %K line crosses the %D line from top to bottom
- What it looks like: a red triangle with the label "KD" above the chart and the label "Sell" above the bar
- What does this mean: the price is losing its upward momentum, possibly falling
2️⃣ Moving Average Signals (MA)
- Buy Signal:
- What happens: stochastic crosses the moving average from bottom to top
- What it looks like: a green triangle with the label "MA" under the chart and the label "Buy" below the bar
- What does this mean: stochastic is starting to accelerate upward, price growth is possible
- Sell signal:
- What happens: stochastic crosses the moving average from top to bottom
- What it looks like: a red triangle with the label "MA" above the chart and the label "Sell" above the bar
- What does this mean: stochastic is starting to accelerate downwards, a price drop is possible
3️⃣ Bollinger Band Signals (BB)
- Buy signal:
- What happens: stochastic crosses the lower Bollinger band from bottom to top
- What it looks like: a green triangle with the label "BB" under the chart and the label "Buy" below the bar
- What does this mean: stochastic was too low and is now starting to recover
- Sell signal:
- What happens: Stochastic crosses the upper Bollinger band from top to bottom
- What it looks like: a red triangle with a "BB" label above the chart and a "Sell" label above the bar
- What does this mean: stochastic was too high and is now starting to decline
4️⃣ Divergence Signals (Div)
- Buy Signal (Bullish Divergence):
- What's happening: the price is falling, and stochastic is forming higher lows
- What it looks like: a green triangle with a "Div" label under the chart and a "Buy" label below the bar
- What does this mean: despite the falling price, the momentum is already changing in an upward direction
- Sell signal (bearish divergence):
- What's going on: the price is rising, and stochastic is forming lower highs
- What it looks like: a red triangle with a "Div" label above the chart and a "Sell" label above the bar
- What does this mean: despite the price increase, the momentum is already weakening
🛠️ Filters to filter out false signals
1️⃣ Minimum distance between the signals
- What it does: sets the minimum number of candles between signals
- Why it is needed: prevents signals from being too frequent during strong market fluctuations
- How to set it up: Set the number from 0 and above (default: 5)
2️⃣ "Waiting for the opposite signal" mode
- What it does: waits for a signal in the opposite direction before generating a new signal
- Why you need it: it helps you not to miss important trend reversals
- How to set up: just turn the function on or off
3️⃣ Filter by stochastic levels
- What it does: generates signals only when the stochastic is in the specified ranges
- Why it is needed: it helps to catch the moments when the market is oversold or overbought
- How to set up:
- For buy signals: set a range for oversold (for example, 1-20)
- For sell signals: set a range for overbought (for example, 80-100)
4️⃣ MFI filter
- What it does: additionally checks the values of the cash flow index (MFI)
- Why it is needed: confirms stochastic signals with cash flow data
- How to set it up:
- For buy signals: set the range for oversold MFI (for example, 1-25)
- For sell signals: set the range for overbought MFI (for example, 75-100)
5️⃣ The RSI filter
- What it does: additionally checks the RSI values to confirm the signals
- Why it is needed: adds additional confirmation from another popular indicator
- How to set up:
- For buy signals: set the range for oversold MFI (for example, 1-30)
- For sell signals: set the range for overbought MFI (for example, 70-100)
🔄 Signal combination modes
1️⃣ Normal mode
- How it works: all signals (KD, MA, BB, Div) work independently of each other
- When to use it: for general market analysis or when learning how to work with the indicator
2️⃣ "AND" Mode ("AND Mode")
- How it works: the alarm appears only when several conditions are triggered simultaneously
- Combination options:
- KD+MA: signals from the KD and moving average lines
- KD+BB: signals from KD lines and Bollinger bands
- KD+Div: signals from the KD and divergence lines
- KD+MA+BB: three signals simultaneously
- KD+MA+Div: three signals at the same time
- KD+BB+Div: three signals at the same time
- KD+MA+BB+Div: all four signals at the same time
- When to use: for more reliable but rare signals
🔌 Connecting to trading strategies
The indicator can be connected to your trading strategies using 6 different channels.:
1. Connector KD signals: connects only the signals from the intersection of lines K and D
2. Connector MA signals: connects only signals from moving averages
3. Connector BB signal: connects only the signals from the Bollinger bands
4. Connector divergence signals: connects only divergence signals
5. Combined Connector: connects any signals
6. Connector for "And" mode: connects only combined signals
🔔 Setting up alerts
The indicator can send alerts when alarms appear.:
- Alerts for KD: when the %K line crosses the %D line
- Alerts for MA: when stochastic crosses the moving average
- Alerts for BB: when stochastic crosses the Bollinger bands
- Divergence alerts: when a divergence is detected
- Combined alerts: for all types of alarms
- Alerts for "And" mode: for combined signals
🎭 What does the indicator look like on the chart ?
- Main lines K and D: blue and orange lines
- Overbought/oversold levels: horizontal lines at levels 20 and 80
- Middle line: dotted line at level 50
- Stochastic Moving Average: yellow line
- Bollinger bands: green lines around the moving average
- Signals: green and red triangles with corresponding labels
📚 How to start using Stochastic Fusion Elite
1️⃣ Initial setup
- Add an indicator to your chart
- Select the types of signals you want to use (KD, MA, BB, Div)
- Adjust the period and smoothing for the K and D lines
2️⃣ Filter settings
- Set the distance between the signals to get rid of unnecessary noise
- Adjust stochastic, MFI and RSI levels depending on the volatility of your asset
- If you need more reliable signals, turn on the "Waiting for the opposite signal" mode.
3️⃣ Operation mode selection
- First, use the standard mode to see all possible signals.
- When you get comfortable, try the "And" mode for rarer signals.
4️⃣ Setting up Alerts
- Select the types of signals you want to be notified about
- Set up alerts for these types of signals
5️⃣ Verification and adaptation
- Check the operation of the indicator on historical data
- Adjust the parameters for a specific asset
- Adapt the settings to your trading style
🌟 Usage examples
For trend trading
- Use the KD and MA signals in the direction of the main trend
- Set the distance between the signals
- Set stricter levels for filters
For trading in a sideways range
- Use BB signals to detect bounces from the range boundaries
- Use a stochastic level filter to confirm overbought/oversold conditions
- Adjust the Bollinger bands according to the width of the range
To determine the pivot points
- Pay attention to the divergence signals
- Set the distance between the signals
- Check the MFI and RSI filters for additional confirmation

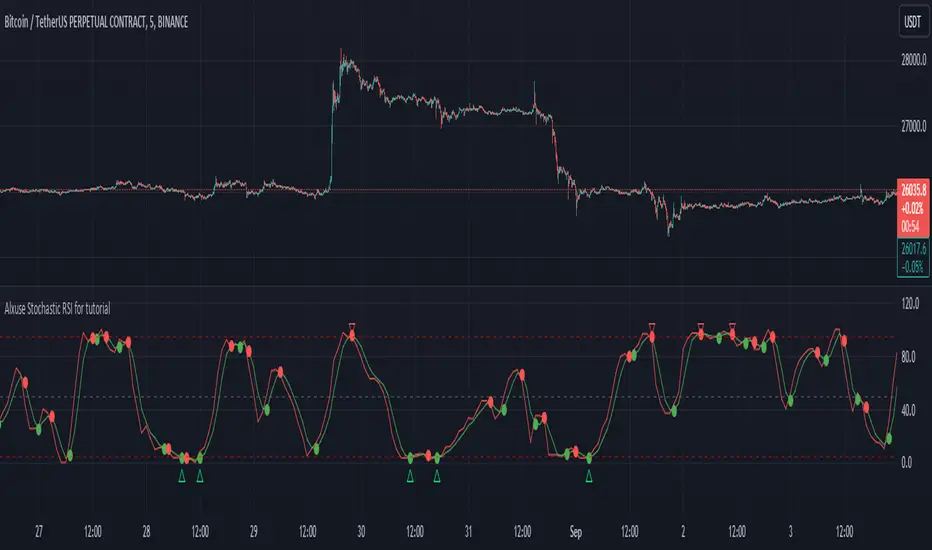
Alxuse Stochastic RSI for tutorial All abilities of Stochastic RSI, moreover :
Drawing upper band and lower band & the ability to change values, change colors, turn on/off show.
Crossing K line and D line in multi timeframe & there are symbols (Circles) with green color (Buy) and red color (Sell) & the ability to change colors, turn on/off show.
Crossing K line and D line in multi timeframe according to the values of upper band and lower band & there are symbols (Triangles) with green color (Long) and red color (Short) & the ability to change colors, turn on/off show.
The ability used in the alert section and create customized alerts.
To receive valid alerts the replay section , the timeframe of the chart must be the same as the timeframe of the indicator.
Stochastic RSI (STOCH RSI)
Definition
The Stochastic RSI indicator (Stoch RSI) is essentially an indicator of an indicator. It is used in technical analysis to provide a stochastic calculation to the RSI indicator. This means that it is a measure of RSI relative to its own high/low range over a user defined period of time. The Stochastic RSI is an oscillator that calculates a value between 0 and 1 which is then plotted as a line. This indicator is primarily used for identifying overbought and oversold conditions.
The basics
It is important to remember that the Stoch RSI is an indicator of an indicator making it two steps away from price. RSI is one step away from price and therefore a stochastic calculation of the RSI is two steps away. This is important because as with any indicator that is multiple steps away from price, Stoch RSI can have brief disconnects from actual price movement. That being said, as a range bound indicator, the Stoch RSI's primary function is identifying crossovers as well as overbought and oversold conditions.
Overbought/Oversold
Overbought and Oversold conditions are traditionally different than the RSI. While RSI overbought and oversold conditions are traditionally set at 70 for overbought and 30 for oversold, Stoch RSI are typically .80 and .20 respectively. When using the Stoch RSI, overbought and oversold work best when trading along with the underlying trend.
During an uptrend, look for oversold conditions for points of entry.
During a downtrend, look for overbought conditions for points of entry.
Summary
When using Stoch RSI in technical analysis, a trader should be careful. By adding the Stochastic calculation to RSI, speed is greatly increased. This can generate many more signals and therefore more bad signals as well as the good ones. Stoch RSI needs to be combined with additional tools or indicators in order to be at its most effective. Using trend lines or basic chart pattern analysis can help to identify major, underlying trends and increase the Stoch RSI's accuracy. Using Stoch RSI to make trades that go against the underlying trend is a dangerous proposition.
The added features to the indicator are made for training, it is advisable to use it with caution in tradings.
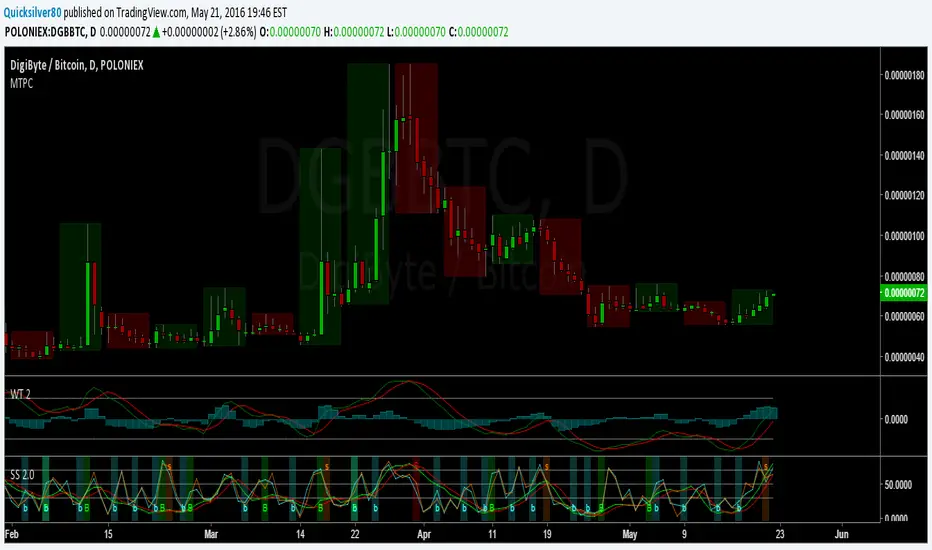
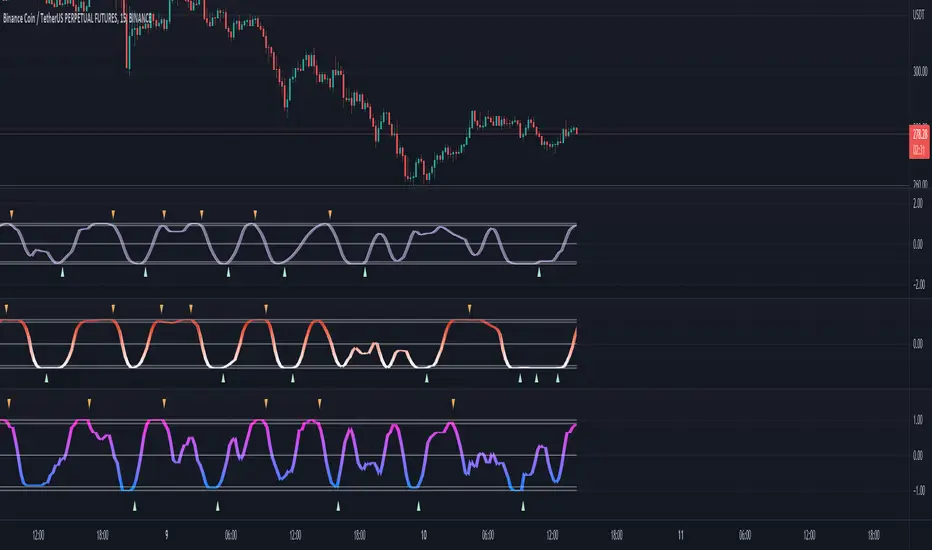
Stochastic Heat MapA series of 28 stochastic oscillators plotted horizontally and stacked vertically from bottom to top as the oscillator background.
Each oscillator has been interpreted and the value has been used to colour the lines in.
Lower lines are shorter term stochastics and higher lines are longer term stochastics.
The average of the 28 stochastics has been taken and then used to plot the fast oscillator line, which also has a slow oscillator line to follow.
The oscillator line can be used to colour in the candles.
Inputs:
MA: multiple smoothing methods
Theme: multiple colours
Increment: stochastic length start and increments
Smooth Fast: smooth fast length
Smooth Slow: smooth slow length
Paint Bars: colour candles
Waves: toggle method to weight/increment stochastics
Heat map shows momentum extremes:

Adaptive Stochastic Oscillator with Signals [AIBitcoinTrend]👽 Adaptive Stochastic Oscillator with Signals (AIBitcoinTrend)
The Adaptive Stochastic Oscillator with Signals is a refined version of the traditional Stochastic Oscillator, dynamically adjusting its lookback period based on market volatility. This adaptive approach improves responsiveness to market conditions, reducing lag while maintaining trend sensitivity. Additionally, the indicator includes real-time divergence detection and an ATR-based trailing stop system, allowing traders to manage risk and optimize trade exits effectively.
👽 What Makes the Adaptive Stochastic Oscillator Unique?
Unlike the standard Stochastic Oscillator, which uses a fixed lookback period, this version dynamically adjusts the period length using an ATR-based fractal dimension. This makes it more responsive to market conditions, filtering out noise while capturing key price movements.
Key Features:
Adaptive Lookback Calculation – Stochastic period changes dynamically based on volatility.
Real-Time Divergence Detection – Identify bullish and bearish divergences instantly.
Implement Crossover/Crossunder signals tied to ATR-based trailing stops for risk management
👽 The Math Behind the Indicator
👾 Adaptive Lookback Period Calculation
Traditional Stochastic Oscillators use a fixed-length period for their calculations, which can lead to inaccurate signals in varying market conditions. This version automatically adjusts its lookback period based on market volatility using an ATR-based fractal dimension approach.
How it Works:
The fractal dimension (FD) is calculated using the ATR (Average True Range) over a defined period.
FD values dynamically adjust the Stochastic lookback period between a minimum and maximum range.
This results in a faster response in high-volatility conditions and smoother signals during low volatility.
👽 How Traders Can Use This Indicator
👾 Divergence Trading Strategy
Traders can anticipate trend reversals before they occur using real-time divergence detection.
Bullish Divergence Setup:
Identify price making a lower low while Stochastic %K makes a higher low.
Enter a long trade when Stochastic confirms upward momentum.
Bearish Divergence Setup:
Identify price making a higher high while Stochastic %K makes a lower high.
Enter a short trade when Stochastic confirms downward momentum.
👾 Trailing Stop & Signal-Based Trading
Bullish Setup:
✅Stochastic %K crosses above 90 → Buy signal.
✅A bullish trailing stop is placed at low - ATR × Multiplier.
✅Exit if the price crosses below the stop.
Bearish Setup:
✅Stochastic %K crosses below 10 → Sell signal.
✅A bearish trailing stop is placed at high + ATR × Multiplier.
✅Exit if the price crosses above the stop.
👽 Why It’s Useful for Traders
Adaptive Period Calculation: Dynamically adjusts to market volatility.
Real-Time Divergence Alerts: Helps traders identify trend reversals in advance.
ATR-Based Risk Management: Automatically adjusts stop levels based on price movements.
Works Across Multiple Markets & Timeframes: Useful for stocks, forex, crypto, and futures trading.
👽 Indicator Settings
Min & Max Lookback Periods – Define the range for the adaptive Stochastic period.
Enable Divergence Analysis – Toggle real-time divergence detection.
Lookback Period – Set the number of bars for detecting pivot points.
Enable Trailing Stop – Activate the dynamic trailing stop feature.
ATR Multiplier – Adjust stop-loss sensitivity.
Line Width & Colors – Customize stop-loss visualization.
Disclaimer: This indicator is designed for educational purposes and does not constitute financial advice. Please consult a qualified financial advisor before making investment decisions.

StochRSI x RSI x CCI x EMAsWanted to put this out there. Kind of a rough explanation but basically I wanted to build an indicator that takes out emotions and is easy to read. The indicator is basically RSI, stochRSI, CCI, and EMAs into an easy to read package. The traffic lights at the end will tell you if stochRSI/RSI and price action above according to EMA ribbon are in agreement. RSI with a period of 2 also always seemed very useful to me but it was just extremely distracting to look at it. I tried to make many rules in this indicator to find as much confluence between RSI, stochRSI, CCI, and EMAs to help you make better decisions. What is shown on the indicator is not necessarily a buy/sell signal. It should be seen as a way to view strength of price and possible momentum changes.
I find that one of the biggest distractions of indicators is taking your eyes off what is really happening at the chart above. This indicator uses popular and well used tools and helps you to get an easier visual of what is happening.
Purple lines at top and bottom: Short RSI ob/os
Red/orange and blue/green lines at top and bottom: When stochRSI kd and CCI also crosses +/- 100 or 200
Blue background: when stochRSI k > d and short RSI crosses above 30
Red background: when stochRSI k < d and short RSI crosses below 70
Green crosses: StochRSI is above 80 and making higher highs
Red X crosses: StochRSI is below 20 and making lower lows
Red/green fill of stochRSI and purple/blue dots on RSI: When short RSI and stochRSI are both ob/os
Red/green fill of RSI: Green when Long rsi > 50, red when Long rsi < 50
60/40 lines: Possible support/resistance for RSI
Traffic lights
1st light: Long RSI > EMA and stoch RSI k>d or vice versa
2nd light: Price above EMA 1 and 2 or vice versa
3rd light: when lights 1 and 2 are in agreement
Hope you enjoy!

Super StochSuper Stoch Update
// Short Name Changed To "SS 3.0"
// Added a third StochRSI.
// Default resolutions S1= W, S2= D, S3= 240 (4H)
// Signal function for all StochRSI's.
// Made a Variety of Cosmetic Changes

Stochastic SuperTrend [BigBeluga]🔵 OVERVIEW
A hybrid momentum-trend tool that combines Stochastic RSI with SuperTrend logic to deliver clean directional signals based on momentum turns.
Stochastic SuperTrend is a straightforward yet powerful oscillator overlay designed to highlight turning points in momentum with high clarity. It overlays a SuperTrend-style envelope onto the Stochastic RSI, generating intuitive up/down signals when a momentum shift occurs across the neutral 50 level. Built for traders who appreciate simplicity without sacrificing reliability.
🔵 CONCEPTS
Stochastic RSI: Measures momentum by applying stochastic calculations to the RSI curve instead of raw price.
SuperTrend Bands: Dynamic upper/lower bands are drawn around the smoothed Stoch RSI line using a user-defined multiplier.
Momentum Direction: Trend flips when the smoothed Stoch RSI crosses above/below the calculated bands.
Neutral Bias Filter: Directional arrows only appear when momentum turns above or below the central 50 level—adding confluence.
🔵 FEATURES
Trend Detection on Oscillator: Applies SuperTrend logic directly to the Stoch RSI curve.
Clean Entry Signals:
→ 🢁 arrow printed when trend flips bullish below 50 (bottom reversals).
→ 🢃 arrow printed when trend flips bearish above 50 (top reversals).
Custom Multiplier: Adjust sensitivity of SuperTrend band spacing around the oscillator.
Neutral Zone Highlight: Visual zone between 0–50 (green) and 50–100 (red) for quick momentum polarity reference.
Toggle SuperTrend Line: Option to show/hide the SuperTrend trail on the Stoch RSI.
🔵 HOW TO USE
Use 🢁 signals for potential bottom reversals when momentum flips bullish from oversold regions.
Use 🢃 signals for potential top reversals when momentum flips bearish from overbought areas.
Combine with price-based SuperTrend or support/resistance zones for confluence.
Suitable for scalping, swing trading, or momentum filtering across all timeframes.
🔵 CONCLUSION
Stochastic SuperTrend is a simple yet refined tool that captures clean momentum shifts with directional clarity. Whether you're identifying reversals, filtering entries, or spotting exhaustion in a trend, this oscillator overlay delivers just what you need— no clutter, just clean momentum structure.

Kalman Filtered ROC & Stochastic with MA SmoothingThe "Smooth ROC & Stochastic with Kalman Filter" indicator is a trend following tool designed to identify trends in the price movement. It combines the Rate of Change (ROC) and Stochastic indicators into a single oscillator, the combination of ROC and Stochastic indicators aims to offer complementary information: ROC measures the speed of price change, while Stochastic identifies overbought and oversold conditions, allowing for a more robust assessment of market trends and potential reversals. The indicator plots green "B" labels to indicate buy signals and blue "S" labels to represent sell signals. Additionally, it displays a white line that reflects the overall trend for buy signals and a blue line for sell signals. The aim of the indicator is to incorporate Kalman and Moving Average (MA) smoothing techniques to reduce noise and enhance the clarity of the signals.
Rationale for using Kalman Filter:
The Kalman Filter is chosen as a smoothing tool in the indicator because it effectively reduces noise and fluctuations. The Kalman Filter is a mathematical algorithm used for estimating and predicting the state of a system based on noisy and incomplete measurements. It combines information from previous states and current measurements to generate an optimal estimate of the true state, while simultaneously minimizing the effects of noise and uncertainty. In the context of the indicator, the Kalman Filter is applied to smooth the input data, which is the source for the Rate of Change (ROC) calculation. By considering the previous smoothed state and the difference between the current measurement and the predicted value, the Kalman Filter dynamically adjusts its estimation to reduce the impact of outliers.
Calculation:
The indicator utilizes a combination of the ROC and the Stochastic indicator. The ROC is smoothed using a Kalman Filter (credit to © Loxx: ), which helps eliminate unwanted fluctuations and improve the signal quality. The Stochastic indicator is calculated with customizable parameters for %K length, %K smoothing, and %D smoothing. The smoothed ROC and Stochastic values are then averaged using the formula ((roc + d) / 2) to create the blended oscillator. MA smoothing is applied to the combined oscillator aiming to further reduce fluctuations and enhance trend visibility. Traders are free to choose their own preferred MA type from 'EMA', 'DEMA', 'TEMA', 'WMA', 'VWMA', 'SMA', 'SMMA', 'HMA', 'LSMA', and 'PEMA' (credit to: © traderharikrishna for this code: ).
Application:
The indicator's buy signals (represented by green "B" labels) indicate potential entry points for buying assets, suggesting a bullish trend. The white line visually represents the trend, helping traders identify and follow the upward momentum. Conversely, the sell signals (blue "S" labels) highlight possible exit points or opportunities for short selling, indicating a bearish trend. The blue line illustrates the bearish movement, aiding in the identification of downward momentum.
The "Smoothed ROC & Stochastic" indicator offers traders a comprehensive view of market trends by combining two powerful oscillators. By incorporating the ROC and Stochastic indicators into a single oscillator, it provides a more holistic perspective on the market's momentum. The use of a Kalman Filter for smoothing helps reduce noise and enhance the accuracy of the signals. Additionally, the indicator allows customization of the smoothing technique through various moving average types. Traders can also utilize the overbought and oversold zones for additional analysis, providing insights into potential market reversals or extreme price conditions. Please note that future performance of any trading strategy is fundamentally unknowable, and past results do not guarantee future performance.

Stochastic Oversold / Overbought Multi Time Frame on CandleAt the suggestion of a friend, I prepared this educational indicator to show how to use a Multi time frames on the chart based on the color of The Candle.
This Script calculates the stochastic oscillator for multiple timeframes and displays the overbought/oversold signals on the chart with color coding.
The stochastic oscillator is a momentum indicator that compares a security's closing price to its high-low range over a set number of periods. The indicator oscillates between 0 and 100, with readings above 80 considered overbought and readings below 20 considered oversold.
The indicator has the following input parameters:
%K Length: the number of periods used to calculate the stochastic oscillator (default is 14).
%K Smoothing: the number of periods used to smooth the stochastic oscillator (default is 1).
Three timeframes: The timeframes for which the stochastic oscillator is calculated can be set as 15-minute, 1-hour, or 4-hour intervals. For each timeframe, the user can choose to display the indicator (or not) and set the color of the candle. The user can also set the overbought and oversold levels (default is 80 and 20, respectively).
The indicator calculates the stochastic oscillator using the ta.stoch function from the built-in ta library in PineScript. It then uses the ta.sma function to smooth the stochastic oscillator if specified. Finally, the indicator uses the TimeframFuction to calculate the stochastic oscillator for different timeframes, which is then displayed on the chart using the barcolor function. The color of the candle is set based on whether the stochastic oscillator is overbought or oversold, as determined by the overbought/oversold levels specified by the user.
Note: This code is example for you to use multi timeframe in your indicator or Strategy , also prevent Repainting Calculation

Adaptive Fisherized Stochastic Center of GravityIntroduction
I modified the script "Fisher Stochastic Center of Gravity" of @DasanC for this indicator.
I added inverse Fisher transform, cycle period adaptiveness mode (Ehlers) and smoothing to it.
Moreover, I added buy and sell and beautified some stuff.
Lastly, it is also non-repainting!
Usage
This indicator can be used like a normal stochastic, but I don't recommend divergence analysis on it.
That fisherization stuff seems to make the graphs unuseable for that because it tries.
It works well on every timeframe I would say, but lower timeframes are recommended, because of the fast nature of stochastic.
Usually it does a good job on entry confirmation for reversals and trend continuation trades.
Recommended indicator to combine with this indicator is RSI cyclic smoothed v2 .
This is the best RSI version I know. In trending market it is recommended to look more on the inner bands and in flat market it is recommended to look more on the outer bands.
When RSI shows oversold and this indicator shows a crossover of the Center of Gravity plot through the bottom line -> Long entry is confirmed
When RSI shows overbought and this indicator shows a crossunder of the Center of Gravity plot through the top line -> Short entry is confirmed
Settings
The adaptive mode is enabled by default to give you straight the whole indicator experience.
The default settings are optimized, but should be changed depending on the market.
An example:
Market has a low volatility and a high momentum -> I want a slower/higher length to catch the slower new highs and lows.
Market has higher volatility and a low momentum, -> I want a faster/lower length to catch the faster new highs and lows
Signals
Crossover
Buy -> cog crossover signalLine
Sell -> cog crossunder signalLine
Overbought/Oversold Crossover
Buy -> cog crossover lowerBand
Sell -> cog crossunder lowerBand
I use this indicator a lot, because I don't know a better stochastic on this community here.
@DasanC did an awesome work with his version I used as base for this script.
Enjoy this indicator and let the profit roll! 🔥
Stochastic RSI Heat Bollinger BandsThis indicator is based on a combination of the famous Bollinger Bands and the Stochastic RSI indicator.
Bands are dynamically colored (and filled) with a RGB color composed by red and green values, directly generated from the average Stochastic RSI current value.
By default, colors represent the following status -> green zone is overgought & red zone is oversold.
A screener is also displayed on the chart, representing StochRSI K and D lines values, RSI value, as well as the current status (Overbought/Oversold) of the StochRSI and RSI indicators.
Notes:
The heat color and the screener status are both based on the average value between the K and D lines (for stochastic RSI based heat)
Bands can be disabled in options to use this indicator as a simple moving average colored by the Stochastic RSI heat color.
Options:
Various moving average types (SMA, EMA, SMMA, VWMA...)
Inversion of colors between overbought and oversold status
Enabling/disabling heat color on bands / basis line and bands background color
Show/Hide the screener
Color source can be modified to base the heat on the RSI instead of the Stochastic RSI value
Standards Bollinger bands, Stochastic and RSI parameters
Example
Feel free to suggest any improvements in comment.

(JS) Triple StochasticSo I ended up adding a ton of stuff to my prior Double Stochastic script which you can see here .
The concept of the Double was to smooth out the existing Stochastic by applying a Stochastic to the existing Stochastic (hence the Double). My concept for the Triple Stochastic is much different. It combines a regular stochastic, stochastic RSI, and the double stochastic to get a smoothed output based on all 3.
Also - since I love being able to see a Squeeze (see my Squeeze Pro indicators - Squeeze Pro 2 & Squeeze Pro Overlays ) I added the Squeeze to the Stochastic (the dots). If you're unfamiliar with how a Squeeze works, or what it is, check out my links for explanation. A quick explanation however is that the Squeeze is an indicator that was invented by John Carter that detects price compression before a big move out of a range. This is done by using Bollinger Bands and Keltner Channels, the BB shrink inside the KC. The color of the dots represent the depth of the BB in the KC, white (or black) being the lightest squeeze, red being the standard squeeze, and yellow being the strongest squeeze. Now on to the indicator:
The first thing you'll notice is the options available for the type of Stochastic you'd like to use:
Standard : This is a regular Stochastic
Stochastic RSI : This is the standard Stochastic RSI
Double : This is the Stochastic on top of a Stochastic from the prior version
Triple : This is simply an average of all 3 of the above combined together
(Top indicator shows the Triple Stochastic)
The options "K", "D", and "Smooth" are the settings from a regular Stochastic used to set up the type of Stochastic you choose to use.
Now let's say you're not sure how one type performs compared to another, or you like the quickest momentum change but also like to see the smoothest trend, or you want to use the same types of Stochastic and watch for them to cross like moving averages - for these reasons I added the ability to add a second Stochastic for comparison.
(2nd indicator shows a fast and slow Triple Stochastic together)
Quite obviously, the "K 2", "D 2", and "Smooth 2" are what is used in order to set the parameters for the second Stochastic.
Now another thing I added was the option to replace the regular Stochastic and instead look at the distance between the K and D. By turning off "Use K% and D%" you get to see this in action. To put it simply, a cross above zero would indicate a positive Stochastic crossover, and a cross below zero would represent the opposite. There's also an option titled "SMA Length using Difference" which, to smooth this out a bit, allows you to apply a moving average to the distance. By setting it at 1 you'd see the actual distance between K and D.
(3rd indicator shows the K and D distance used as a plot)
Another thing I wanted to do was add a different type of background that wasn't based on the indicator itself. I decided to use ADX & DMI which is a great way to determine the trend. When you select "ADX/DMI BG" the BG colors will change from being based on the indicator to being based on ADX and DMI.
(The 3rd indicator also shows the ADX/DMI BG being used).
And now finally the last feature I decided to add takes us back to the Squeeze. Essentially it is just the Stochastic shown through the lens of Squeeze momentum, as I ended up plugging the Stochastic output into the Squeeze momentum formula to create an oscillator. By selecting "Use Oscillator" you will see this in action as well.
(Bottom indicator shows the oscillator addition)

Stochastic RSI w/ Crossover Alerts (by WJ)NOTE:
// STOCH RSI CODE TAKEN FROM DEFAULT INDICATOR
// I HAVE ONLY MADE SOME ADJUSTMENTS FOR VISUAL AID
// I MADE THIS FOR MY OWN USE BUT HAVE DECIDED TO PUBLISH AND SHARE IN CASE ANYBODY WANTS TO USE IT
This is the normal default built-in Stochastic RSI indicator which I have added some stuff for visual aid:
Added middle line (50)
Stoch RSI background turns green when K line crosses D line UPWARDS, K line is below the 50 level, and price is above 200 EMA
Stoch RSI background turns red when K line crosses D line DOWNWARDS, K line is above the 50 level, and price is below 200 EMA
Alert notification on the crossover candle with background colour change conditions met
Function StochRSI Stochastic Relative Strength Index developed by Tushar Chande and Stanley Kroll.
This script has been written to eliminate the period variable.(Integer)
Thus, it can be used comfortably in adaptive period scripts ! (For example : Adaptive Moving Average , KAMA , FAMA .. etc. )
All efforts goes to ChaosTrader () ,
RicardoSantos () ,
Hpotter for barcolor codes (iff) ()
I hope it will help your new ideas . Best regards ! Noldo .

Stochastics + VixFix Buy/Sell SignalsThis script is designed for long-term investors using ETFs on a weekly timeframe, where catching high-probability bottoms is the goal. It combines the Stochastic Oscillator with the Williams VixFix to identify moments of extreme fear and potential reversals.
A Buy signal is triggered when:
Stochastic %K drops below 20
VixFix forms a green spike (suggesting a panic-driven market flush)
A Sell signal is triggered when:
Stochastic %K rises above 90
VixFix falls below 5 (indicating excessive complacency)
Catching tops is much harder than catching bottoms.
These Sell signals are not designed to fully exit positions. Instead, they suggest trimming a small portion of ETF holdings — simply to free up liquidity for future opportunities.
This strategy is ideal for:
Long-term ETF investors
Weekly charts
Systematic decision-making in volatile markets
Use in conjunction with macro indicators, sector rotation, and valuation frameworks for best results.

Stochastic ChannelsDonchain trend following system with overbought/ oversold areas inspired by stochastic. Multiplier to get non repainting HTF capability. features a smoothed price as well as moving average of the smoothed price, also inspired by the stochastic indicators %K and %D. This and slow stochastics compliment each other nicely.
%D line colored by direction.
Filled color areas represent overbought/oversold.
Shows breakouts as well as giving targets and entries in rangebound markets.

Multi-timeframe MAs + Stoch RSI SignalsHello traders,
I welcome you to my first published script on TradingView: “Multi-timeframe Moving Averages + Stochastic RSI”.
The script is based on a simple formula: Buy signals are generated when a fast moving average is above a slower moving average (uptrend) and the Stochastic RSI K line is crossing above the oversold level (entry).
Sell signals are generated when a fast moving average is below a slower moving average (downtrend) and the Stochastic RSI K line is crossing below the overbought level (entry).
This indicator works best in strong trends!
**Please note the above example has repainting turned on which may produce unrealistic results when viewing historical data. See below for more information regarding this and how you can turn it off.**
The user has the following inputs:
- Option to change the Stochastic RSI settings, including the oversold and overbought levels.
- Option to enter any value for both the Fast Moving Average and the Slow Moving Average.
- Option to change between EMA or SMA for each moving average.
- Multiple time frames to choose from, as well as the ability to selectively turn off individual time frames (both plots and alerts).
(Default time frames are 1 hour, 4 hour, and Daily. You can have a 4th time frame by changing your current time frame to something lower than the other 3 time frames)
- Turn on/off repainting: If repainting is turned on you will get an alert and buy/sell signal on chart immediately when condition is met, however the signal may disappear from chart if the condition reverses during the same candle.
If repainting is turned off, the indicator will wait for the candle to close before issuing the alert and painting the signal on chart.
For higher time frames, the indicator will wait for the candle in the higher time frame to close before issuing a signal if repaint is turned off. Default is set to Repaint on, so please be aware of this if you do not want repainting.
How to use alerts:
- Before you do anything, make sure your current time frame is the lowest time frame you’d like alerts on, as you will still receive alerts for the higher time frames you selected in settings.
- Once you have all the settings changed to how you like, save your chart first. Then right click on any of the indicator’s buy/sell signals on the chart and click “Add Alert on MAs + Stoch RSI”.
- Make sure “Any alert() function call” is selected under the Condition.
- You can delete or change the text in “Alert name” if you want as the alert message is already built into the indicator, and it will tell you in the alert message which asset and time frame to buy or sell.
Other things to note:
- The indicator will not display the buy/sell signals of lower time frames when you are on a higher time frame. This was done purposely to reduce clutter on the chart when you switch to higher time frames.
- While the alert message will tell you which time frame a signal was generated, the plots on the chart will instead show “Buy/Sell TF1, or TF2, or TF3”.
If the signal is from the current time frame that the alert was created on, then it will simply show “Buy” or “Sell”.
Hope you guys enjoy using this one, please drop a like if you found it useful. If anyone wants to modify my script in any way, please just credit me for the original work when you publish the script. Good luck!
