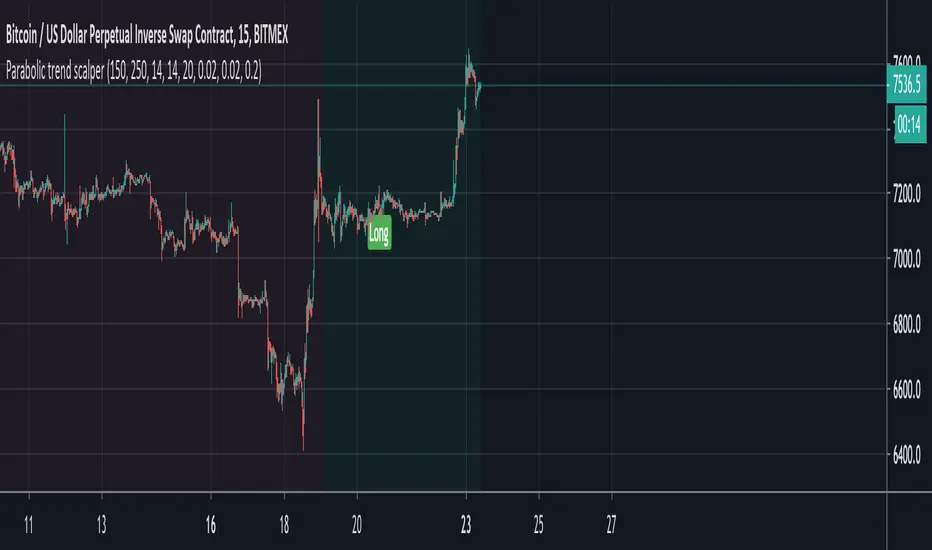
Parabolic trend scalperThis is based on a well known 5 min forex scalping strategy that analyses the general trend and goes long/short in that direction. Trades are filtered against a number of fundamentals to minimise the chances of weak signals.
Dark green = Upward trend
Light green = Long signal
Dark red = Downward trend
Light red = Short signal
Alerts are built in and should be set to 'once per candle' if trading with a bot. Ensure that your setup ignores alerts for positions already open in the same direction.
"scalping" için komut dosyalarını ara
Price reversal intraday IndicatorIndicator “Price reversal intraday”
Class : oscillator
Trading type : scalping+intraday trading
Time frame : 15-30 min
Purpose : trading on rebounds and reversals
Level of aggressiveness : aggressive
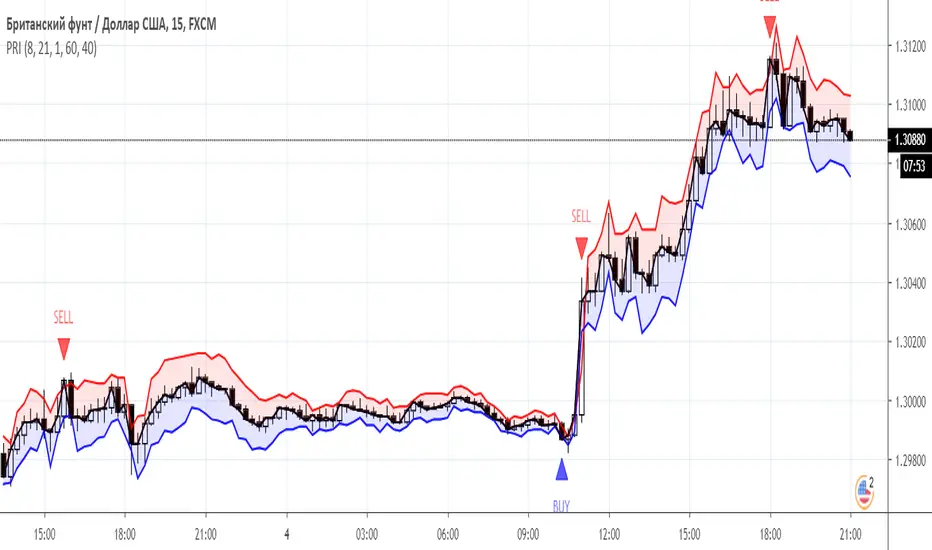
“Price reversal intraday (PRI)” indicator is designed for aggressive intraday trading on rebounds and reversals. It belongs to oscillators. The idea that formed the basis for the creation of “Price reversal intraday (PRI)” is to obtain a synergistic effect from the use of the best oscillatory techniques: modified Bollinger bands and the classic RSI oscillator.
The indicator, using advanced Bollinger technique, monitors the deviation of the current price from the equilibrium value, and then with the help of the RSI oscillator it determines the moment when this deviation reaches a critical point. As a result, a buy or sell signal is generated, which is displayed on the chart in order to facilitate the trading process as much as possible.
Structure of the indicator
Indicator consists of the following elements:
- red zone – indication of a sell zone. Entry into this zone is a signal to close long positions and search for entry points to sell asset;
- red line – extremely high positive deviation of current price from its equilibrium value;
- blue zone - indication of a buy zone. Entry into this zone is a signal to close short positions and search for entry points to buy asset;
- blue line – extremely high negative deviation of current price from its equilibrium value.
Parameters of the indicator
To configure the indicator, the following parameters are provided:
- RSI_period (default value is 8) - period for calculating the RSI oscillator.
- Ranger_period (default value - 21) - period for calculating the modified Bollinger bands.
- Ranger_width (default value - 1) - the parameter used to control the level of aggressiveness of the indicator and frequency of signals. The lower it is, the more signals the indicator will generate. Possible values from 0 to 3.
- ob (the default value is 60) - this parameter defines the overbought zone for the RSI indicator.
- os (the default value is 40) - this parameter defines the oversold zone for the RSI indicator.
Rules of trading
The main task of the trader using indicator is to monitor the location of the current market price relative to the extreme zones (blue/red). Entering the red zone is a signal for closing long positions and searching for sell entry points. Entering the blue zone is a signal for closing short positions and searching for buy entry points.
The appearance of a blue triangle with the inscription “BUY” on the chart is a signal to open buy positions, and a red triangle with the inscription “SELL” is a signal for sale.
M waves Mk3 'Magical M's v1
V2
V3
So I forgot this existed so here is the Opened sourced code (pm me for older sorce code there are 600+ Saves)(pm me for other scrips course code too lazy to republish everything)
Changes: Simplified and annotated code/upgraded to v4 format
as always adjust before using
i use this indicator combined with the other frequency one to help me identify time and direction of next move.
Pair with rsi
Pair with detrended tsi (have unpublished script might share later)
‘Redraw’ safe
Slightly detrented(adjustable) to avoid traps
quick how to use:
Meant as and adjustable indicator to “tune" to personal risk/reward preference
Green means buy red means sell
arrow indicators for long term sell and buy
Highly customizable (candles too)
Check out my profile for previous versions they are less customizable but also easier to get started with
similar to rsi you want to buy/sell when the indicator turns green/red and lines are as pinched as posible (the lines that are being filled).
keep an eye on the other line that moves around ;) if its not matching the other 2 moving averages and the main color indicator chances are its a trap(works both ways)
use the candles to help you keep your eye on the indicator when scalping (look at the original post for some color ideas)

ScalpSnakeA simple Scalping tool, based off of ATR multiples. Long above the line...Short below it. Adjust the length of signal calculation, and the Multiple of the Asset's ATR to loosen/tighten signals as desired...
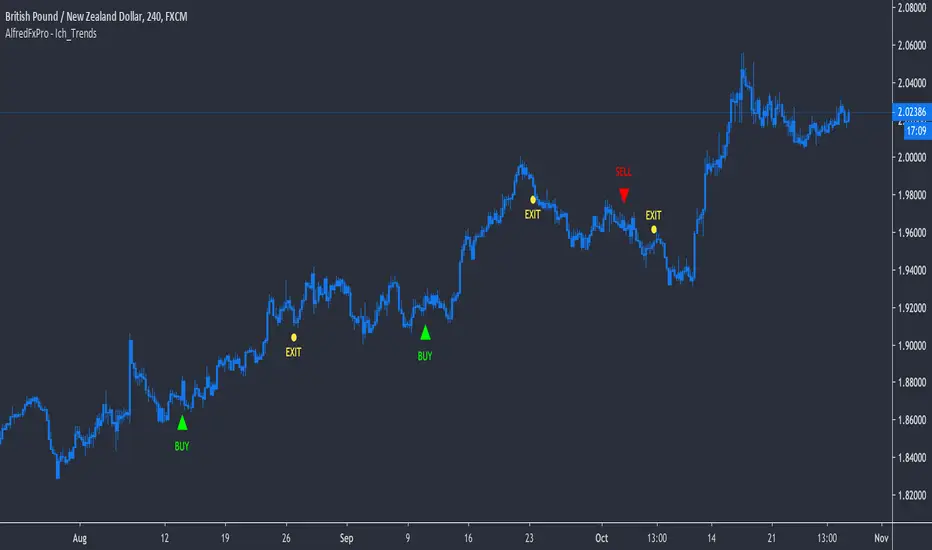
AlfredFxPro - Ichimoku_Trends_AlertsOur powerful Ichimoku Trend Following Scalping Indicator now with LIVE Alerts ( Buy, Sell, Exit Buy, Exit Sell) straight to your PC + Mobile.
*** NO REPAINT *** What you see is what you get. It will fire a signal as soon as the bar close
The (AlfredFxPro - Ich_Trends) uses one element of the famous Ichimoku and combine the signal with two custom volatility indicators to predict potential trends and determine the strength of the trend to keep you in as long as the trend is running or get you out as soon as possible with min loss.
Combine the signal with price action breakout patterns and you have a solid indicator.
It's a very powerful tool to add to your analysis, and make it your own.
**Try on Demo First**
Works best on high volatility instruments
Works on All Assets ( Forex, Crypto, Commodities , Gold , Stocks)
Suggested Timeframes (15min, 30min, 1Hr, 4Hr, D)
*************************
Send us a message for Access!
THIS INDICATOR IS PRIVATE & AVAILABLE FOR MEMBERS ONLY!
**************************
How to Set Alerts :
**Example Buy Signal Alert
-> Go to GBP/NZD 4Hr Timeframe
-> Click Add new Alert
-> Condition -> Select : AlfredFxPro - Ich_Trends
-> Select : Buy Alert
-> Option : Once Per Bar Close
-> Notify on App + POP Up
-> Message: Write: ""Buy 4Hr""
-------------------------------------------
**Example Exit Buy Signal Alert
-> Go to GBP/NZD 4Hr Timeframe
-> Click Add new Alert
-> Condition -> Select : AlfredFxPro - Ich_Trends
-> Select : Long Exit Alert
-> Option : Once Per Bar Close
-> Notify on App + POP Up
-> Message: Write : ""Exit Buy 4Hr""
-------------------------------------------
You repeat the same process for "Sell, and Exit Sell" for any pair on any timeframe you want.
-------------------------------------------
**********Important***********
1) Enter on a Buy and Exit from the same time frame don't mix signals from time frames ( Treat each time frame as an individual trade).
2) Important to set the Alert option: ""Once Per Bar Close"", otherwise you'll get wrong signals.
*************************
Send us a message for Access!
THIS INDICATOR IS PRIVATE & AVAILABLE FOR MEMBERS ONLY!
**************************
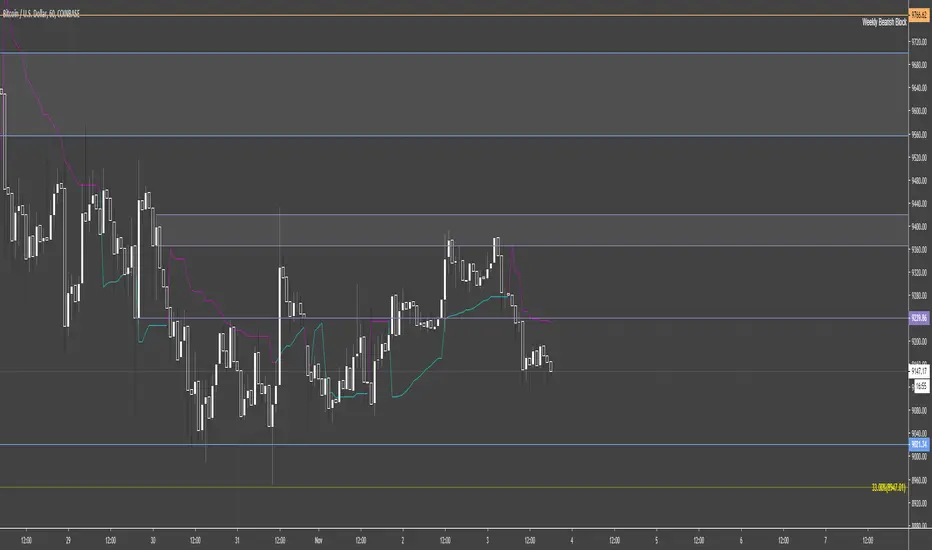
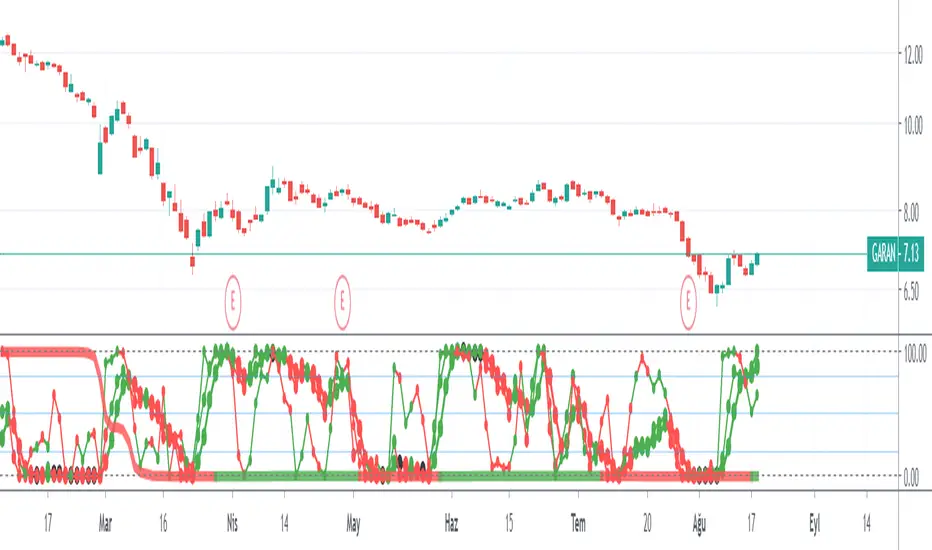
Quantbot Pro
Bot built on advanced algo 'under the hood' made very simple for traders to enter/exit trades.
Notice how the bot enters short in good time before the drop from 10.2 and stays in the position until a long signal is triggered. The bot is designed to capture trends as well as do reasonably well in ranging conditions, and is a very good compromise for traders unwilling/unable to re-train machine learning bots each time market conditions change.
Usage:
Wait for long/short indication by the bot (unconfirmed initially), take the trade once the bot indicates 'confirmed' on candle close.
Exit when opposite unconfirmed signal is flashing (or use in combination with Better SCMR for early exit indication). Notice that the bot will provide dynamic sup/res levels.
It's beneficial to combine the bot signals with Better SCMR, which makes it possible to enter on unconfirmed signals when SCMR gives confluence.
Recommended timeframe for scalping is 1h, while higher timeframe signals give confirmation of sustained trend and keeps the trader in trade.
Quantbot Pro in combination with Better SCMR is a very profitable way to trade, and requires less than a week of practice before going live with good probability of success.
Lifetime license: $900
Monthly trial license: $250
Contact by pm for payment instructions

BORSACA SCALPING & WOLFEThis indicator for borsaca members. This indicator uses scalping waves and gives you suitable entry with wolfe symptoms.
TradingView's Technical AnalysisAll indicators used on the Technical Analysis Summary from TradingView, composed with oscillators and moving averages. Sell and strong sell will represent more indicators showing sell signals. Buy and strong buy will represent more indicators showing buy signals. A white bar will show neutral signal (don't trade). This can be good for binary options or scalping on small time frames, but also very good on higher times for forex. The signal will appear on the candle before, so wait for the new candle to appear to see what direction the signal will indicate.

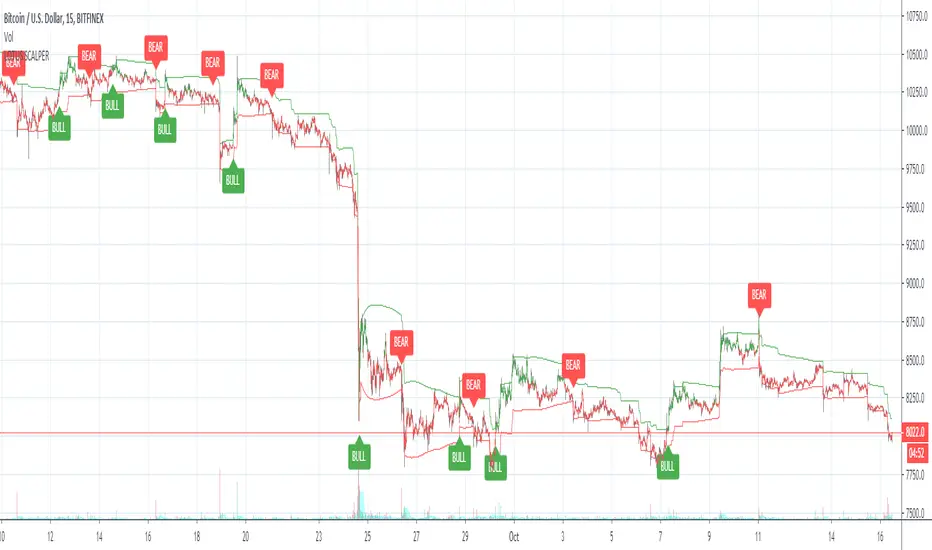
Lotus scalperWelcome to the Lotus scalper. This indicator is designed for scalping the 15m and 30m timeframes.
BULL = Buy
BEAR = Sell
Enjoy and let me know if you have questions!
You can also set alerts with this indicator!
Cyatophilum Shooting Stars 1m [ALERTSETUP]A Scalping Script Setup for the 1m Timeframe, using the cheesy candle pattern "Shooting Stars" plus some Trend Detection, Stop Loss and Take Profit integrated system, allowing these nice backtest results.
Currently in continuous development / real time testing on BitMEX data.

EMA 21,13,8 - scalping3 EMAs will help identify and predict uptrends and downtrends
-If EMAs are all above the candles it a sign to sell & if the EMAs are below its a sign to buy
- If the Green-8 EMA crosses or touches red candle then flips under the other EMAs & candles then it's time to sell
-If the Green-8 EMA crosses or touches green candle then flips above the other EMAs & candles then it's time to buy
- how far is the EMAs from the candle it'll show how strong the trend. combine this strategy with the stochastic oscillator & RSI to get the maximum benefit


Market Cycle & Scalping entry / exitCycle indicator is an oscillator commonly used to identify market trends and provide buy and sell signals to traders. The Cyle indicator is based on the assumption that currency trends accelerate and decelerate in cyclical patterns that may reflect the dominant price cycle of any stock, during any time frame. It works best on a 1 min chart for quick scalp plays.


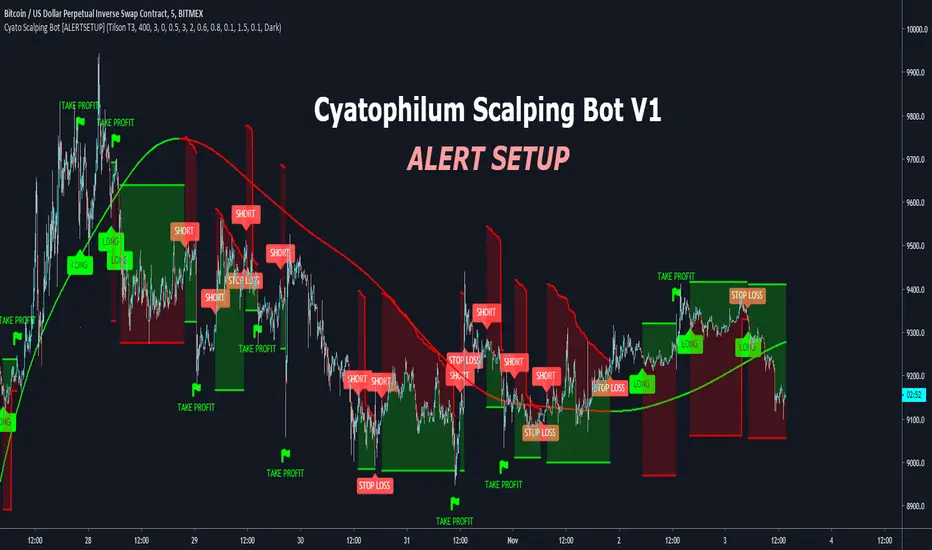
Cyatophilum Scalping Bot [ALERTSETUP]This indicator triggers Short or/and Long entries and exits.
Example with a Long trade:
The integrated stop loss will trigger an alert to exit the trade.
It is possible that a trend reverses during a trade.
In this case, the "LONG EXIT" alert will trigger at the same
time as the "SHORT ENTRY".
The Trend Detector feature, using EMA or Tilson T3 will filter trades that are against the main trend and thus increase profitability.
BONUS FEATURE
Trailing Take Profit with configurable % deviation.
SAMPLE USE CASES
ETH/BTC
ETH/USD
FOREX: GBP/USD
FOREX: XAU/USD
BTC/USDT
LTC/BTC
XRP/BTC
Read More
> Get access to the Cyatophilum Indicators <
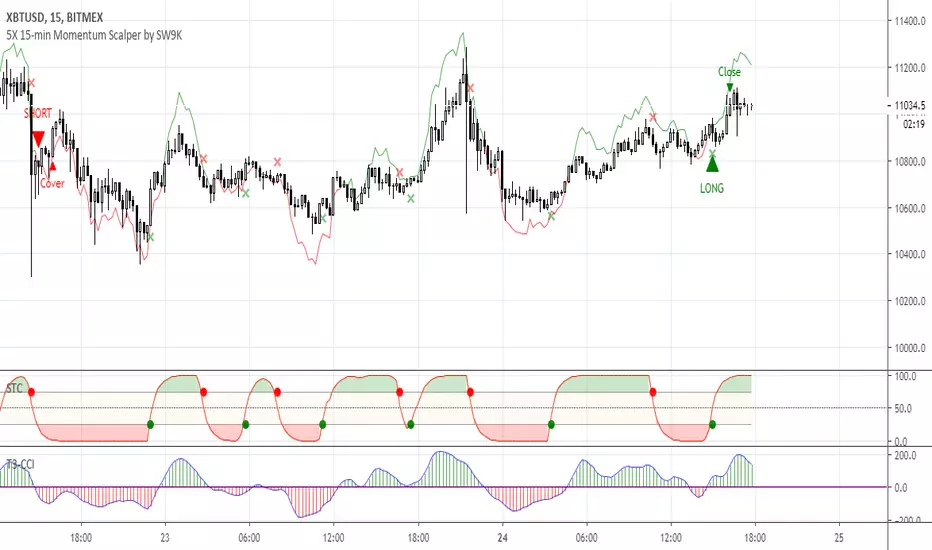
5X 15-min Momentum Scalper by SW9KThis is the alpha release-candidate study script with indicator alerts included. It is currently open for select individuals to test.
The core of this momentum scalper is primarily based on a modified Schaff Trend (which in itself is based on Stochastic elements and MACD) and a modified T3-CCI oscillator, specifically calibrated for 15-minute type movements -- do not apply to any other timeframes. Although it will take small scalps, it is designed to recognize when to ride out underwater positions so use maximum leverage or 5X or you may risk liquidation. Also, there is a stop loss setting feature, but it may reduce profits and win rate.
You can verify the highly accurate 75% win rate performance statistics with 100,000 XBTUSD contracts simulated at .
Features:
40% 3-month net profit, 74.48% win rate, 2.988 profit factor, 3.13% max drawdown, adjusted Sharpe ratio of ~3
Optimized for 15 minute timeframe scalping
Attempts to recognize when to keep position open and ride them out into profitable or breakeven
Profitable even with full Bitmex taker fees (0.075%)
Pyramiding Setting (default 3)
Aggressive Mode to increase entries and potential profits at higher risk
Easy-to-set binary Alerts
Follow SW9K at www.twitter.com
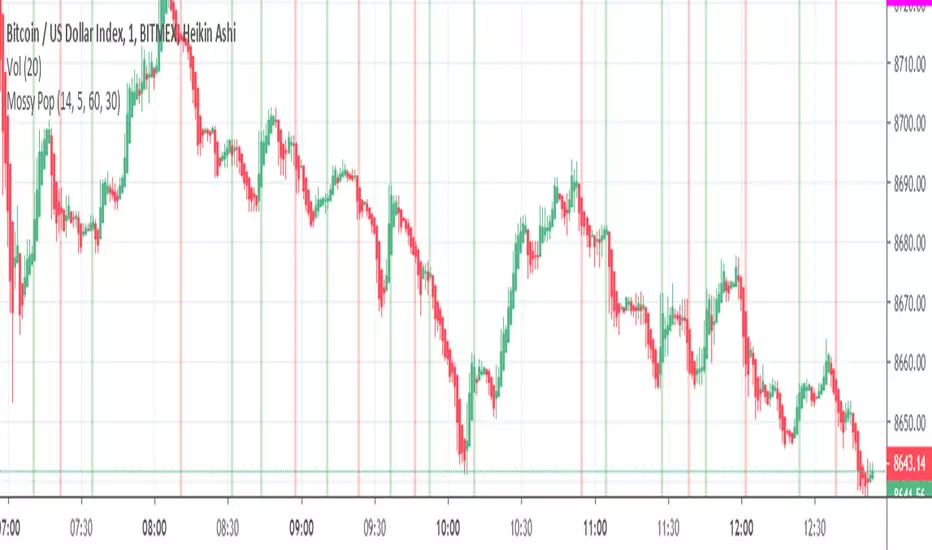
Mossy PopMossy Pop is a variation on the CM Chris Moody Pop 1 that is on the public library.
Bars are colored to show when the Pop is red crossing over the blue line turning bullish (Green Buy Bar)
or when it is overbought in green turning into blue going bearish (Red Sell Bar)
Use with other indicators but can work well on confirming a position on its own.
I find it worked best with Heikin Ashi but candles are fine.
Use with Mossy ADX DI for quick scalping profit and to confirm Buy/Sell signals!
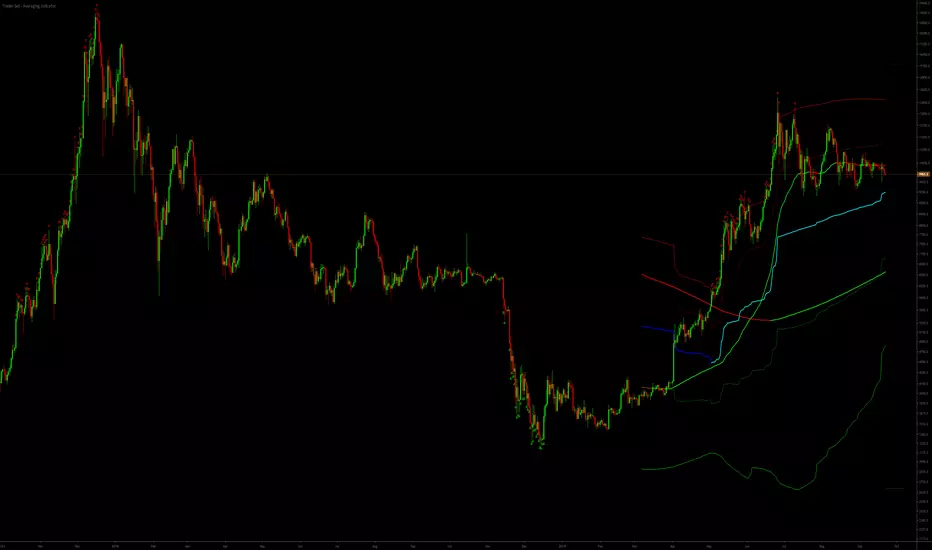
Trader Set - Averaging IndicatorThis is part of my SCALPING strategy, making the tool available for my students to use. In less than a month I will announce how you can get participated in the English version.
PA Researcher Scalping Band v2This is PA Researcher Scalping Band v2
ability to on/off buysell zone
ability to change color
Easy to check Short-Term Trend


