AI Volume Breakout for scalpingPurpose of the Indicator
This script is designed for trading, specifically for scalping, which involves making numerous trades within a very short time frame to take advantage of small price movements. The indicator looks for volume breakouts, which are moments when trading volume significantly increases, potentially signaling the start of a new price movement.
Key Components:
Parameters:
Volume Threshold (volumeThreshold): Determines how much volume must increase from one bar to the next for it to be considered significant. Set at 4.0, meaning volume must quadruplicate for a breakout signal.
Price Change Threshold (priceChangeThreshold): Defines the minimum price change required for a breakout signal. Here, it's 1.5% of the bar's opening price.
SMA Length (smaLength): The period for the Simple Moving Average, which helps confirm the trend direction. Here, it's set to 20.
Cooldown Period (cooldownPeriod): Prevents signals from being too close together, set to 10 bars.
ATR Period (atrPeriod): The period for calculating Average True Range (ATR), used to measure market volatility.
Volatility Threshold (volatilityThreshold): If ATR divided by the close price exceeds this, the market is considered too volatile for trading according to this strategy.
Calculations:
SMA (Simple Moving Average): Used for trend confirmation. A bullish signal is more likely if the price is above this average.
ATR (Average True Range): Measures market volatility. Lower volatility (below the threshold) is preferred for this strategy.
Signal Generation:
The indicator checks if:
Volume has increased significantly (volumeDelta > 0 and volume / volume >= volumeThreshold).
There's enough price change (math.abs(priceDelta / open) >= priceChangeThreshold).
The market isn't too volatile (lowVolatility).
The trend supports the direction of the price change (trendUp for bullish, trendDown for bearish).
If all these conditions are met, it predicts:
1 (Bullish) if conditions suggest buying.
0 (Bearish) if conditions suggest selling.
Cooldown Mechanism:
After a signal, the script waits for a number of bars (cooldownPeriod) before considering another signal to avoid over-trading.
Visual Feedback:
Labels are placed on the chart:
Green label for bullish breakouts below the low price.
Red label for bearish breakouts above the high price.
How to Use:
Entry Points: Look for the labels on your chart to decide when to enter trades.
Risk Management: Since this is for scalping, ensure each trade has tight stop-losses to manage risk due to the quick, small movements.
Market Conditions: This strategy might work best in markets with consistent volume and price changes but not extreme volatility.
Caveats:
This isn't real AI; it's a heuristic based on volume and price. Actual AI would involve machine learning algorithms trained on historical data.
Always backtest any strategy, and consider how it behaves in different market conditions, not just the ones it was designed for.
"scalp" için komut dosyalarını ara

HMA Breakout Buy/Sell indicator for Scalping & Intraday - ShyamHi All,
This is a very simple indicator which provides the buy signal, when the moving average lines turns Green and sell signal, when the moving average signal turns red. This can be used for both intraday and scalping method with different timeframes. But best time frame is 5 minutes.
Buy Signal >>> Line turns GREEN (Use trailing SL to cover maximum profit)
Sell Signal >>> Line turns RED (Use trailing SL to cover maximum profit)
No trade >>> Line turns GRAY
Best timeframe >>> 5 minutes
Thanks,
Shyam

Easy Scalping by JayKasunBINANCE:BTCUSDTPERP
This indicator can show stochastic RSI K and D line crosses and some candlestick patterns on chart.
You can use this indicator to scalping, check usage for more info. Always backtest before trading with your real money.
This indicator will also help mobile TradingView users to get an idea when getting stochastic RSI signals, they can use this indicator to check if stochastic RSI K and D crossed or not. ( Because they have limited area to view chart ) .
4 Exponential moving averages are there in the indicator with easy enable disable option. 9 , 21 , 55 , 100 is suggested as default values.
Meanings of signs in chart
Blue triangle bellow candle means it's a stochastic RSI K and D line cross in oversold level
Red triangle above candle means it's a stochastic RSI K and D line cross in overbought level
Green plus sign shows when EMA 50 crossover EMA 100
Red plus sign shows when EMA 50 cross bellow EMA 100
Features
You can enable candlestick pattern displaying when stochastic RSI K and D cross happen. Check indicator settings.
You can enable displaying ATR Trailing Stops in indicator settings.
Indicator will only show blue triangle after Green plus sign and Red triangles after Red plus sign
After you enable candlestick pattern option, stochastic RSI crosses with candlestick patterns will show in deferent colors. Blue triangle will turn into green and Red triangle into pink.
Usage
Use lower time frames like 5m or 15m
After green plus sign, if price retouched 21 EMA or 55 EMA and blue triangle appeared , you can enter a long position.
After red plus sign, if price retouched 21 EMA or 55 EMA and red triangle appeared , you can enter a short position.
Always wait for candle close . signs of chart can be changed when candle closing. ( Does repaint until candle close )
Use ATR trailing to get a stop loss price.
Use 1:1 or 1:0.5 Risk Reward ratio. Because it's scalping and lower time frame.
Use more indicators like RSI to get more confirmations ( like divergences ) before entering a trade. Its more reliable.
Candlestick Patterns Short names
H - Hammer
IH -Inverted Hammer
BE - Bullish Engulfing ( green triangle )
BE - Bearish Engulfing ( pink triangle )
BH - Bullish Harami ( green triangle )
BH - Bearish Harami ( pink triangle )
I have included ATR + Trailing Stops by SimpleCryptoLife and Candlestick Patterns Identified (updated 3/11/15) by repo32
this is a combination of multiple indicators
credit goes to original creators of above indicators

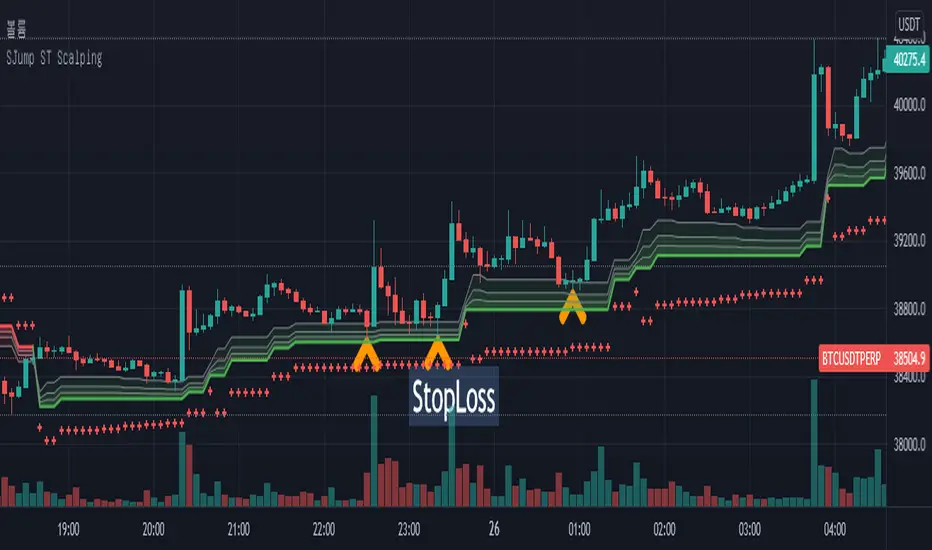
SuperJump HTF SuperTrend for ScalpingThis script can help you perform scalping using SuperTrend
First, set the HTF value higher than your current time frame.
As you know, the accuracy of the supertrend is very poor on the lower timeframe.
So I used higher timeframe(15 mins) supertrend more than current chart(5 mins)
TICK Scalping strategy, SPY 1 min1 min chart scalping version of my other TICK strategy with adjusted parameters and additional entry and exit conditions better suited for 1 min SPY chart. Please refer to my original TICK strategy for explanation.
Important notes:
1. This strategy is designed for same day SPY option scalping on the 1 min chart . All profit shown in back testing report is based on Profit/Loss (P/L) estimates from trading options with approximately 6 weeks of data. By default, it is set to 10 option contracts. By default the initial capital is set to $5000. Pyramiding is set to 3.
2. This strategy works better with non-extended market data .
3. This strategy is mainly developed for SPY trading on 1 min chart, it probably will not be very profitable with other tickers or time frame without tweaking all the parameters first.
Cheers and enjoy~! Let's all make money~!!

crypto futures hourly scalping with ma & rsi - ogcheckershi to all lovable traders,
hereby i want to share a combination of trade ideas for scalping
i've chosen hourly timeframe
indicators used: moving averages and rsi
moving averages:
ema 3, ema 5, ema 7
sma 3, sma 5, sma 7
daily_ema_3, daily_ema_5
daily_ema_5, daily_sma_5
rsi:
rsi 7, rsi 14, rsi 26
daily_rsi_7, daily_rsi_14, daily_rsi_26
as per the analysis over moving average behavioral patterns & rsi movements, useful points are given below which will be helpful while choosing good entry points & exit points,
strategical points for LONG:
* when ema3 crosses above sma3 - green candles start to form
* it's followed by ema5 > sma5 and ema7 > sma7
* when ema3 crosses down sma3 - it's considered as an indication of exit
* if rsi supports then can wait for ema5 crossing down sma5
* as similar, when daily_ema_3 crosses above daily_sma_3, its an higher timeframe bullish indication, so the lower timeframe entries inside this higher timeframe is a sure shot confident entry
* for LONG always take entries when rsi_14 < 30 or 25 else check rsi_7 < 25 or below
* as along the above, bullish CANDLE patterns like bullish engulfing , morning star is been used for entry at lower levels
* so here i've used OPEN as rsi_source in majority
* exit points also indicated at high_rsi and moving average crossunders or reverse crossovers
* for SHORTING, the above said ideas can be used in viceversa
* inputs in the indicator were tailored for users needs so that you will enjoy the magics of customization
if i am wrong in anyways regarding the above indicator strategy, please forgive me and help me improve in this aspect by commenting.
after few more studies and analysis and mainly QUERIES & COMMENTS, i'm planning to backtest these strategies here in tradingview.
also if these strategies are coded in python, we can link it to Binance Futures Algo or Bot Trading.
thankyou for this opportunity,
thanks to tradingview and pinecoders
thanks to Pranab (for 365MA)
thanks to Gandalf (for inspiring)
Special Thanks & Love to Chartbank for Everything

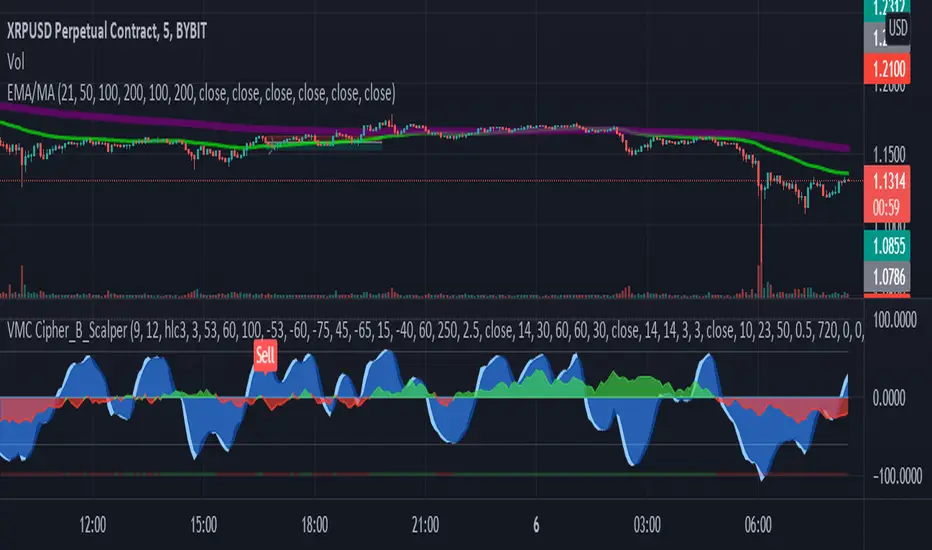
LA_Crpyto_Pirate Modifie VuManChu B Script with Scalping FiltersI added the following filters for entry signals to the VuManChu B with divergences for use as a scalping indicator. You will need to load the 50 EMA and this indicator to trade this per the rules below
The rules for trading this are as follows; You can only take a long or short entry when all of these requirements match
The wave cross is under the zero line (long) or over the zero line (short)
The money flow indicator is green (long) or red (short)
The closing price is above the 200 EMA (long) or below the 200 EMA (short)
price has pulled back to the 50 EMA
Here are the filters I employed in the script to help you trade this
Zero Line Filter: Only signal longs under the zero line and shorts over the zero line will fire off a signal
Money Flow Indicator Filter: Only signal longs when money flow is green and only shorts when money flow is red
200 MA filter: Only longs when price is closing above the 200 EMA and only shorts when price is closing below the 200 EMA
When you get an alert, simply check to see that price has pulled back to the 50 EMA before entering. Place long and short orders when the indicator signals and you confirm price has pulled back to the 50 ema before entering the long or short. Set your Stop Loss above or below the pervious pullback and set a reward ratio of your choice. Good luck!

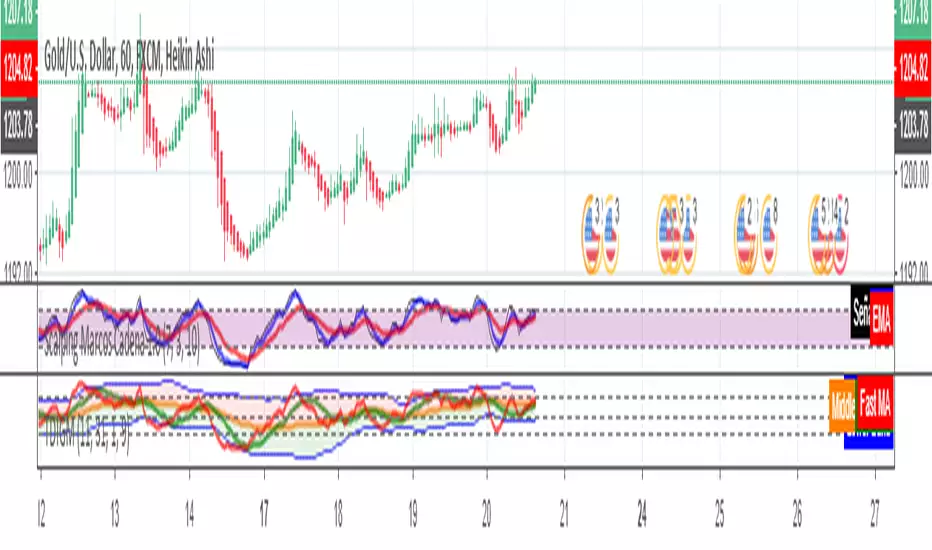
Scalping Marcos Cadena 1.0Scalping Marcos Cadena Crossing of moving averages together identifying within the RSI when it is overbought or oversold
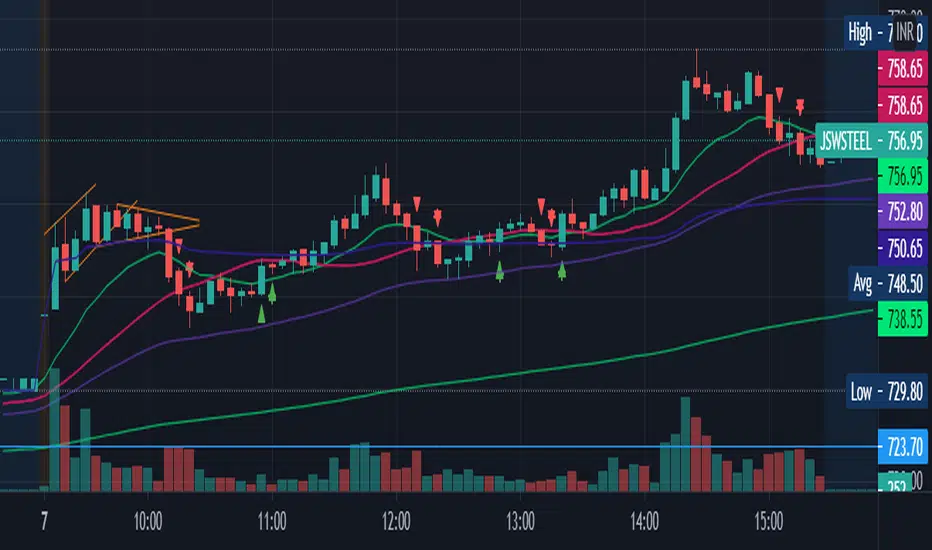
scalping2sahilnarkarThis is the a bit edited to the previous script. As per regulations i have kept this as an open script.
The only Difference to confirm your support resistance levels is an addition of simple moving average 21.
Rules are the Same-
- Trade long when above vwap and 21EMA
- Trade Short when below the VWAP.
EMA21 and EMA50 acts as support where as SMA 21 will show the Trend.
Even though This script is purely based on EMA's, i tend to find the SMA21 as a good Support resistance/support while taking a trade as it avoids the wipsaws while taking an entry.
Please Note-
-This is a scalping Script so book profits and keep stoplosses accordingly.
-When you put this script on the screen, remove everything except EMA9,EMA21,EMA50,EMA200 and the SMA21(keep the arrows and edit the arrows as you want)
-This is not a plug and play script so tune it as you want on the settings.
-Please consider using a VWAP always.
-I have made this script after putting it into many indian stocks you have to tune it as per your stock exchange.
Scalping Line Strategy📌 Scalping Line Strategy – A Precision Crossover System
🔎 Overview
The Scalping Line Strategy is a short-term trading system built around the concept of momentum-driven crossovers between a smoothed moving average filter and a fast signal line. It is designed for scalpers and intraday traders who seek clear entry signals, minimal lag, and adaptive filtering to fit volatile market conditions.
At its core, the strategy uses a custom signal line ("Scalping Line"), which is derived from the difference between a double-smoothed moving average and a shorter-period signal line. Trade entries are triggered when this Scalping Line crosses above or below zero, providing a clean and rules-based framework for both long and short setups.
⚙️ Core Logic
Main Trend Filter – A double-smoothed moving average is calculated over a configurable period (default 100). This reduces noise and provides a more robust backbone for scalping signals.
Percent-Based Filter – To avoid false signals, a customizable percentage filter adjusts how closely the system “respects” price deviations from the moving average. This helps filter out insignificant fluctuations.
Signal Line – A shorter-period simple moving average (default 7) provides faster responsiveness to recent price action.
Scalping Line (SLI) – Calculated as the difference between the fast signal line and the smoothed moving average. When the SLI crosses zero, it signals a potential momentum shift.
SLI > 0 → Momentum bias is bullish.
SLI < 0 → Momentum bias is bearish.
🎯 Trade Direction & Flexibility
Trade Direction Control:
Choose between Long Only, Short Only, or Both to tailor the system to your trading style.
Signal Flip Option:
By default, long entries occur when the SLI crosses below zero, and shorts when it crosses above zero. This orientation can be flipped, allowing for alternative interpretations of the signals depending on how you want to capture momentum in your market.
🕒 Time Window Filtering
For intraday traders, a time filter can be enabled to restrict signals to specific trading sessions (e.g., 9 AM – 4 PM EST). This is particularly useful when trading assets such as equities or futures that have strong intraday volatility windows.
📈 Visuals & Clarity
Scalping Line Plot: Displayed as a dynamic oscillator around a zero baseline.
Histogram Fill: Green when above zero (bullish bias), red when below zero (bearish bias).
Signal Markers: Clear arrows mark long and short entries at crossover points.
Zero Line Reference: A flat gray line at zero assists in visually gauging momentum shifts.
🚀 Strategy Execution
Long Entry: Triggered when SLI crosses below zero (or above zero if flip is enabled) within allowed session hours.
Short Entry: Triggered when SLI crosses above zero (or below zero if flip is enabled) within allowed session hours.
Built-in Signal Cancels: Pending entries are canceled if conditions are no longer valid, ensuring no stale trades remain active.
✅ Best Use Cases
Markets: Works across equities, forex, crypto, and futures with sufficient intraday volatility.
Timeframes: Most effective on 1m to 15m charts for scalping setups, but adaptable to higher frames for swing trading.
Style: Traders who appreciate simple, rules-based momentum crossovers will find this system easy to follow and highly adaptable.
⚠️ Risk Management Note
This strategy is strictly an entry signal framework. Position sizing, stop-loss, and take-profit rules must be overlaid based on your risk management style. Always validate results with backtesting and forward testing before applying to live trading accounts.
📜 Final Thoughts
The Scalping Line Strategy offers a refined, easy-to-interpret approach to intraday trading. By combining smoothed moving averages, adaptive filtering, and flexible signal options, it helps traders identify short-term momentum shifts with clarity and confidence, making it a highly configurable tool for scalping-focused strategies.

Scalping, Swing Pro: Urban Towers + Bollinger(0.5)+ WMA by KidevThis indicator combines narrow Bollinger Bands (σ = 0.5) with a Weighted Moving Average (WMA-96) to provide traders with a reliable framework for identifying both short-term scalps and medium-term swing setups.
Bollinger Bands (0.5σ):
Traditional Bollinger Bands at 2σ cover ~95% of price movement, while 0.5σ bands narrow the focus to ~50% of price activity. This tighter structure makes them ideal for detecting volatility contractions, consolidations, and early breakout signals.
WMA-96 as Trend Reference:
The 96-period WMA acts as a slower, more stable directional guide. Unlike shorter WMAs, this longer setting filters noise and serves as a reference line for the dominant trend. Traders can use it as an anchor for intraday or swing positions.
Scalping & Swing Benefits:
Price holding above the WMA-96 while staying near the upper 0.5σ band often signals strength.
Contractions (squeezes) in the 0.5σ band followed by expansion frequently mark breakout zones.
Pullbacks toward the WMA-96 combined with band signals can act as re-entry or risk-defined trade areas.
This script provides a balanced view of momentum and stability — the 0.5σ bands reveal short-term volatility shifts, while the WMA-96 grounds the trader in the prevailing trend.

Scalping Candle [Crak x MMT]The Scalping Candle is a TradingView indicator designed for scalping strategies, identifying potential bullish and bearish engulfing patterns on price charts. It overlays directly on the chart and marks specific candle patterns with visual signals, helping traders spot short-term trading opportunities. The indicator includes a customizable bias filter to focus on bullish, bearish, or neutral market conditions.
Features
Overlay Indicator : Displays bullish and bearish signals directly on the price chart.
Bias Filter : Allows users to select a market bias ('Bullish', 'Bearish', or 'Neutral') to filter signals based on their trading preference.
Visual Signals : Plots green upward triangles below bullish candles and red downward triangles above bearish candles.
Alerts : Generates alerts for bullish and bearish engulfing patterns, enabling timely notifications for trade setups.
How It Works
The indicator analyzes the relationship between the current and previous candles to detect engulfing patterns:
Bullish Engulfing : Triggered when the current candle's low is at or below the previous candle's low, and its close is at or above the previous candle's midpoint. This signal is displayed only if the bias filter is set to 'Neutral' or 'Bullish'.
Bearish Engulfing : Triggered when the current candle's high is at or above the previous candle's high, and its close is at or below the previous candle's midpoint. This signal is displayed only if the bias filter is set to 'Neutral' or 'Bearish'.
The previous candle's midpoint is calculated as the average of its high and low prices.
Usage
- Add to Chart : Apply the indicator to any TradingView chart.
- Configure Bias Filter :
Neutral : Displays both bullish and bearish signals.
Bullish : Displays only bullish signals.
Bearish : Displays only bearish signals.
- Interpret Signals :
Green upward triangle below a candle indicates a potential bullish reversal.
Red downward triangle above a candle indicates a potential bearish reversal.
- Set Alerts : Use the built-in alert conditions to receive notifications when bullish or bearish engulfing patterns are detected.
Settings
Bias Filter : Choose between 'Neutral', 'Bullish', or 'Bearish' to control which signals are displayed.
Shape Size : Signals are plotted as small triangles for minimal chart clutter.
Alert Conditions : Enable alerts for 'Bullish Engulfing Detected' or 'Bearish Engulfing Detected' to stay informed of new signals.
Ideal Use Case
This indicator is tailored for scalpers and short-term traders looking to capitalize on quick price movements driven by engulfing candle patterns. It works best on 15-minute chart and can be combined with other technical tools for confirmation.

Scalper's Volatility Filter [QuantraSystems]Scalpers Volatility Filter
Introduction
The 𝒮𝒸𝒶𝓁𝓅𝑒𝓇'𝓈 𝒱𝑜𝓁𝒶𝓉𝒾𝓁𝒾𝓉𝓎 𝐹𝒾𝓁𝓉𝑒𝓇 (𝒮𝒱𝐹) is a sophisticated technical indicator, designed to increase the profitability of lower timeframe trading.
Due to the inherent decrease in the signal-to-noise ratio when trading on lower timeframes, it is critical to develop analysis methods to inform traders of the optimal market periods to trade - and more importantly, when you shouldn’t trade.
The 𝒮𝒱𝐹 uses a blend of volatility and momentum measurements, to signal the dominant market condition - trending or ranging.
Legend
The 𝒮𝒱𝐹 consists of a signal line that moves above and below a central zero line, serving as the indication of market regime.
When the signal line is positioned above zero, it indicates a period of elevated volatility. These periods are more profitable for trading, as an asset will experience larger price swings, and by design, trend-following indicators will give less false signals.
Conversely, when the signal line moves below zero, a low volatility or mean-reverting market regime dominates.
This distinction is critical for traders in order to align strategies with the prevailing market behaviors - leveraging trends in volatile markets and exercising caution or implementing mean-reversion systems in periods of lower volatility.
Case Study
Here we can see the indicator's unique edge in action.
Out of the four potential long entries seen on the chart - displayed via bar coloring, two would result in losses.
However, with the power of the 𝒮𝒱𝐹 a trader can effectively filter false signals by only entering momentum-trades when the signal line is above zero.
In this small sample of four trades, the 𝒮𝒱𝐹 increased the win rate from 50% to 100%
Methodology
The methodology behind the 𝒮𝒱𝐹 is based upon three components:
By calculating and contrasting two ATR’s, the immediate market momentum relative to the broader, established trend is calculated. The original method for this can be credited to the user @xinolia
A modified and smoothed ADX indicator is calculated to further assess the strength and sustainability of trends.
The ‘Linear Regression Dispersion’ measures price deviations from a fitted regression line, adding further confluence to the signals representation of market conditions.
Together, these components synthesize a robust, balanced view of market conditions, enabling traders to help align strategies with the prevailing market environment, in order to potentially increase expected value and win rates.

Scalping Swing Trading Tool R1-4 by JustUncleLDescription:
This study project is a "Scalping Swing trading Tool" and is an alternative to the "Scalping Pullback Tool R1". It is designed for a two pane TradingView chart layout :
the first pane set to 15min Time Frame;
the second pane set to 1min Time Frame(TF).
The tools incorporates the majority of the indicators needed to analyse and scalp Trends for Swings, PullBacks and reversals on 15min charts and 1min charts.
Incorporated within this tool are the following indicators:
1. The following EMAs are drawn automatically:
Green = EMA89 (15min TF) = EMA75 (1min TF)
Blue = EMA200 (15min TF) = EMA180 (1min TF)
Black = EMA633 (15min TF) = EMA540 (1min TF)
2. The 10EMA (default) High/Low+Close Price Action Channel (PAC), the PAC channel
display is disabled by default.
3. Optionally display Fractals and optional Fractal levels
4. Optional HH, LH, LL, HL finder.
5. Coloured coded Bar high lighting based on the PAC:
blue = bar closed above PAC
red = bar closed below PAC
gray = bar closed inside PAC
lime Line = EMA10 of bar close
6. Pivot points (disables Fractals automatically when selected) with optional labels.
7. EMA5-12 Channel is displayed by default.
8. EMA12-36 Ribbon is displayed by default
9. Optionally display EMA36 and PAC instead of EMA12-36 Ribbon.
Set up and hints:
I am unable to provide a full description here, as Pullback Trading incorporates a full trading Methodology, there are a number of articles and books written on the subject.
Set to two pane TradingView chart, set first pane to 15Min and second to 1min.
Set the chart to Heikin Ashi Candles (optional).
I also add a "Sweetspot Gold2" indicator to the chart as well to help with support and resistance finding and shows where the important "00" lines are.
Use the EMA200 on the 15min pane as the anchor. So when prices above EMA200 we only trade long (buy) and when prices below the EMA200 we only trade short (sell).
On the 15min chart draw any obvious Vertical Trend Lines (VTL), use Pivots point as a guide.
On the 15min chart what we’re looking for price to Pullback into the EMA5-12 Channel or EMA12-36 ribbon, we draw Trendlines uitilising the Pivot points or Fractals to guide your TL drawing.
On the 15min chart look for the trend to resume and break through the drawn TL. The bar color needs to change back to the trend direction colour to confirm as a break.
Now this break can be traded as a 15min trade or now look to the 1min chart.
On the 1min chart draw any Pullback into any of the EMAs.
On the 1min chart look for the trend to resume and break through the drawn TL. The bar color needs to change back to the trend direction colour to confirm as a break.
Now this break can be traded as a 1min trade.
There is also an option to select Pristine (ie Ideal) filtered Fractals, which look like tents or V shape 5-candle patterns. These are actually used to calculate the Pivot points as well.
Other than the "SweetSpot Gold2" indicator, you should not need any other indicator to successfully trade trends for Pullbacks and reversals. If you really want another indicator use the AO (Awesome Oscillator) as it is momentum based.

Scalp EA for 15 Minute Timeframes and HigherSo I have written this indicator based upon the percentages of the High and the Low of the candlestick with respect to the open price. This indicator by no means tries to find top's and bottom's;however, it does find good opportunities for 5-20 pips reversals or continuations. The signal is provided without delay and should only be based upon the closing of the candle. For example, at open- the indicator will tell you "buy, sell, or remain flat" but you should only buy or sell when the candle has completely closed.
Choose whether to use it for scalps, or to set up larger trades with bigger time frames and support or resistance zones.
*Warning*- This is untested and will remain untested due my unavailability.
Reason behind the coding: As I trader, I like to think that I am always "buying low and selling high"or "selling high and buying low". Throughout my trading experiences, I can tell you that I have done the opposite many times. This indicator helps me in finding opportunities as I have written it to always Sell at the closing price of a green candle and always to buy at the close of a red candle. The indicator makes the attempt to Sell High and Buy Low.


Scalp Pump-Dump Detector with AlertsThis script displays the percentage of movement of all candles on the chart, as well as identifying abnormal movements to which you can attach alerts. An abnormal movement is considered a rise or fall that exceeds the parameter set in the settings (by default, 1% per 1 bar).
Added a function to display the volume on abnormal candlesticks.

Scalp Tool
This script is primarily intended as a scalping tool.
The theory of the tool is based on the fact that the price always returns to its mean.
Elements used:
1. VWMA as a moving average. VWMA is calculated once based on source close and once based on source open.
2. the bands are not calculated like the Bollinger Band, but only a settlement is calculated for the lower bands based on the Lows and for the upper bands based on the Highs. Thus the bands do not become thicker or thinner, but remain in the same measure to the mean value above or below the price.
3. a volume filter on simple calculation of a MA with deviation. Therefore, it can be identified if a volume breakout has occurred.
4. support and resistance zones which are calculated based on the highs and lows over a certain length.
5. RSI to determine oversold and overbought zones. It also tries to capture the momentum by using a moving average (variable selectable) to filter the signals. The theory is that in an uptrend the RSI does not go below 50 and in a downtrend it does not go above 50.
However, this can be very different depending on the financial instrument.
Explanation of the signals:
The main signal in this indicator Serves for pure short-term trading and is generated purely on the basis of the bands and the RSI.
Only the first bands are taken into account.
Buy signal is generated when the price opens below the lower band 1 and closes above the lower band 1 or the RSI crosses a value of 25 from bottom to top.
Sell signal is generated when the price opens above the Upper Band 1 and closes below the Upper Band 1 or the RSI crosses a value of 75 from top to bottom.
The position should be closed when the price hits the opposite band. Alternatively, it can also be closed at the mean.
Other side signals:
1. breakouts:
The indicator includes 2 support and resistance zones, which differ only in length. For the breakout signals, the short version of the R/S is used. A signal is generated when the price breaks through the zones with increased volume. It is then assumed that the price will continue to follow the breakout.
The values of the S/R are adjustable and marked with "BK".
The value under Threshold 2 defines the volume breakout. 4 is considered as the highest value. The smaller the value, the smaller the volume must be during a breakout.
2. bounce
If the price hits a S/R (here the long variant is used with the designation "Support" or "Resistance") and makes a wick with small volume, the script assumes a bounce and generates a Sell or Buy signal accordingly.
The volume can be defined under "Threshold".
The S/R according to the designation as well.
Combined signals:
If the value of the S/R BK and the S/R is the same and the bounce logic of the S/R BK applies and an RSI signal is also generated, a signal is also plotted.
Here the idea was to get very strong signals for possible swing entries.
4. RSI Signals
The script contains two RSI.
RSI 1:
Bullish signal is generated when the set value is crossed from the bottom to the top.
Bearish signal is generated when the set value is crossed from the top to the bottom.
RSI 2:
Bullish signal is generated when the set value is crossed from the top to the bottom.
Bearish signal is generated when the set value is crossed from bottom to top.
For RSI 2 the theory is taken into account according to the description under Used elements point 5
Optical trend filter:
Also an optical trend filter was generated which fills the bands accordingly.
For this the VWMA is used and the two average values of the band.
Color definition:
Gray = Neutral
Red = Bearish
Green = Bullish
If the mean value is above the VWMA and the mean value based on the closing price is above the mean value based on the open price, the band is colored green. It is a bullish trend
If the mean value is below the VWMA and the mean value based on the closing price is below the mean value based on the open price, the band is colored red.
The band is colored gray if the mean value is correspondingly opposite. A sideways phase is assumed.
The script was developed on the basis of the pair BTCUSD in the 15 minute chart and the settings were defined accordingly on it. The display of S/R for forex pairs does not work correctly and should be hidden. The logic works anyway.
When using the script, all options should first be set accordingly to the asset and tested before trading afterwards. It applies of course also here that there is no 100% guarantee.
Also, a strong breakout leads to false signals and overheating of the indicator.

Scalping Trading System ALERT Crypto and StocksThis is the alert version of the strategy with the same name.
Indicators
SImple Moving Average
Exponential Moving Average
Keltner Channels
MACD Histogram
Stochastics
Rules for entry
long= Close of the candle bigger than both moving averages and close of the candle is between the top and bot levels from Keltner . At the same time the macd histogram is negative and stochastic is below 50.
short= Close of the candle smaller than both moving averages and close of the candle is between the top and bot levels from Keltner . At the same time the macd histogram is positive and stochastic is above 50.
Rules for exit
We exit when we meet an opposite reverse order.
This strategy has no risk management inside, so use it with caution !

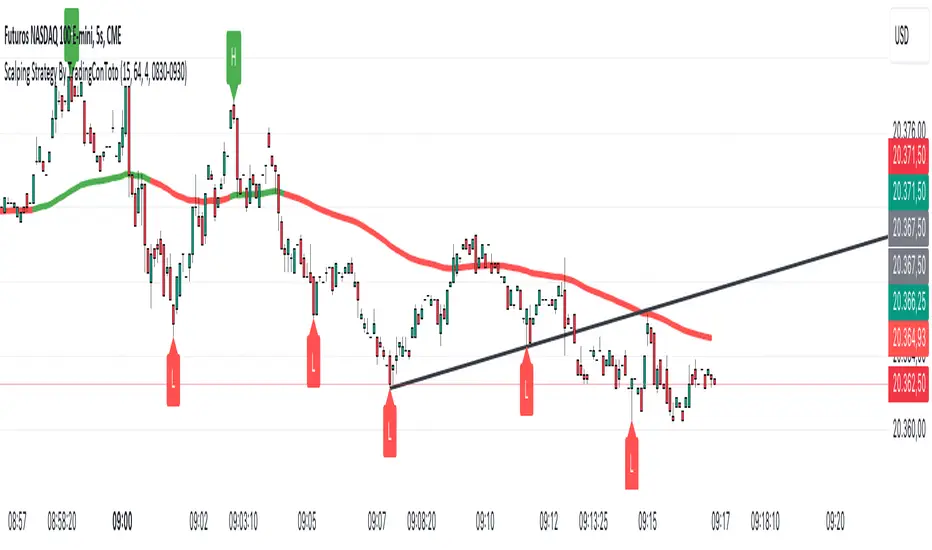
Scalping Strategy By TradingConTotoScript Description: "Scalping Strategy By TradingConToto"
This scalping strategy is designed to trade in volatile markets, taking advantage of rapid price movements. It uses pivots to identify key entry and exit points, along with exponential moving averages (EMAs) to determine the overall trend.
Key Features:
Dynamic Pivots: Calculates pivot highs and lows to identify support and resistance zones, improving entry accuracy.
Market Trend Analysis: Utilizes a 100-period EMA for long-term trend analysis and a 25-period EMA for short-term trends, facilitating informed decision-making.
Automated Entry and Exit: Generates buy and sell signals based on EMA crossovers and specific market conditions, ensuring you don't miss opportunities.
Risk Management: Allows you to set take profit and stop loss levels tailored to market volatility, using the ATR for effective risk management.
User-Friendly Interface: Easily customize strategy parameters such as pivot range, stop loss and take profit pips, and spread.
Requirements:
Ideal for use on short time frames during high activity sessions, like the configured scalping session.
Activate buy and sell options according to your preference and analyze performance using TradingView’s tools.
Note:
This script is a tool and does not guarantee results. It is recommended to test in a simulated environment before applying it to real accounts.
Optimize your scalping operations and enhance your market performance with this effective strategy!
Scalping Indicator + BJ Signal V3This indicator is designed for 1-minute scalping, combining momentum exhaustion, trend confirmation, and precise entry timing into a single visual tool.
It integrates the following core elements:
Williams %R to identify extreme overbought and oversold conditions
Stochastic (80 / 20 logic) to detect exhaustion, rejection, and re-entry timing
MACD histogram for momentum confirmation
SMA (7) as a short-term trend filter
Sequential-style exhaustion counts (8 / 9) used as contextual reference only
🔹 Signal Logic Overview
Signals are generated exclusively on the 1-minute timeframe
Buy signals focus on:
Exhaustion in oversold conditions
Stochastic recovery from the 20 level
Momentum turning positive on the MACD histogram
Sell signals focus on:
Exhaustion in overbought conditions
Stochastic rejection from the 80 level
Momentum turning negative on the MACD histogram
Background colors highlight potential exhaustion zones, while arrows distinguish between:
Real-time (unconfirmed) signals
Confirmed (closed bar) signals
This design helps traders avoid premature entries during fast market conditions.
⚠️ Important Notes
This indicator is not a standalone trading system
Sequential-style counts are not entry signals by themselves
Always combine with:
Market structure
Session awareness (e.g. high-volatility opens)
Proper risk management
🎯 Best Use Case
1-minute scalping
Short-term mean reversion after momentum exhaustion
Traders who prefer clear, non-repainting visual signals
