3 EMA + RSI with Trail Stop [Free990] (LOW TF)This trading strategy combines three Exponential Moving Averages (EMAs) to identify trend direction, uses RSI to signal exit conditions, and applies both a fixed percentage stop-loss and a trailing stop for risk management. It aims to capture momentum when the faster EMAs cross the slower EMA, then uses RSI thresholds, time-based exits, and stops to close trades.
Short Explanation of the Logic
Trend Detection: When the 10 EMA crosses above the 20 EMA and both are above the 100 EMA (and the current price bar closes higher), it triggers a long entry signal. The reverse happens for a short (the 10 EMA crosses below the 20 EMA and both are below the 100 EMA).
RSI Exit: RSI crossing above a set threshold closes long trades; crossing below another threshold closes short trades.
Time-Based Exit: If a trade is in profit after a set number of bars, the strategy closes it.
Stop-Loss & Trailing Stop: A fixed stop-loss based on a percentage from the entry price guards against large drawdowns. A trailing stop dynamically tightens as the trade moves in favor, locking in potential gains.
Detailed Explanation of the Strategy Logic
Exponential Moving Average (EMA) Setup
Short EMA (out_a, length=10)
Medium EMA (out_b, length=20)
Long EMA (out_c, length=100)
The code calculates three separate EMAs to gauge short-term, medium-term, and longer-term trend behavior. By comparing their relative positions, the strategy infers whether the market is bullish (EMAs stacked positively) or bearish (EMAs stacked negatively).
Entry Conditions
Long Entry (entryLong): Occurs when:
The short EMA (10) crosses above the medium EMA (20).
Both EMAs (short and medium) are above the long EMA (100).
The current bar closes higher than it opened (close > open).
This suggests that momentum is shifting to the upside (short-term EMAs crossing up and price action turning bullish). If there’s an existing short position, it’s closed first before opening a new long.
Short Entry (entryShort): Occurs when:
The short EMA (10) crosses below the medium EMA (20).
Both EMAs (short and medium) are below the long EMA (100).
The current bar closes lower than it opened (close < open).
This indicates a potential shift to the downside. If there’s an existing long position, that gets closed first before opening a new short.
Exit Signals
RSI-Based Exits:
For long trades: When RSI exceeds a specified threshold (e.g., 70 by default), it triggers a long exit. RSI > short_rsi generally means overbought conditions, so the strategy exits to lock in profits or avoid a pullback.
For short trades: When RSI dips below a specified threshold (e.g., 30 by default), it triggers a short exit. RSI < long_rsi indicates oversold conditions, so the strategy closes the short to avoid a bounce.
Time-Based Exit:
If the trade has been open for xBars bars (configurable, e.g., 24 bars) and the trade is in profit (current price above entry for a long, or current price below entry for a short), the strategy closes the position. This helps lock in gains if the move takes too long or momentum stalls.
Stop-Loss Management
Fixed Stop-Loss (% Based): Each trade has a fixed stop-loss calculated as a percentage from the average entry price.
For long positions, the stop-loss is set below the entry price by a user-defined percentage (fixStopLossPerc).
For short positions, the stop-loss is set above the entry price by the same percentage.
This mechanism prevents catastrophic losses if the market moves strongly against the position.
Trailing Stop:
The strategy also sets a trail stop using trail_points (the distance in price points) and trail_offset (how quickly the stop “catches up” to price).
As the market moves in favor of the trade, the trailing stop gradually tightens, allowing profits to run while still capping potential drawdowns if the price reverses.
Order Execution Flow
When the conditions for a new position (long or short) are triggered, the strategy first checks if there’s an opposite position open. If there is, it closes that position before opening the new one (prevents going “both long and short” simultaneously).
RSI-based and time-based exits are checked on each bar. If triggered, the position is closed.
If the position remains open, the fixed stop-loss and trailing stop remain in effect until the position is exited.
Why This Combination Works
Multiple EMA Cross: Combining 10, 20, and 100 EMAs balances short-term momentum detection with a longer-term trend filter. This reduces false signals that can occur if you only look at a single crossover without considering the broader trend.
RSI Exits: RSI provides a momentum oscillator view—helpful for detecting overbought/oversold conditions, acting as an extra confirmation to exit.
Time-Based Exit: Prevents “lingering trades.” If the position is in profit but failing to advance further, it takes profit rather than risking a trend reversal.
Fixed & Trailing Stop-Loss: The fixed stop-loss is your safety net to cap worst-case losses. The trailing stop allows the strategy to lock in gains by following the trade as it moves favorably, thus maximizing profit potential while keeping risk in check.
Overall, this approach tries to capture momentum from EMA crossovers, protect profits with trailing stops, and limit risk through both a fixed percentage stop-loss and exit signals from RSI/time-based logic.
"rsi" için komut dosyalarını ara

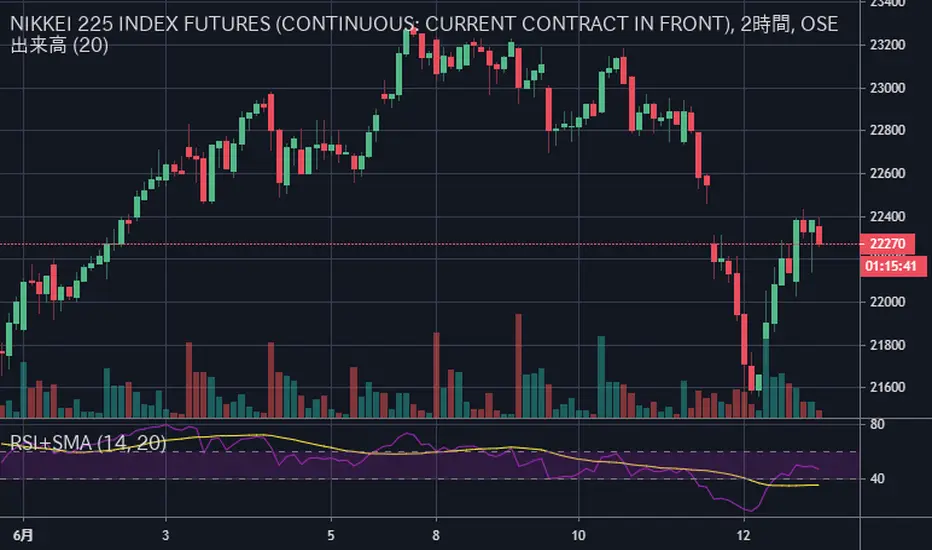
RSI+SMARSIにSMAを加えただけのシンプルなインジケータです
SMAはRSIの計算結果を元に出しています
考え方の例 :
買いの例)
1 RSIがSMAを上抜いた
2 RSIがSMAを上抜き、かつ、60以上である
売りの例)
1 RSIがSMAを下抜いた
2 RSIがSMAを下抜き、かつ、40以下である
This simple indicator is plot SMA, in RSI indicator.
SMA is calculated based on the calculated RSI value
Example of way of thinking :
buy ex)
1 RSI break out SMA
2 RSI break out SMA and RSI over 60
sell ex)
1 RSI break down SMA
2 RSI break down SMA and RSI under 40
RSI-RS StrategyRSI-RS Strategy: Smart Trend Following 🚀
Overview
This strategy combines Multi-Timeframe RSI with Mansfield Relative Strength to identify high-momentum breakouts in strong stocks. Unlike standard RSI strategies, it features a "Smart Trailing Stop" that tightens when momentum weakens but respects key RSI 50 support levels to avoid shaking you out of winning trades.
Key Features ✨
1. 🎯 High-Probability Entries
Multi-Confirmations: Requires Monthly RSI > 60 and Weekly RSI > 60 (Trend is Up).
Dual Trigger: Enters on a Daily RSI Breakout (>60) OR a Weekly RSI Catch-up, ensuring you don't miss late moves.
RS Filter: Only buys stocks outperforming the Index (RS > 0).
New Listing Safe: Automatically skips Monthly checks for new IPOs lacking history.
2. 🛡️ Advanced "Hybrid" Stop Loss
This strategy solves the "Wick Out" problem:
Confirmation Exit: If price drops below the Stop Loss, it waits for the Next Candle to confirm the breakdown. It ignores intraday wicks!
Crash Protection: Includes a "Panic Button" (Default 3% buffer). If price crashes rapidly intraday, it exits immediately to save capital.
Smart Trailing: The Stop Loss moves UP when RSI shows weakness (<60), locking in profits.
3. 🧠 Smart Support Buffer
Wait for 50: Uniquely detects when RSI is resting on 50 Support (Zone 50-55).
Patience: It ignores minor weakness signals in this zone, waiting for a bounce instead of exiting prematurely.
4. 🧹 Clean Visuals
Minimalist Labels: Transparent Entry/Exit labels that don't declutter the chart.
Setup Watch: Visually signals "Watch > " before the trade triggers.
Transparency: "SL Update" diamonds prove exactly why the stop moved (showing the RSI value).
Settings Guide ⚙️
Confirmation Window: How many bars the breakout remains valid (Default: 2).
RSI Support Buffer: The "Safe Zone" range above 50 (Default: 5).
Crash Buffer %: Distance below SL for immediate emergency exit (Default: 3.0%).
Visuals: Toggle Setup Labels and SL Diamonds on/off to keep your chart clean.
How to Trade It
Green Background: You are in a trade.
Red Line: Your Hard Stop Loss (Closing Basis).
Maroon Dotted Line: Your Crash Limit (Intraday Danger Zone).
Orange Diamond: Warning! RSI Weakness detected, SL has tightened.
Disclaimer
Backtested on Indian Equities (NSE). Designed for Swing Trading on Daily Timeframe. Always manage your own risk.

Cardwell RSI by TQ📌 Cardwell RSI – Enhanced Relative Strength Index
This indicator is based on Andrew Cardwell’s RSI methodology , extending the classic RSI with tools to better identify bullish/bearish ranges and trend dynamics.
In uptrends, RSI tends to hold between 40–80 (Cardwell bullish range).
In downtrends, RSI tends to stay between 20–60 (Cardwell bearish range).
Key Features :
Standard RSI with configurable length & source
Fast (9) & Slow (45) RSI Moving Averages (toggleable)
Cardwell Core Levels (80 / 60 / 40 / 20) – enabled by default
Base Bands (70 / 50 / 30) in dotted style
Optional custom levels (up to 3)
Alerts for MA crosses and level crosses
Data Window metrics: RSI vs Fast/Slow MA differences
How to Use :
Monitor RSI behavior inside Cardwell’s bullish (40–80) and bearish (20–60) ranges
Watch RSI crossovers with Fast (9) and Slow (45) MAs to confirm momentum or trend shifts
Use levels and alerts as confluence with your trading strategy
Default Settings :
RSI Length: 14
MA Type: WMA
Fast MA: 9 (hidden by default)
Slow MA: 45 (hidden by default)
Cardwell Levels (80/60/40/20): ON
Base Bands (70/50/30): ON

RSI Multi-TF TabRSI Multi-Timeframe Table 📊
A tool for multi-timeframe RSI analysis with visual overbought/oversold level highlighting.
Description
This indicator calculates the Relative Strength Index (RSI) for the current chart and displays RSI values across five additional timeframes (15m, 1h, 4h, 1d, 1w) in a dynamic table. The color-coded system simplifies identifying overbought (>70), oversold (<30), and neutral zones. Visual signals on the chart enhance analysis for the current timeframe.
Key Features
✅ Multi-Timeframe Analysis :
Track RSI across 15m, 1h, 4h, 1d, and 1w in a compact table.
Color-coded alerts:
🔴 Red — Overbought (potential pullback),
🔵 Blue — Oversold (potential rebound),
🟡 Yellow — Neutral zone.
✅ Visual Signals :
Background shading for oversold/overbought zones on the main chart.
Horizontal lines at 30 and 70 levels for reference.
✅ Customizable Settings :
Adjust RSI length (default: 14), source (close, open, high, etc.), and threshold levels.
How to Use
Table Analysis :
Compare RSI values across timeframes to spot divergences (e.g., overbought on 15m vs. oversold on D).
Use colors for quick decisions.
Chart Signals :
Blue background suggests bullish potential (oversold), red hints at bearish pressure (overbought).
Always confirm with other tools (volume, trends, or candlestick patterns).
Examples :
RSI(1h) > 70 while RSI(4h) < 30 → Possible reversal upward.
Sustained RSI(1d) above 50 may indicate a bullish trend.
Settings
RSI Length : Period for RSI calculation (default: 14).
RSI Source : Data source (close, open, high, low, hl2, hlc3, ohlc4).
Overbought/Oversold Levels : Thresholds for alerts (default: 70/30).
Important Notes
No direct trading signals : Use this as an analytical tool, not a standalone strategy.
Test strategies historically and consider market context before trading.

RSI Horizontal resistance levelsRSI Horizontal Resistance Levels
Purpose
This study automatically draws horizontal price rays every time the Relative Strength Index (RSI) trades inside a user‑defined band (default = 50 ± 1). The idea is to spotlight price levels that historically coincided with a specific RSI state—levels that often evolve into short‑term support or resistance as sentiment repeats.
How it works
Raw RSI – The script computes an un‑smoothed RSI of the closing price (rsiLength, default = 3).
Trigger zone – Whenever RSI falls within level ± tolerance (e.g., 49 – 51) the close price of that bar becomes a reference.
Horizontal ray – A ray (extend.right) is drawn from that close and continues indefinitely to the right, creating a live price level.
History management – Only the most recent N rays are kept (maxRays, default = 5); the oldest line is deleted automatically to avoid chart clutter.
Inputs
Name Default Description
RSI Length 3 Look‑back of the RSI calculation.
RSI Level 50 Center of the trigger zone. Common alternatives: 30, 70, custom mid‑lines.
Tolerance 1 Width of the RSI band on each side of RSI Level (set 0 for an exact hit).
Max Rays 5 Maximum number of active horizontal levels kept on screen.
Ray Color Yellow Visual color of the rays.
Ray Width 2 Thickness of the rays.
How to use it
Spot recurring reaction zones – Markets often hesitate near prices where momentum has flipped before. The rays reveal those spots automatically.
Combine with candlestick or volume cues – A level marked by this script plus a rejection wick, volume spike, or divergence can strengthen conviction.
Adapt the band –
50 ± tolerance → momentum balance line (trend pullbacks)
70 ± tolerance → overbought fade levels
30 ± tolerance → oversold bounce levels
Works on any asset or timeframe; shorter RSI periods highlight intraday rotations, longer periods capture swing pivots.
Tips & cautions
A drawn line is not a guarantee of future reversal—always validate with price action and risk management.
For high‑frequency strategies, consider lowering tolerance or increasing rsiLength to reduce noise.
You can add custom alerts on RSI crossing the band to receive push or email notifications.
Happy trading!

RSI with HMA & Momentum ZonesRSI with HMA & Momentum Zones — Indicator Description
This indicator combines Relative Strength Index (RSI) analysis with Hull Moving Averages (HMA) and Momentum Zone detection to provide a multi-layered view of market strength, trend shifts, and divergence signals.
It includes:
Main Features:
RSI Core:
Standard RSI calculated from a customizable source (close, open, etc.) with adjustable length.
A dynamic RSI Signal Line is plotted with selectable smoothing types (SMA, EMA, SMMA, WMA, VWMA) to enhance trend-following signals.
RSI crossovers of its signal line change color (green for bullish crossovers, red for bearish crossunders).
Hull Moving Averages (HMA):
Two HMA lines are plotted based on the RSI:
Short HMA (fast) and Long HMA (slow).
Color shifts indicate crossovers between RSI and Short HMA (short-term trend change) and Short HMA vs Long HMA (longer-term trend shifts).
Momentum Zones:
When the gap between the RSI and the Long HMA exceeds a user-defined threshold:
A green background highlights strong bullish momentum.
A red background highlights strong bearish momentum.
Helps visualize when momentum becomes extended.
Divergence Detection (Optional):
Regular and hidden bullish and bearish divergences are automatically detected between price and RSI.
Divergences are plotted on the RSI pane with labels ("Bull", "H Bull", "Bear", "H Bear").
Adjustable lookback settings for fine-tuning sensitivity.
Alerts are available for all divergence events.
Visual Enhancements:
A shaded cloud fills between RSI and its signal line, green for bullish bias and red for bearish bias.
Horizontal bands at 70, 50, and 30 levels to mark traditional RSI zones (overbought, neutral, oversold).
Customization Options:
All major components — RSI settings, Signal Line type, HMA lengths, Momentum Zone threshold, and Divergence controls — are fully adjustable.

rsi wf breakoutRSI Breakout Asif
RSI Breakout Asif Indicator
Overview:
The RSI Breakout Asif indicator is a custom script designed to analyze and highlight potential
breakout points using the Relative Strength Index (RSI) combined with Williams Fractals. This
indicator is specifically developed for traders who want to identify key momentum shifts in the
market.
Features:
1. RSI Analysis:
- The RSI is calculated using a user-defined length and price source.
- Horizontal lines are plotted at levels 70 (overbought), 50 (neutral), and 30 (oversold) to visually
aid decision-making.
2. Williams Fractals on RSI:
- Detects fractal highs and lows based on RSI values.
- Highlights these fractal points with dynamic, symmetrical lines for better visibility.
3. Customization:
- Users can adjust the RSI length and price source for personalized analysis.
- Fractal settings (left and right bar length) are also adjustable, making the indicator versatile for
different trading styles.
4. Visual Enhancements:
- Fractal highs are marked in red, while fractal lows are marked in green.
Asif - Page 1
RSI Breakout Asif
- Precise line placement ensures clarity and reduces chart clutter.
5. Practical Utility:
- Use the fractal breakout signals in conjunction with other technical indicators for enhanced
decision-making.
Usage:
- Add the RSI Breakout Asif indicator to your TradingView chart.
- Adjust the settings according to your trading strategy.
- Observe the RSI values and fractal points to identify potential breakout zones.
Disclaimer:
This indicator is a technical analysis tool and should be used in combination with other analysis
methods. It does not guarantee profitable trades.
Watermarked by Asif.
Asif - Page 2

RSI Custom LevelsRSI Custom Levels is a "one stop shop" for a complete strategy based on RSI.
AS per principal: RSI oscillates between 0-100 and therefore the indicator is build around various parameters of RSI. It comprises of 4 different levels of RSI and therefore highlights the candles accordingly.
Understanding each LEVEL:
Level 1 (Highlight): Highlights candles that have an RSI value (closing basis) less than Level 1 specified value (default 20)
Level 2 (Highlight): Highlights candles that have an RSI value (closing basis) greater than Level 1 specified value (default 20) and less than Level 2 specified value (default 45)
Level 4 (Highlight): Highlights candles that have an RSI value (closing basis) greater than Level 4 specified value (default 80)
Level 3 (Highlight): Highlights candles that have an RSI value (closing basis) greater than Level 3 specified value (default 55) and less than Level 4 specified value (default 80)
The most efficient way to trade is as follows:
TRENDING SETUPS:
Uptrend Setups: When RSI enters Level 3 with exit at Level 4
Downtrend Setups: When RSI enters Level 2 with exit at Level 1
SIDEWAYS APPLICATION:
When RSI is in between Level 2 and 3 that area has no highlights as the system considers it to be FLAT and non oscillating.
OVERSTRETCHED APPLICATIONS:
Downtrend Reversal: When RSI enters Level 2 from Level 1 that is a sign for a downtrend reversal.
Uptrend Reversal: When RSI enters Level 3 from Level 2 that is a sign for a uptrend reversal.
Moreover the most ideal scenario is to convert the colour of all candles into white (in dark theme) or black(in light theme) for best performance.
RSI Stochastic AlignmentRSI Stochastic Alignment input RSI and Stochastic into 1 windows and align them to find bullish and bearish divergence.
A. The Line display in windows:
1. Fast RSI (green line) is RSI(close,3)
2. Slow Rsi (red line) is Linear Regession of Fast RSI with 5 period and offset 0 = linreg(rsi,5,0)
3. Fast Stochastic (blue line) is %K of Stochastic
4. Slow Stochastic (aqua line) is %D of Stochastic
B. Alignment and Divergence Detect
1. Bearish Divergence:
* Slow RSI at top
* Fast Stochastic at bottom
* Fast RSI over overbought level (default = 70)
* Slow Stochastic under overbought level minus a constant value (Divergence Power value, default this value = 1)
2. Bullish Divergence:
* Fast Stochastic at top
* Slow RSI at bottom
* Fast RSI under oversold level (default = 30)
* Slow Stochastic over oversold level plus a constant value (Divergence Power value, default this value = 1)
C. Script Option
1. RSI value adjustable
2. Stochastic value adjustable
3. Overbought and Oversold Level adjustable
4. Enable/Disable Level line
5. Enable/Disable Divergence Column
6. Enable/Disable Key Bar Colored

RSI on 21 MA (Custom)RSI on 21 MA (Custom)
RSI on 21 MA (Custom) is a momentum-based indicator that applies the Relative Strength Index (RSI) to a 21-period Simple Moving Average of price instead of raw price data. This approach helps reduce market noise and provides smoother, more reliable momentum signals.
The indicator first calculates a 21-period SMA of the closing price, then computes RSI on this moving average. A short moving average is further applied to the RSI values for additional smoothing, making trend strength and reversals easier to identify.
🔧 Features
RSI calculated on a 21-period Moving Average
Smoothed RSI for clearer momentum structure
Customizable RSI length, MA length, and smoothing period
Adjustable Overbought & Oversold levels
Useful for trend continuation, reversal spotting, and momentum confirmation
📌 How to Use
RSI staying above mid-range indicates bullish momentum
RSI staying below mid-range indicates bearish momentum
Crosses above the oversold level may signal potential bullish reversal
Crosses below the overbought level may signal potential bearish reversal
Best used with price action, support & resistance, or volume indicators
🎯 Ideal for traders who prefer clean momentum signals with reduced noise, especially in trending markets.

Stoch + RSI DashboardIndicator Description
MTF Stochastic + RSI Dashboard FLEX with STRONG Alerts
A compact, multi-timeframe dashboard that shows Stochastic %K/%D, RSI and signal states across user-defined timeframes. Columns can be toggled on/off to keep the panel as small as you need. Signal texts and colors are fully customizable. The table can be placed in any chart corner, and the background color & opacity are adjustable for perfect readability.
What it shows
• For each selected timeframe: %K, %D, a signal cell (Bullish/Bearish/Strong), RSI value, and RSI state (Overbought/Oversold/Neutral).
• Timeframes are displayed as friendly labels (e.g., 60 → 1h, W → 1w, 3D → 3d).
Signals & logic
• Bullish/Bearish when %K and %D show a sufficient gap (or an optional confirmed cross).
• Strong Bullish when both %K and %D are below the “Strong Bullish max” threshold.
• Strong Bearish when both %K and %D are above the “Strong Bearish min” threshold.
• Optional confirmation: RSI < 30 for Strong Bullish, RSI > 70 for Strong Bearish.
Alerts
• Global alerts for any selected timeframes when a STRONG BULLISH or STRONG BEARISH event occurs.
Key options
• Column visibility toggles (TF, %K, %D, Signal, RSI, RSI Status).
• Custom signal texts & colors.
• Dashboard position: top-left / top-right / bottom-left / bottom-right.
• Table background color + opacity (0 = opaque, 100 = fully transparent).
• Sensitivity (minimum %K–%D gap) and optional “cross-only” mode.
• Customizable timeframes for display and for alerts.
Default settings
• Stochastic: K=5, D=3, SmoothK=3
• RSI length: 14
• Decimals: 1
• Strong Bullish max: 20
• Strong Bearish min: 80
• Default TFs & alerts: 3m, 15m, 1h, 3h, 6h, 12h, 1d, 3d, 1w

RSI Divergence Indicator + Current Value - YOSIRSI Divergence Indicator – TradingView
The RSI Divergence Indicator is a custom TradingView tool designed to detect and visualize both regular and hidden divergences between price action and the Relative Strength Index (RSI).
🔹 Core Features:
Plots RSI with standard overbought (70), oversold (30), and midline (50) levels.
Highlights regular bullish divergence (price makes lower low, RSI makes higher low).
Highlights regular bearish divergence (price makes higher high, RSI makes lower high).
Detects hidden bullish divergence (price higher low, RSI lower low).
Detects hidden bearish divergence (price lower high, RSI higher high).
Clear visual signals using colored markers and labels (“Bull”, “Bear”, “H Bull”, “H Bear”).
Built-in alert conditions to notify traders when new divergences appear.
🔹 Customization:
Adjustable RSI period and source (default: 14, close).
Configurable pivot lookback (left & right) for fine-tuning divergence detection.
Options to enable/disable plotting of specific divergence types.
Custom colors for bullish, bearish, hidden bullish, and hidden bearish signals.
🔹 Added Upgrade (based on your request):
Displays the current RSI value next to the line, allowing quick reference without hovering.

RSI Z‑Score + TableRSI Z-Score + Table
This script calculates the Z-Score of the RSI (Relative Strength Index), which standardizes RSI based on its own recent history.
What It Shows:
RSI Z-Score = (Current RSI - Mean RSI) / Standard Deviation
This tells you how extreme the current RSI is compared to its historical values.
A table displays:
Current RSI
Rolling Mean
RSI Z-Score
How to Use:
Z-Score > +2 = Statistically overbought
Z-Score < -2 = Statistically oversold
Use it to time reversals or overextension in RSI behavior.
🔒 Based on rolling lookback window — fully customizable.
Author:
Tags: #RSI #ZScore #Momentum #StatisticalEdge #MeanReversion #Crypto

Apex Edge - RSI Trend LinesThe Apex Edge - RSI Trend Lines indicator is a precision tool that automatically draws real-time trendlines on the RSI oscillator using confirmed pivot highs and lows. These dynamic trendlines track RSI structure in motion, helping you anticipate breakout zones, reversals, and hidden divergences.
Every time a new pivot forms, the indicator automatically re-draws the RSI trendline between the two most recent pivots — giving you an always-current view of momentum structure. You’ll instantly see when RSI begins compressing or expanding, long before price reacts.
Key Features: • Dynamic RSI trendlines drawn from the last 2 pivots
• Auto re-draws in real-time as new pivots form
• Optional "Full Extend" or "Pivot Only" modes
• Slope color-coded: green = support, red = resistance
• Built-in dotted RSI levels (30/70 default)
• Alert conditions for RSI trendline breakout signals
• Ideal for spotting divergence, compression, and early SMC confluence
This is not your average RSI — it’s a fully reactive momentum edge overlay designed to give you clarity, structure, and timing from within the oscillator itself. Perfect for traders using Smart Money Concepts, divergence setups, or algorithmic trend tracking.
⚔️ Built for precision. Built for edge. Built for Apex.

RSI-BBGun-v6.1RSI BB Gun – Operator's Guide
“Eyes on target. Wait for the right moment. Then strike.”
________________________________________
🎯 Mission Objective
RSI BB Gun identifies extreme market conditions using RSI and Bollinger Bands, then overlays trend and volatility intelligence so you know when the setup is real.
The ❌ is your target acquisition signal—price just moved from an extreme zone back into play. Now you’ve got a clean radar lock.
________________________________________
📡 How to Operate
🟣 Step 1: Watch for the ❌'s (Black X = RSI & Bollinger Band Extremes Encountered)
• The Purple X means price and RSI are both stretched—and just snapped back into range.
• The target is now in the cross hairs and potentially ready for engagement.
🟥 Step 2: Confirm the Trend
• The thick ribbon tells you if the trend is with you:
o 🟢 Green = Uptrend. Focus on long setups.
o 🔴 Red = Downtrend. Focus on puts or short plays.
• Align with trend. Only engage when the field favors your position.
🔺 Step 3: Evaluate Signal Context
• Green Triangles = price just crossed below lower Bollinger Band (oversold).
• Red Triangles = price crossed above upper Band (overbought).
• Horizontal Lines Disappeared = The bar after the green or red horizontal line disappears means its time. We patiently wait for this as it means the momentum may be changing.
• These are your early indicators—they scout the setup on the GO / NO GO DECISION.
• ❌ + triangle + trend = clean shot.
________________________________________
☁️ Avoid These Situations
• ❌ in a choppy/no-trend zone = false alarm. Don’t engage.
• Repeated black ❌s without a purple ❌confirmation = low conviction. Let it go.
________________________________________
________________________________________
🪖 Operator's Mindset
“You don’t chase trades. You stalk them. When the ❌ flashes, the system has found a target. What you do next is up to your discipline, your tools, and your plan.”
________________________________________
Note: This is a free version. Upcoming paid version includes multi-timeframes working together. Multiple strategies. Volatility meter. Make money and master the BB Gun so that you can elevate to the Snipers weapon.
🔒 Want More Firepower?
Upgraded version coming soon. Unlocks next-gen targeting tools:
• Multi-timeframe RSI intelligence in a live dashboard
• Precision-timed combo signals based on layered volatility + RSI logic
• Advanced trend filters, trade zone overlays, and sniper-level entry indicators
• Ideal for swing traders and options strategists who want clarity under pressure
💥 Budget-friendly. No subscription. Upgrade when you're ready to go Pro.
Tip: Make 4+ trades mastering this setup. Then use a small portion of the trades to gain more features. Always be in a position you cannot lose.
🆚 Why This Beats Standard RSI/BB Tools
Mission Feature Basic Indicators RSI Ribbon Lite
Trend Confirmation ❌ ✅ Ribbon Overlay
Multi-Timeframe Awareness ❌ ✅ 5-Timeframe RSI Grid
Volatility Confirmation ❌ ✅ Weighted ATR Scoring
Combo Signal Alerts ❌ ✅ ❌ Reentry Combo Alerts
TradingView Alerts ❌ ✅ Built-In Radar Ping
#rsi #bb #bollingerbands #hull ma #trend

RSI + MFI Momentum Mapper - CoffeeKillerRSI + MFI Momentum Mapper - CoffeeKiller Indicator Guide
Welcome traders! This guide will walk you through the RSI + MFI Momentum Mapper indicator, an innovative market analysis tool developed by CoffeeKiller that combines two powerful oscillators to create a comprehensive momentum visualization system.
🔔 **Warning: This Is Not a Standard RSI or MFI Indicator** 🔔 This indicator combines and normalizes RSI and MFI data to create a unified momentum representation with boundary detection and peak signaling features.
Core Concept: Combined Momentum Analysis
The foundation of this indicator lies in merging the strengths of two complementary oscillators - Relative Strength Index (RSI) and Money Flow Index (MFI) - to provide a more robust momentum signal that accounts for both price action and volume.
Directional Columns: Momentum Strength
- Positive Green Columns: Bullish momentum
- Negative Red Columns: Bearish momentum
- Color intensity varies based on momentum strength
- Special coloring for new high/low boundaries
Marker Lines: Dynamic Support/Resistance
- High Marker Line (Magenta): Tracks the highest point reached during a bullish phase
- Low Marker Line (Cyan): Tracks the lowest point reached during a bearish phase
- Creates visual boundaries showing momentum extremes
Peak Detection System:
- Triangular markers identify significant local maxima and minima
- Background highlighting shows important momentum peaks
- Helps identify potential reversal points and momentum exhaustion
Reference Lines:
- Zero Line (Gray): Divides bullish from bearish momentum
- High Line (+1): Upper threshold for extremely bullish conditions
- Low Line (-1): Lower threshold for extremely bearish conditions
Core Components
1. Oscillator Normalization
- RSI and MFI values centered around zero
- Values scaled to create consistent visualization
- Normalized range typically between -1 and +1
- Combination of indicators for signal reliability
2. Boundary Tracking System
- Automatic detection of highest values in bullish phases
- Automatic detection of lowest values in bearish phases
- Step-line visualization of boundaries
- Color-coded for easy identification
3. Peak Detection System
- Identification of local maxima and minima
- Background highlighting of significant peaks
- Triangle markers for peak visualization
- Zero-line cross detection for trend changes
4. Signal Smoothing
- Signal line calculation via SMA
- Helps filter noise and identify trends
- Provides confirmation of momentum direction
Main Features
Oscillator Settings
- Customizable RSI length for sensitivity control
- Customizable MFI length for sensitivity control
- Normalized display for consistent visualization
- Signal smoothing for clearer readings
Visual Elements
- Color-coded columns showing momentum direction and strength
- Dynamic marker lines for momentum boundaries
- Peak triangles for significant turning points
- Background highlighting for peak identification
- Reference lines for momentum threshold levels
Signal Generation
- Zero-line crosses for trend change signals
- Boundary breaks for momentum strength
- Peak formation for potential reversals
- Color changes for momentum direction and acceleration
Customization Options
- RSI and MFI length parameters
- Marker line visibility and colors
- Peak marker color selection
- Peak background display options
Trading Applications
1. Trend Identification
- Directional line crossing above zero: bullish trend beginning
- Directional line crossing below zero: bearish trend beginning
- Column color: indicates momentum direction
- Column height: indicates momentum strength
2. Reversal Detection
- Peak triangles after extended trend: potential exhaustion
- Background highlighting: significant reversal points
- Directional line approaching marker lines: potential trend change
- Color shifts from bright to muted: decreasing momentum
3. Momentum Analysis
- Breaking above previous high boundary: accelerating bullish momentum
- Breaking below previous low boundary: accelerating bearish momentum
- Special coloring (magenta/cyan): boundary breaks indicating strength
- Approaching +1/-1 lines: extreme momentum conditions
4. Market Structure Assessment
- Consecutive higher peaks: strengthening bullish structure
- Consecutive lower troughs: strengthening bearish structure
- Peak comparisons: relative strength of momentum phases
- Boundary line steps: market structure levels
Optimization Guide
1. Oscillator Settings
- RSI Length: Default 14 provides balanced signals
- Lower values (7-10): More responsive, potentially noisier
- Higher values (20-30): Smoother, fewer false signals
- MFI Length: Default 14 provides balanced signals
- Lower values: More responsive to volume changes
- Higher values: Less sensitive to short-term volume spikes
2. Visual Customization
- Marker Line Colors: Adjust for visibility on your chart
- Peak Marker Color: Default yellow provides good contrast
- Enable/disable background highlights based on preference
- Consider chart background when selecting colors
3. Signal Interpretation
- Stronger signals: When directional line approaches +1/-1
- Confirmation: When peaks form after extended momentum
- Early warnings: When color intensity changes before direction
- Trend strength: Distance between zero line and current reading
4. Reference Line Usage
- Zero line: Primary trend divider
- +1/-1 lines: Extreme momentum thresholds
- Marker lines: Dynamic support/resistance levels
- Distance from reference: Momentum strength measure
Best Practices
1. Signal Confirmation
- Wait for zero-line crosses to confirm trend changes
- Look for peak formations to identify potential reversals
- Check for boundary breaks to confirm strong momentum
- Use with price action for entry/exit precision
2. Timeframe Selection
- Lower timeframes: more signals, potential noise
- Higher timeframes: cleaner signals, less frequent
- Multiple timeframes: confirm signals across time horizons
- Match to your trading style and holding period
3. Market Context
- Strong bullish phase: positive columns breaking above marker line
- Strong bearish phase: negative columns breaking below marker line
- Columns approaching zero: potential trend change
- Columns approaching +1/-1: extreme conditions, potential reversal
4. Combining with Other Indicators
- Use with trend indicators for confirmation
- Pair with other oscillators for divergence detection
- Combine with volume analysis for validation
- Consider support/resistance levels with boundary lines
Advanced Trading Strategies
1. Boundary Break Strategy
- Enter long when directional line breaks above previous high marker line
- Enter short when directional line breaks below previous low marker line
- Use zero-line as initial stop-loss reference
- Take profits at formation of opposing peaks
2. Peak Trading Strategy
- Identify significant peaks with triangular markers
- Look for consecutive lower peaks in bullish phases for shorting opportunities
- Look for consecutive higher troughs in bearish phases for buying opportunities
- Use zero-line crosses as confirmation
3. Extreme Reading Strategy
- Look for directional line approaching +1/-1 lines
- Watch for color changes and peak formations
- Enter counter-trend positions after confirmed peaks
- Use tight stops due to extreme momentum conditions
4. Column Color Strategy
- Enter long when columns turn bright green (increasing momentum)
- Enter short when columns turn bright red (increasing momentum)
- Exit when color intensity fades (decreasing momentum)
- Use marker lines as dynamic support/resistance
Practical Analysis Examples
Bullish Market Scenario
- Directional line crosses above zero line
- Green columns grow in height and intensity
- High marker line forms steps upward
- Peak triangles appear at local maxima
- Background highlights appear at significant momentum peaks
Bearish Market Scenario
- Directional line crosses below zero line
- Red columns grow in depth and intensity
- Low marker line forms steps downward
- Peak triangles appear at local minima
- Background highlights appear at significant momentum troughs
Consolidation Scenario
- Directional line oscillates around zero line
- Column colors alternate frequently
- Marker lines remain relatively flat
- Few or no new peak highlights appear
- Directional values remain small
Understanding Market Dynamics Through RSI + MFI Momentum Mapper
At its core, this indicator provides a unique lens to visualize market momentum by combining two complementary oscillators:
1. Combined Strength: By averaging RSI (price-based) and MFI (volume-based), the indicator provides a more comprehensive view of market momentum that considers both price action and buying/selling pressure.
2. Normalized Scale: The indicator normalizes values around zero, making it easier to identify bullish vs bearish conditions and the relative strength of momentum in either direction.
3. Dynamic Boundaries: The marker lines create a visual representation of the "high water marks" of momentum in both directions, helping to identify when markets are making new momentum extremes.
4. Exhaustion Signals: The peak detection system highlights moments where momentum has reached a local maximum or minimum, often precursors to reversals or consolidations.
Remember:
- Combine signals from directional line, marker lines, and peak formations
- Use appropriate timeframe settings for your trading style
- Customize the indicator to match your visual preferences
- Consider market conditions and correlate with price action
This indicator works best when:
- Used as part of a comprehensive trading system
- Combined with proper risk management
- Applied with an understanding of current market conditions
- Signals are confirmed by price action and other indicators
DISCLAIMER: This indicator and its signals are intended solely for educational and informational purposes. They do not constitute financial advice. Trading involves significant risk of loss. Always conduct your own analysis and consult with financial professionals before making trading decisions.

RSI Multi Alert KrafturRSI Multi Alert Kraftur
Description
The "RSI Multi-Level Signals" indicator is designed to help traders identify potential buy and sell opportunities based on RSI (Relative Strength Index) crossings of multiple customizable levels. Unlike traditional RSI indicators that focus on single overbought/oversold thresholds (e.g., 70/30), this script stands out by offering four distinct buy and sell levels for enhanced flexibility and precision. It plots signals directly on the price chart and provides real-time alerts when RSI crosses these levels, making it a powerful tool for spotting entry and exit points.
Key Features
Multi-Level RSI: Configurable buy levels (e.g., 30, 25, 20, 15) and sell levels (e.g., 70, 75, 80, 85) to capture varying degrees of overbought and oversold conditions.
Visual Signals: Buy signals are marked with circles below the bars, and sell signals above the bars, each color-coded for easy identification.
Real-Time Alerts: Generates alerts once per bar when RSI crosses a level, with a filter to prevent duplicate signals during oscillations.
Customizable: Adjustable RSI length, timeframe, and level colors to suit different trading strategies.
Recommended Usage
This indicator is best used as a scanning tool for finding entry points across multiple assets. Set up alerts for your entire watchlist of coins or stocks to detect when RSI crosses the configured levels in real time. It’s particularly effective in volatile markets or for traders employing multi-timeframe analysis. Combine it with other indicators (e.g., support/resistance or trend filters) to confirm signals and improve accuracy.
How to Use
Apply the indicator to your chart.
Customize the RSI length, timeframe, and signal levels to match your trading style.
Set up alerts for the indicator and apply them to your watchlist of assets.
Monitor the chart for buy (green) and sell (red) signals, or rely on alert notifications.
Perfect for scalpers, swing traders, or anyone looking to automate signal detection across a portfolio!
Multi Type RSI [Misu]█ This Indicator is based on RSI ( Relative Strength Index ) & multiple type of MA (Moving Average) to show different variations of RSI.
The relative strength index (RSI) is a momentum indicator used in technical analysis to evaluate overvalued or undervalued conditions in the price of that security.
█ Usages:
The purpose of this indicator is to obtain the RSI calculated with different MAs modes instead of the classic RMA.
The red and green zones indicate the oversold and overbought zones.
Buy or sell signals are marked by the green and red circles
We have 2 different signal modes : when the different size RSIs cross and when the fast RSI crosses the extreme bands.
Alerts are setup.
█ Parameters:
Lenght RSI: The lenght of the RSI. (14 by default)
RSI MA Type: The type of MA with which the rsi will be calculated. ("SMA", "EMA", "SMMA (RMA)", "WMA", "VWMA")
Fast Lenght MA: The fast lenght smoothing MA.
Slow Lenght MA: The Slow lenght smoothing MA.
Lower Band: The lenght of the lower band. (25 by default)
Upper Band: The lenght of the upper band. (75 by default)
Signal Type: The mode with which buy and sell signals are triggered. ("Cross 2 Mas", "Cross Ma/Bands")

Mini RSI+STOCH-RSI+RSI-DIVERGENCE @Marx_CapitalMini version of RSI + STOCHASTIC-RSI with RSI-Divergence detection - all in one, adjustable small table overlayed on your chart. The table box gives RSI and Stoch-RSI values and signals detected RSI divergences.
Uncheck 'Update only on bar close' in indicator settings if the box does not appear right away.

RSI Divergences (Regular, Hidden, Exaggerated)RSI Divergences (Regular, Hidden, Exaggerated)
This indicator detects and visually highlights all major types of RSI divergences on your chart: Regular, Hidden, and Exaggerated divergences, both bullish and bearish.
Key Features:
Calculates RSI based on a user-defined length and timeframe that automatically matches your chart's timeframe.
Identifies pivot highs and lows on both price and RSI using customizable pivot left/right bars.
Detects divergences when RSI and price movements disagree, signaling potential trend reversals or continuation.
Differentiates between three types of divergences:
Regular Divergence: Classic signal for possible trend reversal.
Hidden Divergence: Often indicates trend continuation.
Exaggerated Divergence: A less common form signaling momentum changes.
Draws clear colored lines and labels on the RSI pane for each divergence, using green for bullish and red for bearish signals.
Includes RSI overbought (70) and oversold (30) bands with gradient fills to help visualize RSI zones.
Efficient use of arrays to track pivots and manage plotting history for smooth performance.
Usage:
Ideal for traders looking to leverage RSI divergences for better timing entries and exits in trending and range-bound markets. The script is fully customizable and works seamlessly across different timeframes

Multifactor Buy/Sell Strategy V2 | RSI, MACD, ATR, EMA, Boll.BITGET:1INCHUSDT
This Pine Script code for TradingView is a multifactor Buy/Sell indicator that combines several technical factors to generate trading signals based on trend, volatility, and volume conditions. Here’s a breakdown of the main components and functionality:
Indicator Name
- Multifactor Buy/Sell Strategy V2 — an overlay indicator applied directly on the price chart.
### Input Parameters
The script includes multiple customizable parameters:
- RSI, EMA, MACD parameters — for setting periods and signals of MACD and RSI.
- ATR and Bollinger Bands — used for volatility analysis and level determination.
- Minimum Volatility Threshold — sets a minimum Bollinger Band width threshold for determining high volatility.
Core Indicators
1. RSI — calculated to identify oversold (below 30) and overbought (above 70) conditions.
2. EMA and MACD — calculates exponential moving averages and MACD histogram to determine trend direction.
3. ATR and Bollinger Bands — used to assess current volatility and establish dynamic upper and lower bands.
Volatility and Volume Analysis
- Determines the current ATR level and Bollinger Band width to evaluate high volatility.
- Calculates the volume moving average to track periods of increased volume during high volatility.
Trend Analysis
The script uses the difference between fast and slow EMAs to define strong trends:
- Uptrend — when the fast EMA is above the slow EMA, the price is above the fast EMA, and the trend is strong.
- Downtrend — when the fast EMA is below the slow EMA, the price is below the fast EMA, and the trend is strong.
Momentum Filter
- Based on the price change over the last three bars and compared against the minimum volatility threshold to identify strong momentum.
Buy and Sell Signal Generation
- Buy Signal: Uptrend with RSI oversold, positive MACD histogram, high volatility and volume, strong momentum, and sufficient Bollinger Band width.
- Sell Signal: Downtrend with RSI overbought, negative MACD histogram, high volatility and volume, strong momentum, and sufficient Bollinger Band width.
Visualization
- Buy and sell signals are displayed as green and red triangles on the chart.
- Plots for fast and slow EMAs, upper and lower bands, and Bollinger Bands.
Alerts
The script includes alert conditions for buy and sell signals, allowing notifications to be sent via email or mobile app.
Information Panel
A small table on the chart displays current volatility dataThis Pine Script code for TradingView is a multifactor Buy/Sell indicator that combines several technical factors to generate trading signals based on trend, volatility, and volume conditions. Here’s a breakdown of the main components and functionality:
Indicator Name
- Multifactor Buy/Sell Strategy V2 — an overlay indicator applied directly on the price chart.
Input Parameters
The script includes multiple customizable parameters:
- **RSI, EMA, MACD parameters** — for setting periods and signals of MACD and RSI.
- **ATR and Bollinger Bands** — used for volatility analysis and level determination.
- **Minimum Volatility Threshold** — sets a minimum Bollinger Band width threshold for determining high volatility.
Core Indicators
1. RSI — calculated to identify oversold (below 30) and overbought (above 70) conditions.
2. EMA and MACD — calculates exponential moving averages and MACD histogram to determine trend direction.
3. ATR and Bollinger Bands — used to assess current volatility and establish dynamic upper and lower bands.
Volatility and Volume Analysis
- Determines the current ATR level and Bollinger Band width to evaluate high volatility.
- Calculates the volume moving average to track periods of increased volume during high volatility.
Trend Analysis
The script uses the difference between fast and slow EMAs to define strong trends:
- Uptrend — when the fast EMA is above the slow EMA, the price is above the fast EMA, and the trend is strong.
- Downtrend — when the fast EMA is below the slow EMA, the price is below the fast EMA, and the trend is strong.
Momentum Filter
- Based on the price change over the last three bars and compared against the minimum volatility threshold to identify strong momentum.
Buy and Sell Signal Generation
- Buy Signal: Uptrend with RSI oversold, positive MACD histogram, high volatility and volume, strong momentum, and sufficient Bollinger Band width.
- Sell Signal: Downtrend with RSI overbought, negative MACD histogram, high volatility and volume, strong momentum, and sufficient Bollinger Band width.
Visualization
- Buy and sell signals are displayed as green and red triangles on the chart.
- Plots for fast and slow EMAs, upper and lower bands, and Bollinger Bands.
Alerts
The script includes alert conditions for buy and sell signals, allowing notifications to be sent via email or mobile app.
Information Panel
A small table on the chart displays current volatility
- Volatility Status — indicates high or low volatility.
- Bollinger Band Width — current width as a percentage.
- ATR Ratio — ratio of current ATR to long-term average ATR.
This script is suitable for trading in high-volatility conditions, combining multiple filters and factors to generate precise buy and sell signals.
