Stochastic + RSI, Double Strategy (by ChartArt)This strategy combines the classic RSI strategy to sell when the RSI increases over 70 (or to buy when it falls below 30), with the classic Stochastic Slow strategy to sell when the Stochastic oscillator exceeds the value of 80 (and to buy when this value is below 20).
This simple strategy only triggers when both the RSI and the Stochastic are together in a overbought or oversold condition. The one hour chart of the S&P 500 worked quite well recently with this double strategy.
By the way this strategy should not be confused with the 'Stochastic RSI', which measures the RSI only.
All trading involves high risk; past performance is not necessarily indicative of future results.
"rsi" için komut dosyalarını ara

Mean Reversion — BB + Z-Score + RSI + EMA200 (TP at Opposite Z)This is a systematic mean-reversion framework for index futures and other liquid assets.
This strategy combines Bollinger Bands, Z-Score dislocation, RSI extremes, and a trend-filtering EMA200 to capture short-term mean-reversion inefficiencies in NQ1!. It is designed for high-volatility conditions and uses a precise exit model based on opposite-side Z-Score targets and dynamic mid-band failure detection.
🔍 Entry Logic (Mean Reversion) :
The strategy enters trades only when multiple confluence signals align:
Long Setup
Price at or below the lower Bollinger Band
Z-Score ≤ –Threshold (deep statistical deviation)
RSI ≤ oversold level
Price below the EMA-200 (countertrend mean-reversion only)
Cooldown must be completed
No open position
Short Setup
Price at or above the upper Bollinger Band
Z-Score ≥ Threshold
RSI ≥ overbought level
Price above the EMA-200
Cooldown complete
No open position
This multi-signal gate filters out weak reversions and focuses on mature dislocations.
🎯 Take-Profit Model: Opposite-Side Z-Score Target :
Once in a trade, take-profit is set by solving for the price where the Z-Score reaches the opposite side:
Long TP = Z = +Threshold
Short TP = Z = –Threshold
This creates a symmetric statistical exit based on reverting to equilibrium plus overshoot.
🛡️ Stop-Loss System (Volatility-Aware) :
Stop losses combine:
A fixed base stop (points)
A standard-deviation volatility component
This adapts the SL to regime changes and avoids being shaken out during rare volatility spikes.
⏳ Half-Life Exit :
If a trade has not reverted within a fixed number of bars, it automatically closes.
This prevents “mean-reversion traps” during trending periods.
📉 Advanced Mid-Band Exit Logic (BB Basis Failure) :
This is the unique feature of the system.
After entry:
Wait for price to cross the Bollinger Basis (middle band) in the direction of the mean.
Start a 5-bar delay timer.
After 5 bars, the strategy becomes “armed.”
Once armed:
If price fails back through the mean, exit immediately.
Intrabar exits trigger precisely (with tick-level precision if Bar Magnifier is enabled).
This protects profits and exits trades at the first sign of mean-failure.
⏱️ Cooldown System :
After each closed trade, a cooldown period prevents immediate re-entry.
This avoids clustering and improves statistical independence of trades.
🖥️ What This Strategy Is Best For :
High-volatility intraday NQ conditions
Statistical mean reversion with structured confluence
Traders who want clean, rule-based entries
Avoiding trend-day traps using EMA and half-life logic
📊 Included Visual Elements :
Bollinger Bands (Upper, Basis, Lower)
BUY/SELL markers at signal generation
Optional alerts for automated monitoring
🚀 Summary :
This is a precision mean-reversion system built around volatility bands, statistical dislocation, and price-behavior confirmation. By combining Z-Score, RSI, EMA200 filtering, and a sophisticated mid-band failure exit, this model captures high-probability reversions while avoiding the common pitfalls of naive band-touch systems.


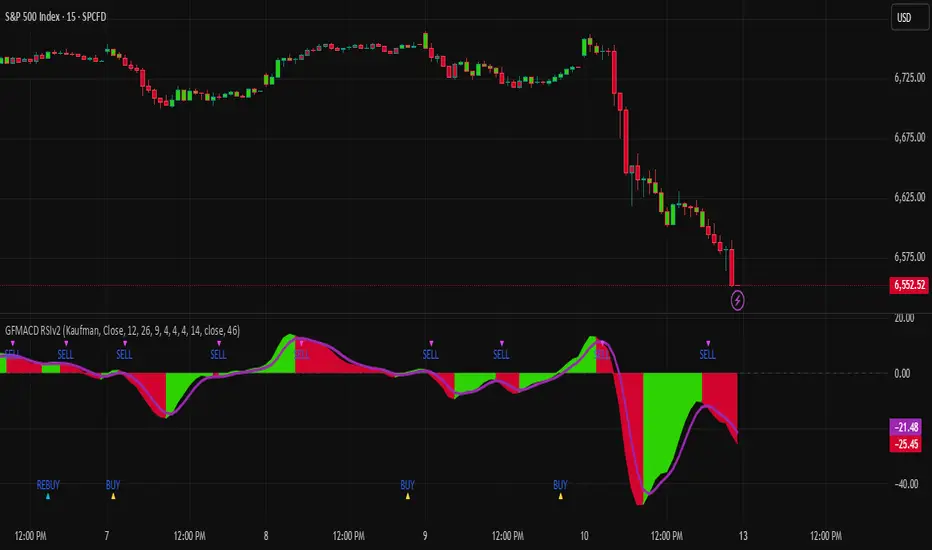
Gaussian MACD RSI v2Gaussian Filter MACD Strategy (Zero Cross + RSI Gate)
What it does
This strategy evaluates momentum using a Gaussian-smoothed MACD and requires a MACD zero-line cross to confirm trend initiation. A configurable RSI threshold filters weak signals, aiming to reduce whipsaws around the zero line. Entries occur only when momentum and baseline strength agree; exits are triggered by MACD crossing below its signal to capture the meat of the move while avoiding discretionary overrides.
How it works (concepts, not code)
Gaussian MACD: The fast/slow components are smoothed with a Gaussian-style filter to reduce noise relative to standard EMA MACD.
Zero-line confirmation: Longs require MACD to cross above zero, aligning entries with positive momentum regimes.
RSI gate: A threshold (default 50) further filters entries so that only setups with baseline strength qualify.
Exit logic: Positions close when MACD crosses below its signal line, providing an objective exit without trailing logic.
Sources: The script supports standard and Heikin-Ashi-derived sources for traders who prefer alternate preprocessing.
How to use it
Add the strategy to a clean chart.
Keep default settings for initial testing; then adjust the RSI threshold and symbol/timeframe for your market.
Favor liquid instruments where slippage and fills are reliable.
Forward-test and walk-forward before any live use.
Default Properties (used for this publication)
Initial Capital: $25,000
Order Size: 100% of equity per trade (no leverage).
Commission: 0.02% per side.
Slippage: 2 ticks (or 0.02% on percent-based markets).
Timeframe used for the published chart: 15-minute (example)
Dataset: SPY/QQQ/large-cap equities (2+ years) producing 100+ trades in sample.
Note: This strategy does not use hard stops by default. If you prefer risk caps ≤ 5–10% per trade, add a stop in the Inputs and re-publish; otherwise, this description explains the deviation per House Rules.
Disclosures
Backtest results are estimates; real-world fills, slippage, and availability may differ. No guarantee of performance. Use prudent position sizing and independent verification.
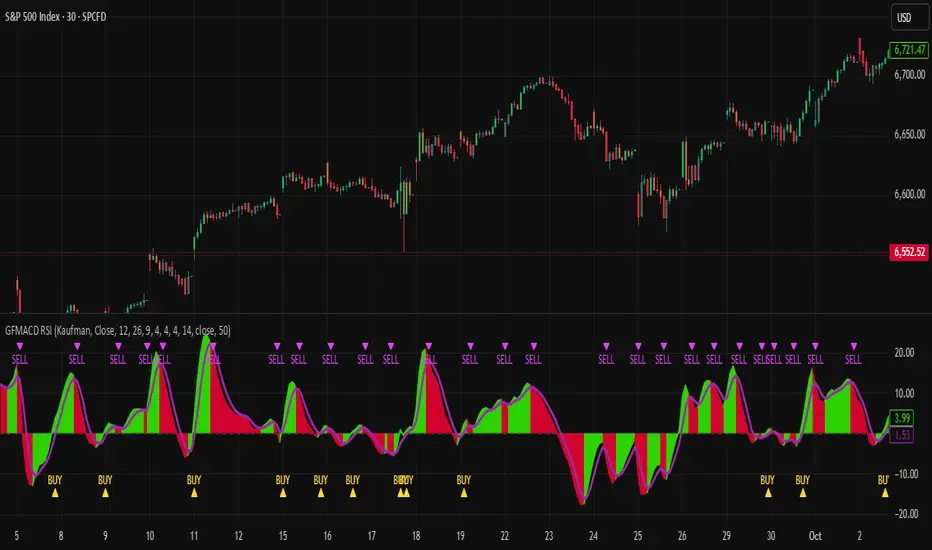
MAUL RSI Gaussian Filter MACD Gaussian Filter MACD — Strategy (with RSI Gate)
A momentum-first, chop-aware strategy built on a Gaussian-smoothed MACD with an optional RSI threshold filter. It looks for clean transitions in trend and ignores half-hearted wiggles around the zero line. You choose how signals are confirmed and whether shorts are allowed—no clutter, just deliberate entries and exits.
What it does (at a glance)
Confirms momentum using a smoothed MACD and a selectable signal mode.
Optional RSI gate to avoid low-quality breakouts.
Flexible source options (incl. Heikin-Ashi families) to match your charting style.
Long-only by default; shorts are an option.
Built-in alerts for entries/exits.
How to use
Add to chart and select your preferred signal mode.
Toggle the RSI gate and set your threshold to filter weak setups.
Forward-test across symbols/timeframes; then walk it into live with conservative sizing.
Notes
The parameters and internals are intentionally locked to protect IP and avoid over-fitting by casual copycats.
Works best on liquid symbols with consistent session structure.
Risk
Backtests are not a promise. Markets are noisy, slippage is real, and capital at risk should be sized accordingly. Use with sound risk management and a clear exit plan.
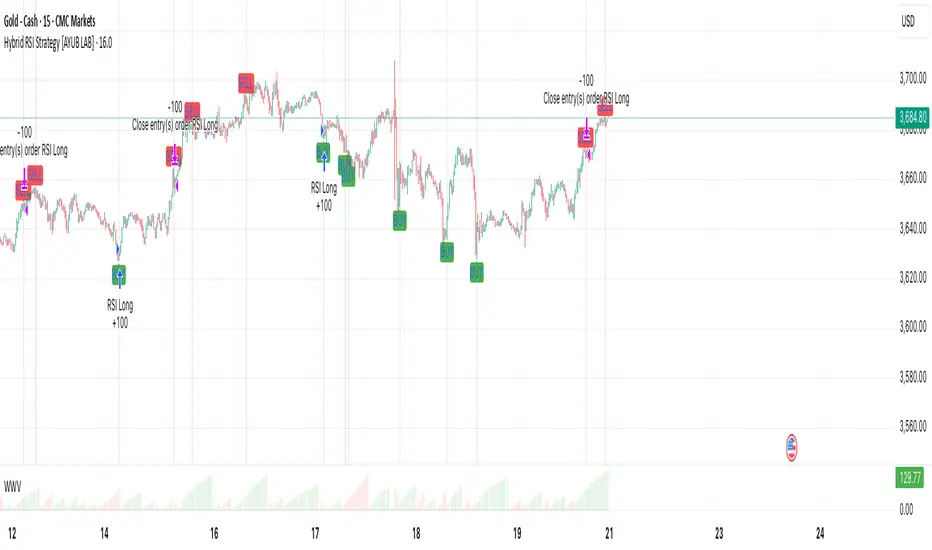
Hybrid RSI Strategy [Heifereum ]This is a hybrid script that combines visual RSI indicator signals with an optional backtestable trading strategy.
BUY Entry: When RSI crosses above the oversold level (default 30)
SELL Exit: When RSI crosses below the overbought level (default 70)
Timeframe: Works best on trending assets (crypto, forex, indices) in 5min to 1H
Backtest Toggle: Turn ON/OFF live testing using the Enable Backtest Mode? setting
Visual Cues: Buy/Sell labels, background coloring, and alerts ready for webhook automation
Use this strategy to visually explore RSI dynamics, run performance backtests, or hook up to external bots via alerts.
Maiko Range Scalper (Sideways BB + RSI) – v4 cleanPurpose
It’s a range scalping strategy for crypto. It tries to take small, repeatable trades inside a sideways market: buy near the bottom of the range, sell near the middle/top (and the reverse for shorts).
Core idea (two timeframes)
Define the trading range on a higher timeframe (HTF)
You choose the HTF (e.g., 15m or 1h).
The script finds the highest high and lowest low over a lookback window (e.g., last 96 HTF candles) → these become HTF Resistance and HTF Support.
It also calculates the midline (average of support/resistance).
Trade signals on your lower timeframe (LTF)
You run the strategy on a fast chart (e.g., 1m or 5m).
Entries are only allowed inside the HTF range.
Entry logic (mean reversion)
Indicators on the LTF:
Bollinger Bands (length & std dev configurable).
RSI (length & thresholds configurable).
Optional VWAP proximity filter (price must be within X% of VWAP).
Long setup:
Price touches/under-cuts the lower Bollinger band AND RSI ≤ threshold (default 30) AND price is inside the HTF range (and passes VWAP filter if enabled).
Short setup:
Price touches/exceeds the upper Bollinger band AND RSI ≥ threshold (default 70) AND price is inside the HTF range (and passes VWAP filter if enabled).
Exits and risk
Stop-loss: placed just outside the HTF range with a configurable buffer %:
Long SL = HTF Support × (1 − buffer).
Short SL = HTF Resistance × (1 + buffer).
Take-profit (selectable):
Mid band (the Bollinger basis) → conservative, faster exits.
Opposite band / HTF boundary → more aggressive, higher RR but more give-backs.
Position sizing
A simple cap: maximum position size = percent of account equity (e.g., 20%).
The script calculates quantity from that cap and current price.
Plots you’ll see on the chart
HTF Resistance (red) and HTF Support (green) via plot().
HTF Midline (gray dashed) drawn with a line.new() object (because plot() cannot do dashed).
Bollinger basis/upper/lower on the LTF.
Optional VWAP line (only shown if you enable the filter).
Signal markers (green triangle up for Long setups, red triangle down for Short setups).
Alerts
Two alertconditions:
“Long Setup” – when a long entry condition appears.
“Short Setup” – when a short entry condition appears.
Create alerts from these to get notified in real time.
How to use it (quick start)
Add to a 1m or 5m chart of a liquid coin (BTC, ETH, SOL).
Set HTF timeframe (start with 1h) and lookback (e.g., 96 = ~4 days on 1h).
Keep default Bollinger/RSI first; tune later.
Choose TP mode:
“Mid band” for quick scalps.
“Opposite band/Range” if the range is very clean and you want bigger targets.
Set SL buffer (0.15–0.30% is common; adjust for volatility).
Set Max position % to control size (e.g., 20%).
(Optional) Enable VWAP filter to skip stretched moves.
When it works best
Clearly sideways markets with visible support/resistance on the HTF.
High-liquidity pairs where spreads/fees are small relative to your scalp target.
Limitations & safety notes
True breakouts will invalidate mean-reversion logic—your SL outside the range is there to cut losses fast.
Fees can eat into small scalps—prefer limit orders, rebates, and liquid pairs.
Backtest results vary by exchange data; always forward-test on small size.
If you want, I can:
Add an ATR-based stop/target option.
Provide a study-only version (signals/alerts, no trading engine).
Pre-set risk to your €5,000 plan (e.g., ~0.5% max loss/trade) with calculated qty.

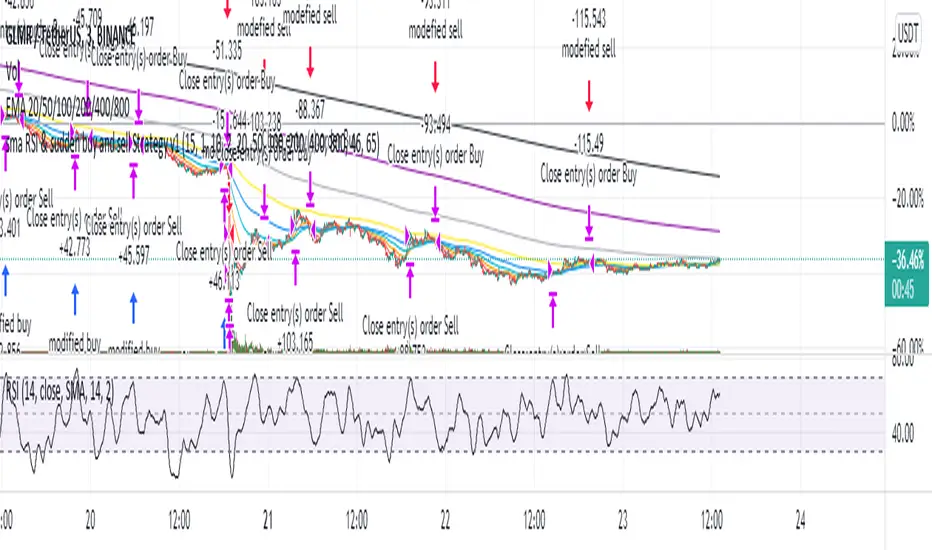
Hassi XAUUSD Advanced FVG EMA/BOS/RSI/Volume + Session FilterWhat it does :
This strategy automates a popular ICT-style idea on XAUUSD (Gold): trade only when price taps back into a Fair Value Gap (FVG), but filter entries with trend, structure, momentum, volume, and session rules. It manages risk with fixed TP/SL (points) and shows a compact backtest panel on chart.
Core Logic
1) Market Structure (BOS)
Detects recent swing highs/lows and flags a Break of Structure:
BOS Up when price breaks the latest swing high.
BOS Down when price breaks the latest swing low.
2) FVG Detection (3-candle)
Bullish FVG when low > high and low > high .
Bearish FVG when high < low and high < low .
The most recent qualifying gap is drawn as a shaded box (optional).
3) Bias & Filters
Trend Bias: price vs EMA (default 200). Longs only above EMA; shorts only below.
Momentum: optional RSI filter (default 14); avoid longs in OB & shorts in OS.
Volume: optional filter requiring current volume > SMA(20) × multiplier.
Sessions: optional London / New York (PKT) time windows.
Entries & Exits
Long Entry (all must be true)
Above EMA, RSI bullish, volume ok, session ok, BOS Up.
A recent Bullish FVG exists (within N bars).
Price taps back into the FVG (low ≤ top & close > bottom) with a bullish candle.
Short Entry (mirror)
Below EMA, RSI bearish, volume ok, session ok, BOS Down.
A recent Bearish FVG exists (within N bars).
Price taps (high ≥ bottom & close < top) with a bearish candle.
Risk / R:R
Exits use fixed points on XAUUSD (default TP 100, SL 50).
On many gold feeds 1.0 = 10 points; inputs convert to price automatically.
“One-trade-at-a-time”: a new signal won’t fire until the previous position is flat.
Chart Labels
On entry, the script plots BUY/SELL plus fixed TP/SL lines & labels anchored to the entry bar (they don’t drift with price).
Visuals & Tools
EMA line (green/red by bias).
Swing points (tiny triangles) to see structure.
FVG boxes (green/red, optional).
Session shading (subtle blue overlay).
Stats Panel (top-right):
Total Trades, TP Hits, SL Hits, Win Rate, Profit Factor, Net P&L.
Inputs (quick guide)
EMA Length (default 200)
Swing Lookback for BOS (default 5)
FVG Box Length (how far the zone extends to the right)
TP / SL (points) for XAUUSD + display Risk:Reward
Sessions (PKT): London & New York windows + toggle
Filters: Volume (multiplier), RSI (length, OB/OS)
Visibility: show/hide FVG boxes & TP/SL drawings
Alerts
Buy Signal / Sell Signal on valid entries
Position Opened / Position Closed notifications
Best Practices & Notes
Designed for XAUUSD 15-minute. You can test other timeframes, but retune TP/SL points and filters accordingly.
Broker ticks differ: if your symbol steps are not 0.1, adjust TP/SL points.
Use with a HTF confluence (e.g., D1/4H bias, key S/R, news awareness).
Backtests are approximations; real results vary with spreads, slippage, and execution.
Disclaimer: This tool is for educational purposes. It is not financial advice. Always test before using on live capital.

VWAP-RSI Scalper FINAL v1Description
This script implements a robust, battle-tested intraday scalping strategy designed for prop firm challenges, funded trader programs, and serious futures scalpers.
It combines VWAP, RSI, EMA trend, and ATR-based risk management to capture high-probability mean reversion and momentum moves during the most liquid hours of the trading day.
Core Logic
RSI (Relative Strength Index):
Trades are triggered when the RSI is either oversold or overbought using a short lookback (default: 3). This ensures only the strongest intraday reversals or exhaustion moves are considered.
VWAP Filter:
Longs are only taken above VWAP, shorts only below VWAP, aligning trades with the session’s dominant bias.
EMA Filter:
Additional trend quality filter—longs require price above EMA, shorts below EMA.
Session Control:
Only trades between user-defined session hours (default: US cash session), eliminating overnight/illiquid action.
ATR-based Dynamic Stops & Targets:
Every trade uses a stop loss at 1x ATR and a take profit at 2x ATR for a positive risk/reward ratio.
Max Trades Per Day:
Prevents overtrading and controls risk exposure (default: 3).
Performance (Sample Backtest)
Profit Factor: 1.37+ (prop-firm quality)
Drawdown: <1% (very conservative risk)
Win Rate: 37–48% (RR > 1, so high edge)
Consistency: Smooth, steady equity curve over hundreds of trades.
Best For:
ES/NQ/CL/GC intraday traders
Prop firm evaluation challenges (Tradeify, Topstep, Apex, etc.)
Anyone needing robust, no-nonsense systematic edge for futures or indices.
How to Use & Tune
Apply to 3min, 5min, or 15min charts of liquid futures or indices.
Change parameters in the settings panel to suit your asset, volatility, or session hours.
Use “Strategy Tester” to validate P&L, win rate, and drawdown.
How to Optimize
Raise/lower RSI length or bands to make signals more/less frequent.
Adjust stop/target multiples for your preferred risk/reward profile.
Change session hours to match your broker or market.
Disclaimer
This is not financial advice. Use on a demo or sim account first. Results will vary by market, slippage, and execution speed. Past performance does not guarantee future results.
If you find this useful, please give it a like, follow for more strategies, and comment your results or questions!
Good luck and safe trading!

逆勢布林+RSI策略 for SOL可以直接套用到 SOLUSDT, SOLPERP, 或其他 SOL 合約。
在策略回測介面中選擇 5min 或 15min 看策略表現。
若要調整停利%或 RSI 數值,改變 rsi < 25 與 (shortEntryPrice - close) / shortEntryPrice >= 0.035 即可。
This can be directly applied to SOLUSDT, SOLPERP, or other SOL futures.
In the strategy backtesting interface, select 5-minute or 15-minute periods to view strategy performance.
To adjust the take-profit percentage or RSI value, set RSI < 25 and (shortEntryPrice - close) / shortEntryPrice >= 0.035.

Scalping 15min: EMA + MACD + RSI + ATR-based SL/TP📈 Strategy: 15-Minute Scalping — EMA + MACD + RSI + ATR-based SL/TP
This scalping strategy is designed for 15-minute charts and combines trend-following and momentum confirmation with dynamic stop loss and take profit levels based on volatility.
🔧 Indicators Used:
EMA 50 — identifies the main trend
MACD Histogram — confirms momentum direction
RSI (14) — filters overbought/oversold conditions
ATR (14) — dynamically sets SL and TP based on market volatility
📊 Entry Conditions:
Long Entry:
Price is above EMA 50
MACD histogram is positive
RSI is above 50 but below 70
Short Entry:
Price is below EMA 50
MACD histogram is negative
RSI is below 50 but above 30
🛑 Risk Management:
Stop Loss: 1×ATR (user-configurable)
Take Profit: 2×ATR (user-configurable)
These values can be adjusted in the script inputs depending on your risk/reward preference or market conditions.
⚠️ Notes:
Strategy is optimized for scalping fast-moving pairs (e.g. crypto, forex).
Works best in trending markets.
Use backtesting and forward testing before live trading.

DCA, Support and Resistance with RSI and Trend FilterThis script is based on
script from Kieranj with added pyramiding and DCA
The buy condition (buyCondition) is triggered when the RSI crosses above the oversold threshold (ta.crossover(rsi, oversoldThreshold)), the trend filter confirms an uptrend (isUptrend is true), and the close price is greater than or equal to the support level (close >= supportLevel).
The partial sell condition (sellCondition) is triggered when the RSI crosses below the overbought threshold (ta.crossunder(rsi, overboughtThreshold)) and profit goal is reached, the trend filter confirms a downtrend (isUptrend is false), and the close price is less than or equal to the resistance level (close <= resistanceLevel).
Full sell will be triggered if trend is broken and profit goal is reached
With this implementation, the signals will only be generated in the direction of the trend on the 4-hour timeframe. The trend is considered up when the 50-period SMA is below the 200-period SMA (ta.sma(trendFilterSource, 50) < ta.sma(trendFilterSource, 200)).
Pyramiding should be activated, values like 100, so every DCA step should be around 1%
i have best results on 5 min charts
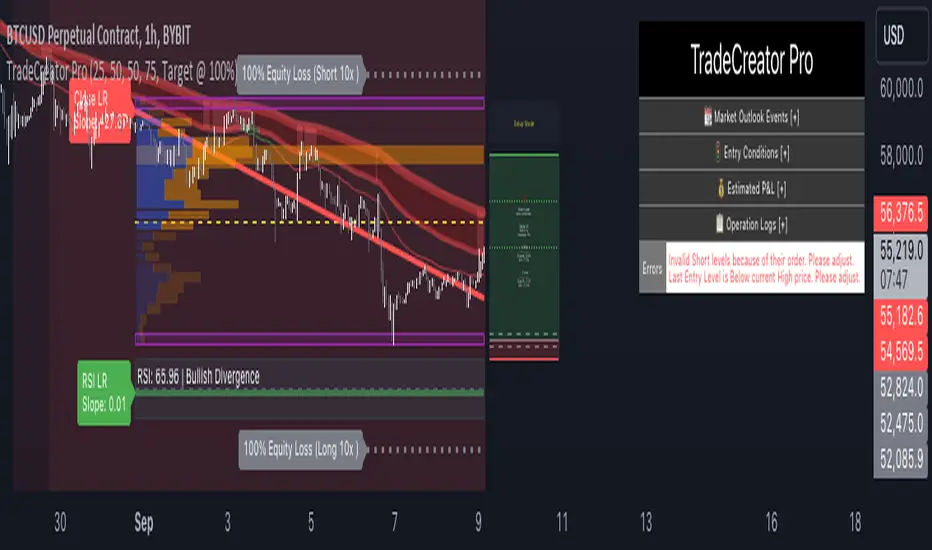
TradeCreator Pro - Moving Averages, RSI, Volume, Trends, Levels█ Overview
TradeCreator Pro is designed to help you build successful trades by streamlining the processes of trade planning, evaluation, and execution. With a focus on data accuracy, speed, precision, and ease of use, this all-in-one tool assists in identifying optimal entry and exit points, calculating risk/reward ratios, and executing trades efficiently. Whether you’re a beginner or an experienced trader, TradeCreator Pro empowers you to make informed, data-driven decisions with real-time signals and fully customizable settings.
█ Key Benefits & Use Cases
TradeCreator Pro is designed to help you effortlessly discover profitable trades by evaluating and testing multiple setups across different assets and timeframes. Key use cases include:
Quick Strategy Testing: Rapidly test multiple setups and strategies, gaining immediate insights into their potential outcomes.
Risk/Reward Evaluation: Quickly identify which trade ideas are worth pursuing based on their profitability and associated risk.
Multi-Timeframe Testing: Seamlessly test the same trading setup across various timeframes and tickers.
Backtesting: Analyze the historical performance of specific setups to gauge their effectiveness.
Key Level Identification: Instantly spot critical support and resistance levels, improving your decision-making process.
Custom Alerts: Set personalized notifications for key levels, ensuring timely action on potential trade opportunities.
█ Core Features
Dashboard: A real-time view of critical metrics such as trend strength, support/resistance levels, volume profiles, RSI divergence, and trade scoring. Designed to provide a comprehensive snapshot of your trading environment and potential trading outcome.
Trend Analysis: Detect prevailing trends by analyzing multiple moving averages, support/resistance zones, volume profile and linear regressions for RSI and closing prices.
Support & Resistance Identification: Automatically identify support and resistance levels.
Volume Profile: Visualize volume profile and its point of control across support/resistance ranges, helping you spot key consolidation areas.
RSI & Price Divergence Detection: Identify potential divergences between RSI and price through linear regressions, providing valuable trade signals.
Risk Management Tools: Set equity loss levels based on specified leverage, allowing you to manage risk effectively for both long and short trades.
Entry & Exit Recommendations: Identify multiple options for optimal entry and exit levels based on current market conditions.
Trade Scoring: Score each trade setup on a 0-100 scale, factoring in potential ROI, ROE, P&L, and Risk-Reward Ratios to ensure high-quality trade execution.
Dynamic Execution & Monitoring: Benefit from multi-stage exit strategies, dynamic trailing stop losses, and the ability to backtest setups with historical data.
Alerts & Automation: Customize alerts for key market movements and opt for manual or automated trading through TradingView’s supported partners.
█ How to Use
Installation: Add TradeCreator Pro to your TradingView chart.
Trend Adjustment: The system automatically detects the current market trend, but you can fine-tune all trend detection parameters as needed.
Trading Parameter Configuration: Customize entry, exit, profitability, and risk-reward settings to match your trading style.
Entry and Exit Level Refinement: Use the automated suggestions, or choose from conceptual or arbitrary levels for greater control.
Stop Loss and Profit Target Fine-Tuning: Apply the system’s recommendations or adjust them by selecting from multiple available options.
Backtest Setup: Run the backtester to analyze past performance and assess how the strategy would have performed historically.
Set Alerts: Stay informed by setting alerts to notify you when a trade setup is triggered.
█ Notes
The first time you apply the indicator to a chart, it may take a few moments to compile. If it takes too long, switch timeframes temporarily to restart the process.
█ Risk Disclaimer
Trading in financial markets involves significant risk and is not suitable for all investors. The use of TradeCreator Pro, as well as any other tools provided by AlgoTrader Pro, is purely for informational and educational purposes. These tools are not intended to provide financial advice, and past performance is not indicative of future results. It is essential to do your own research, practice proper risk management, and consult with a licensed financial advisor before making any trading decisions. AlgoTrader Pro is not responsible for any financial losses you may incur through the use of these tools.
Trend Deviation strategy - BTC [IkkeOmar]Intro:
This is an example if anyone needs a push to get started with making strategies in pine script. This is an example on BTC, obviously it isn't a good strategy, and I wouldn't share my own good strategies because of alpha decay.
This strategy integrates several technical indicators to determine market trends and potential trade setups. These indicators include:
Directional Movement Index (DMI)
Bollinger Bands (BB)
Schaff Trend Cycle (STC)
Moving Average Convergence Divergence (MACD)
Momentum Indicator
Aroon Indicator
Supertrend Indicator
Relative Strength Index (RSI)
Exponential Moving Average (EMA)
Volume Weighted Average Price (VWAP)
It's crucial for you guys to understand the strengths and weaknesses of each indicator and identify synergies between them to improve the strategy's effectiveness.
Indicator Settings:
DMI (Directional Movement Index):
Length: This parameter determines the number of bars used in calculating the DMI. A higher length may provide smoother results but might lag behind the actual price action.
Bollinger Bands:
Length: This parameter specifies the number of bars used to calculate the moving average for the Bollinger Bands. A longer length results in a smoother average but might lag behind the price action.
Multiplier: The multiplier determines the width of the Bollinger Bands. It scales the standard deviation of the price data. A higher multiplier leads to wider bands, indicating increased volatility, while a lower multiplier results in narrower bands, suggesting decreased volatility.
Schaff Trend Cycle (STC):
Length: This parameter defines the length of the STC calculation. A longer length may result in smoother but slower-moving signals.
Fast Length: Specifies the length of the fast moving average component in the STC calculation.
Slow Length: Specifies the length of the slow moving average component in the STC calculation.
MACD (Moving Average Convergence Divergence):
Fast Length: Determines the number of bars used to calculate the fast EMA (Exponential Moving Average) in the MACD.
Slow Length: Specifies the number of bars used to calculate the slow EMA in the MACD.
Signal Length: Defines the number of bars used to calculate the signal line, which is typically an EMA of the MACD line.
Momentum Indicator:
Length: This parameter sets the number of bars over which momentum is calculated. A longer length may provide smoother momentum readings but might lag behind significant price changes.
Aroon Indicator:
Length: Specifies the number of bars over which the Aroon indicator calculates its values. A longer length may result in smoother Aroon readings but might lag behind significant market movements.
Supertrend Indicator:
Trendline Length: Determines the length of the period used in the Supertrend calculation. A longer length results in a smoother trendline but might lag behind recent price changes.
Trendline Factor: Specifies the multiplier used in calculating the trendline. It affects the sensitivity of the indicator to price changes.
RSI (Relative Strength Index):
Length: This parameter sets the number of bars over which RSI calculates its values. A longer length may result in smoother RSI readings but might lag behind significant price changes.
EMA (Exponential Moving Average):
Fast EMA: Specifies the number of bars used to calculate the fast EMA. A shorter period results in a more responsive EMA to recent price changes.
Slow EMA: Determines the number of bars used to calculate the slow EMA. A longer period results in a smoother EMA but might lag behind recent price changes.
VWAP (Volume Weighted Average Price):
Default settings are typically used for VWAP calculations, which consider the volume traded at each price level over a specific period. This indicator provides insights into the average price weighted by trading volume.
backtest range and rules:
You can specify the start date for backtesting purposes.
You can can select the desired trade direction: Long, Short, or Both.
Entry and Exit Conditions:
LONG:
DMI Cross Up: The Directional Movement Index (DMI) indicates a bullish trend when the positive directional movement (+DI) crosses above the negative directional movement (-DI).
Bollinger Bands (BB): The price is below the upper Bollinger Band, indicating a potential reversal from the upper band.
Momentum Indicator: Momentum is positive, suggesting increasing buying pressure.
MACD (Moving Average Convergence Divergence): The MACD line is above the signal line, indicating bullish momentum.
Supertrend Indicator: The Supertrend indicator signals an uptrend.
Schaff Trend Cycle (STC): The STC indicates a bullish trend.
Aroon Indicator: The Aroon indicator signals a bullish trend or crossover.
When all these conditions are met simultaneously, the strategy considers it a favorable opportunity to enter a long trade.
SHORT:
DMI Cross Down: The Directional Movement Index (DMI) indicates a bearish trend when the negative directional movement (-DI) crosses above the positive directional movement (+DI).
Bollinger Bands (BB): The price is above the lower Bollinger Band, suggesting a potential reversal from the lower band.
Momentum Indicator: Momentum is negative, indicating increasing selling pressure.
MACD (Moving Average Convergence Divergence): The MACD line is below the signal line, signaling bearish momentum.
Supertrend Indicator: The Supertrend indicator signals a downtrend.
Schaff Trend Cycle (STC): The STC indicates a bearish trend.
Aroon Indicator: The Aroon indicator signals a bearish trend or crossover.
When all these conditions align, the strategy considers it an opportune moment to enter a short trade.
Disclaimer:
THIS ISN'T AN OPTIMAL STRATEGY AT ALL! It was just an old project from when I started learning pine script!
The backtest doesn't promise the same results in the future, always do both in-sample and out-of-sample testing when backtesting a strategy. And make sure you forward test it as well before implementing it!
Furthermore this strategy uses both trend and mean-reversion systems, that is usually a no-go if you want to build robust trend systems .
Don't hesitate to comment if you have any questions or if you have some good notes for a beginner.

Megabar Breakout (Range & Volume & RSI)Hey there,
This strategy is based on the idea that certain events lead to what are called Megabars. Megabars are bars that have a very large range and volume. I wanted to verify whether these bars indicate the start of a trend and whether one should follow the trend.
Summary of the Code:
The code is based on three indicators: the range of the bar, the volume of the bar, and the RSI. When certain values of these indicators are met, a Megabar is identified. The direction of the Megabar indicates the direction in which we should trade.
Why do I combine these indicators?
I want to identify special bars that have the potential to mark the beginning of a breakout. Therefore, a bar needs to exhibit high volume, have a large range (huge price movement), and we also use the Relative Strength Index (RSI) to assess potential momentum. Only if all three criteria are met within one candle, do we use this as an identifier for a megabar.
Explanation of Drawings on the Chart:
As you can see, there is a green background on my chart. The green background symbolizes the time when I'm entering a trade. Only if a Megabar happens during that time, I'm ready to enter a trade. The time is between 6 AM and 4 PM CET. It's just because I prefer that time. Also, the strategy draws an error every time a Megabar happens based on VOL and Range only (not on the RSI). That makes it pretty easy to go through your chart and check the biggest bars manually. You can activate or deactivate these settings via the input data of the strategy.
When Do We Enter a Trade?
We wait for a Megabar to happen during our trading session. If the Megabar is bullish, we open a LONG trade at the opening price of the next candle. If the Megabar is bearish, we open a SHORT trade at the opening price of the next candle.
Where Do We Put Our Take Profit & Stop Loss?
The default setting is TP = 40 Pips and SL = 30 Pips. In that case, we are always trading with a risk-reward ratio of 1.33 by default. You can easily change these settings via the input data of the strategy.
Strategy Results
The criteria for Megabars were chosen by me in a way that makes Megabars something special. They are not intended to occur too frequently, as the fundamental idea of this strategy would otherwise not hold. This results in only 37 closed trades within the last 12 months. If you change the criterias for a megabar to a milder one, you will create more Megabars and therefore more trades. It's up to you. I have adapted this strategy to the 30-minute chart of the EURUSD. In the evaluation, we consider a period of 12 months, which I believe is sufficient.
My default settings for the indicators look like this:
Avg Length Vol 20
Avg Multiplier Vol 3
Avg Length Range 20
Avg Multiplier Range 4
Value SMA RSI for Long Trades 50
Value SMA RSI for Short Trades 70
IMPORTANT: The current performance overview does not display the results of these settings. Please change the settings to my default ones so that you can see how I use this strategy.
I do not recommend trading this strategy without further testing. The script is meant to reflect a basic idea and be used as a tool to identify Megabars. I have made this strategy completely public so that it can be further developed. One can take this framework and test it on different timeframes and different markets.

FTR, WMA, OBV & RSI StrategyThis Pine Script code is a trading strategy that uses several indicators such as Fisher Transform (FTR), On-Balance Volume (OBV), Relative Strength Index (RSI), and a Weighted Moving Average (WMA). The strategy generates buy and sell signals based on the conditions of these indicators.
The Fisher Transform function is a technical indicator that uses past prices to determine whether the current market is bullish or bearish. The Fisher Transform function takes in four multipliers and a length parameter. The four multipliers are used to calculate four Fisher Transform values, and these values are used in combination to determine if the market is bullish or bearish.
The Weighted Moving Average (WMA) is a technical indicator that smooths out the price data by giving more weight to the most recent prices.
The Relative Strength Index (RSI) is a momentum indicator that measures the strength of a security's price action. The RSI ranges from 0 to 100 and is typically used to identify overbought or oversold conditions in the market.
The On-Balance Volume (OBV) is a technical indicator that uses volume to predict changes in the stock price. OBV values are calculated by adding volume on up days and subtracting volume on down days.
The strategy uses the Fisher Transform values to generate buy and sell signals when all four Fisher Transform values change color. It also uses the WMA to determine if the trend is bullish or bearish, the OBV to confirm the trend, and the RSI to filter out false signals.
The red and green triangular arrows attempt to indicate that the trend is bullish or bearish and should not be traded against in the opposite direction. This helps with my FOMO :)
All comments welcome!
The script should not be relied upon alone, there are no stop loss or take profit filters. The best results have been back-tested using Tradingview on the 45m - 3 hour timeframes.

Soheil PKO's 5 min Hitman Scalp - 3MA + Laguerre RSI + ADX [Pt]Someone sent me this strategy found on YouTube. It is Soheil PKO's "The Best and Most Profitable Scalping Strategy" Best way to find out is to code it =)
This strategy uses Moving Average Ribbon, Laguerre RSI, and ADX. This script only displays the MA ribbon, you will need to add Laguerre RSI and ADX separately.
Long Entry Criteria:
- 16 EMA > 48 EMA > 200 SMA
- Laguerre RSI > 80
- ADX > 20
Long Exit Criterion:
- 16 EMA < 48 EMA
Short Entry Criteria:
- 16 EMA < 48 EMA < 200 SMA
- Laguerre RSI < 20
- ADX > 20
Short Exit Criterion:
- 16 EMA > 48 EMA
As mentioned in the video, risk management is very important, especially for scalping strategies. Therefore, I've added option for setting Stop Loss and Price Target in the options for you guys to play with.
All parameters are configurable.
Enjoy~~

volume rsi strategy by pro trader123this strategy includes volume and rsi and plots a buy signal when rsi is below 30 with high average volume and takes profit when the rsi 14 ema crosses rsi

Short Term RSI and SMA Percentage ChangeThis strategy utilises common indicators like RSI and moving averages in order to enter and exit trades. The Relative Strength Index (RSI) is a momentum indicator that has a value between 0 and 100, where a value greater than 70 is considered overbought and a value less than 30 is oversold. If the RSI value is above or below these values, then it can signal a possible trend reversal.
The second indicator used in this strategy is the Simple Moving Average (SMA). A SMA is an arithmetic moving average calculated by adding recent prices and then dividing that figure by the number of time periods in the calculation average. For example, one could add the closing price of a coin for a number of time periods and then divide this total by that same number of periods. Short-term averages respond quickly to changes in the price of the underlying coin, while long-term averages are slower to react.
Long/Exit orders are placed when three basic signals are triggered.
Long Position:
RSI is greater than 50
MA9 is greater than MA100
MA9 increases by 6%
Exit Position:
Price increases 5% trailing
Price decreases 5% trailing
The script is backtested from 1 May 2022 and provides good returns.
A trading fee of 0.1% is also taken into account and is aligned to the base fee applied on Binance.
This script also works well on AVAX 45m/1h, MATIC 15m/45m/1h and ETH 4h.

Oversold RSI with tight SL Strategy (by Coinrule)This is one of the best strategies that can be used to get familiar with technical indicators and start to include them in your trading bot rules.
ENTRY
1. This trading system uses the RSI ( Relative Strength Index ) to anticipate good points to enter positions. RSI is a technical indicator frequently used in trading. It works by measuring the speed and change of price movements to determine whether a coin is oversold (indicating a good entry point) or overbought (indicating a point of exit/entry for a short position). The RSI oscillates between 0 and 100 and is traditionally considered overbought when over 70 and oversold when below 30.
2. To pick the right moment to buy, the strategy enters a trade when the RSI falls below 30 indicating the coin is oversold and primed for a trend reversal.
EXIT
The strategy then exits the position when the price appreciates 7% from the point of entry. The position also maintains a tight stop-loss and closes the position if the price depreciates 1% from the entry price. The idea behind this is to cut your losing trades fast and let your winners ride.
The best time frame for this strategy based on our backtesting data is the daily. Shorter time frames can also work well on certain coins, however in our experience, the daily works best. Feel free to experiment with this script and test it on a variety of your coins! With our backtesting data a trading fee of 0.1% is taken into account. The fee is aligned to the base fee applied on Binance, which is the largest cryptocurrency exchange by volume. In the example shown, this strategy made a handsome net profit of 39.31% on Chainlink with 61.54% of trades being profitable.

Big Snapper Alerts R3.0 + Chaiking Volatility condition + TP RSI//@version=5
//
// Bannos
// #NotTradingAdvice #DYOR
// Disclaimer.
// I AM NOT A FINANCIAL ADVISOR.
// THESE IDEAS ARE NOT ADVICE AND ARE FOR EDUCATION PURPOSES ONLY.
// ALWAYS DO YOUR OWN RESEARCH
//
// Author: Adaptation from JustUncleL Big Snapper by Bannos
// Date: May-2022
// Version: R1.0
//Description of this addon - Script using several new conditions to give Long/short and SL levels which was not proposed in the Big Snapper strategy "Big Snapper Alerts R3.0"
//"
//This strategy is based on the use of the Big Snapper outputs from the JustUncleL script and the addition of several conditions to define filtered conditions selecting signal synchrones with a trend and a rise of the volatility.
//Also the strategy proposes to define proportional stop losses and dynamic Take profit using an RSI strategy.
// After delivering the temporary ong/short signal and ploting a green or purple signal, several conditions are defined to consider a Signal is Long or short.
//Let s take the long signal as example(this is the same process with the opposite values for a short).
//step 1 - Long Definition:
// Snapper long signal stored in the buffer variable Longbuffer to say that in a close future, we could have all conditions for a long
// Now we need some conditions to combine with it:
//the second one is to be over the Ma_medium(55)
//and because this is not selective enough, the third one is a Volatility indicator "Chaikin Volatility" indicator giving an indication about the volatility of the price compared to the 10 last values
// -> Using the volatility indicator gives the possibility to increase the potential rise if the volatility is higher compared to the last periods.
//With these 3 signals, we get a robust indication about a potential long signal which is then stored in the variable "Longe"
//Now we have a long signal and can give a long signal with its Stop Loss
// The Long Signal is automatically given as the 3 conditions above are satisfied.
// The Stop loss is a function of the last Candle sizes giving a stop below the 70% of the overall candle which can be assimilated to a Fibonacci level. Below this level it makes sense to stop the trade as the chance to recover the complete Candle is more than 60%
//Now we are in an open Long and can use all the mentioned Stop loss condition but still need a Take Profit condition
//The take profit condition is based on a RSI strategy consisting in taking profit as soon as the RSI come back from the overbought area (which is here defined as a rsi over 70) and reaching the 63.5 level to trigger the Take Profit
//This TP condition is only active when Long is active and when an entry value as been defined.
//Entry and SL level appreas as soon as a Long or short arrow signal does appears. The Take profit will be conidtioned to the RSI.
//The final step in the cycle is a reinitialization of all the values giving the possibility to detect and treat any long new signal coming from the Big Snapper signal.

Oversold RSI with Tight Stop-Loss Strategy (by Coinrule)KRAKEN:LINKUSD
This is one of the best strategies that can be used to get familiar with technical indicators and start to include them in your rules on Coinrule .
ENTRY
1. This trading system uses the RSI (Relative Strength Index) to anticipate good points to enter positions. RSI is a technical indicator frequently used in trading. It works by measuring the speed and change of price movements to determine whether a coin is oversold (indicating a good entry point) or overbought (indicating a point of exit/entry for a short position). The RSI oscillates between 0 and 100 and is traditionally considered overbought when over 70 and oversold when below 30.
2. To pick the right moment to buy, the strategy enters a trade when the RSI falls below 30 indicating the coin is oversold and primed for a trend reversal.
EXIT
The strategy then exits the position when the price appreciates 7% from the point of entry. The position also maintains a tight stop-loss and closes the position if the price depreciates 1% from the entry price. The idea behind this is to cut your losing trades fast and let your winners ride.
The best time frame for this strategy based on our back testing data is the daily. Shorter time frames can also work well on certain coins, however in our experience, the daily works best. Feel free to experiment with this script and test it on a variety of your coins! With our back testing data a trading fee of 0.1% is taken into account. The fee is aligned to the base fee applied on Binance, which is the largest cryptocurrency exchange by volume. In the example shown, this strategy made a handsome net profit of 52.6% on Chainlink with 66.67% of trades being profitable.
You can execute this strategy on your favorite exchanges with Coinrule .

sma RSI & sudden buy and sell Strategy v1This strategy uses mostly three things:-
1. average RSI (sma rsi over a period)
2. sudden buy and sudden sell (usually to infer the change in trend or direction)
3. various EMAs ( used as a filter)
I mostly build it to work on a 3min crypto chart but it should work on any timeframe or any symbol.
Settings - Length -RSI length (hardly needed to be changed but sometimes it doubles the net profit)(+/-2)
instant length - a sudden increase or decrease in the price calculated by the length of RSI (+/-10)
Bars - No of candles to verify before starting /closing the strategy (+/-20)
Lookbackno2 - another variable to verify ema opening/closing (hardly needed to change)
emas - values of different EMAs (you can change if you want but I don't recommend it though)
over40 and over60 - the value of overbuying and overselling(+/-10)
In future, I will probably add ADX or use machine learning to filter out results
It works well considering 0.05% commission per entry and exit (total of 1% per trade)
you can message me for any query or suggestions.