CVD Divergence Indicator.1.mmAs a member of the K1m6a Lions discussion community we often use versions of the Cumulative Volume Delta indicator
as one of our primary tools along with RSI, RSI Divergences, Open interest, Volume Profile, TPO and Fibonacci levels.
We also discuss visual interpretations of CVD Divergences across multiple time frames much like RSI divergences.
RSI Divergences can be identified as possible Bullish reversal areas when the RSI is making higher low points while
the price is making lower low points.
RSI Divergences can be identified as possible Bearish reversal areas when the RSI is making lower high points while
the price is making higher high points.
CVD Divergences can also be identified the same way on any timeframe as possible reversal signals. As with RSI, these Divergences
often occur as a trend's momentum is giving way to lower volume and areas when profits are being taken signaling a possible reversal
of the current trending price movement.
Hidden Divergences are identified as calculations that may be signaling a continuation of the current trend.
Having not found any public domain versions of a CVD Divergence indicator I have combined some public code to create this
indicator and matching strategy. The calculations for the Cumulative Volume Delta keep a running total for the differences between
the positive changes in volume in relation to the negative changes in volume. A relative upward spike in CVD is created when
there is a large increase in buying vs a low amount of selling. A relative downward spike in CVD is created when
there is a large increase in selling vs a low amount of buying.
In the settings menu, the is a drop down to be used to view the results in alternate timeframes while the chart remains on current timeframe. The Lookback settings can be adjusted so that the divs show on a more local, spontaneous level if set at 1,1,60,1. For a deeper, wider view of the divs, they can be set higher like 7,7,60,7. Adjust them all to suit your view of the divs.
To create this indicator/strategy I used a portion of the code from "Cumulative Volume Delta" by @ contrerae which calculates
the CVD from aggregate volume of many top exchanges and plots the continuous changes on a non-overlay indicator.
For the identification and plotting of the Divergences, I used similar code from the Tradingview Technical "RSI Divergence Indicator"
This indicator should not be used as a stand-alone but as an additional tool to help identify Bullish and Bearish Divergences and
also Bullish and Bearish Hidden Divergences which, as opposed to regular divergences, may indicate a continuation.
Komut dosyalarını "rsi divergence" için ara

Divergence RSI V2This indicator is based on the concept of divergence. I recommend that you find out and study about this yourself as the concept of divergence will not be explained in depth in this description.
This indicator will show divergences between the asset price and the RSI oscillator. The indicator will look for divergent points between the rising highs and falling lows of the asset; and the rising lows and falling highs of the RSI.
The trend of the asset tends to follow the behavior of the oscillator when a divergence occurs. So if we find a divergence between the two, the price of the asset is likely to follow the trend of the oscillator.
This indicator looks for these types of divergences and will show (based on the RSI) if there is a bullish or bearish divergence.
If it is bullish, it will show a line joining those points in green and if it is bearish in red. In addition, it will show a label where you can see the number of occurrences that have been found from a certain point to another.
Note: this indicator can be complemented with the “Divergence V2” indicator which is also found in my library.
Settings
Backtesting Bars : is the number of bars back that the indicator will check. No more than 1000 is recommended as this will slow down the search.
Tolerance: number of times a divergent line can cross a bar. If you place 0, no bar can be crossed by a diverging line.
Min Bars To detect: will only search for divergences (or lines) that have the minimum number of bars selected in this option. Default option is 30.
Min Bars To detect: it will only search for divergences (or lines) that have the maximum number of bars selected in this option. Default option is 100.
Source Highs: The high points will be based on the close of each bar. You can use as another alternative.
Source Lows: The low points will be based on the close of each bar. You can use as another alternative.
Use squeeze parameter: only look for divergences (bullish or bearish) at times when such an indicator is in favor of the trend or coincides with the corresponding RSI divergence.
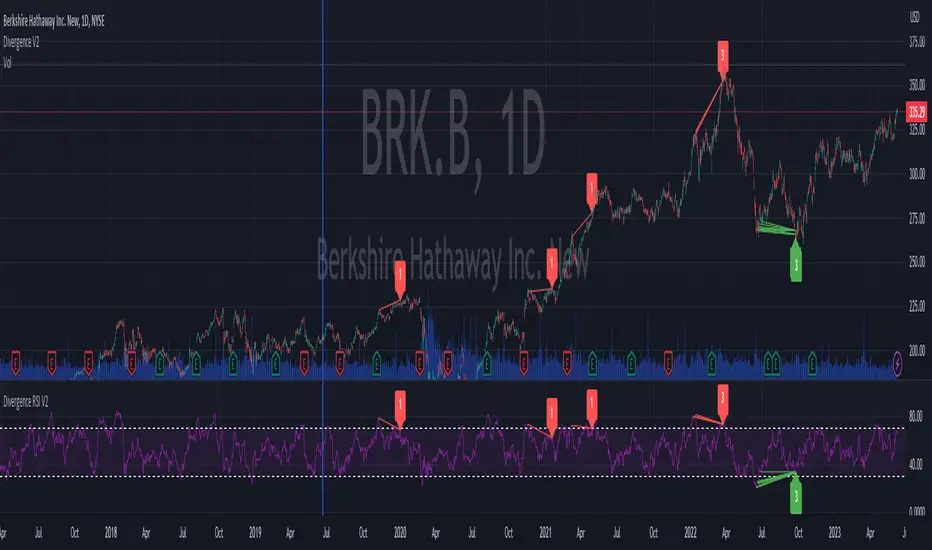
Divergence V2This indicator is based on the concept of divergence. I recommend that you find out and study about this yourself as the concept of divergence will not be explained in depth in this description.
This indicator will show divergences between the asset price and the RSI oscillator. The indicator will look for divergent points between the rising highs and falling lows of the asset; and the rising lows and falling highs of the RSI.
The trend of the asset tends to follow the behavior of the oscillator when a divergence occurs. So if we find a divergence between the two, the price of the asset is likely to follow the trend of the oscillator.
This indicator looks for these types of divergences and will show (based on the RSI) if there is a bullish or bearish divergence.
If it is bullish, it will show a line joining those points in green and if it is bearish in red. In addition, it will show a label where you can see the number of occurrences that have been found from a certain point to another.
Note: this indicator can be complemented with the “Divergence RSI V2” indicator which is also found in my library.
Settings
Backtesting Bars: is the number of bars back that the indicator will check. No more than 1000 is recommended as this will slow down the search.
Tolerance: number of times a divergent line can cross a bar. If you place 0, no bar can be crossed by a diverging line.
Min Bars To detect: will only search for divergences (or lines) that have the minimum number of bars selected in this option. Default option is 30.
Min Bars To detect: it will only search for divergences (or lines) that have the maximum number of bars selected in this option. Default option is 100.
Source Highs: The high points will be based on the close of each bar. You can use as another alternative.
Source Lows: The low points will be based on the close of each bar. You can use as another alternative.
Use squeeze parameter : only look for divergences (bullish or bearish) at times when such an indicator is in favor of the trend or coincides with the corresponding RSI divergence.

RSI 11 IndicatorThis script explains how RSI can be used to catch market moves in trend, reversal or sideways market.
What is RSI indicator:-
RSI is a momentum oscillator which measures the speed and change of price movements. RSI moves up and down (oscillates) between ZERO and 100. Generally RSI above 70 is considered overbought and below 30 is considered oversold. Some traders may use a setting of 20 and 80 for oversold and overbought conditions respectively. However this may reduce the number of signals. You can also use RSI to identify divergences, strength, reversals, general trend etc.
Calculation:-
There are three basic components in the RSI - Avg Gain, Avg Loss & RS.
Avg Gain = Average of Upward Price Change
Avg Loss = Average of Downward Price Change
RS = (Avg Gain)/(Avg Loss)
RSI = 100 – (100 / (1 +RS ))
First Calculation:-
RSI calculation is based on default 14 periods.
Average gain and Average loss are simple 14 period averages.
Average Loss equals the sum of the losses divided by 14 for the first calculation.
Average Gain equals the sum of the Gains divided by 14 for the first calculation.
First Average Gain = Sum of Gains over the past 14 periods / 14.
First Average Loss = Sum of Losses over the past 14 periods / 14.
The formula uses a positive value for the average loss.
RS values are smoothed after the first calculation.
Second Calculation:-
Subsequent calculations multiply the prior value by 13, add the most recent value, and divide the total by 14.
Average Gain = / 14.
Average Loss = / 14.
if
Average Loss = 0, RSI = 100 (means there were no losses to measure).
Average Gain = 0, RSI = 0 (means there were no gains to measure).
Logic of this indicator:-
RSI is an oscillator that fluctuates between zero and 100 which makes it easy to use for many traders.
Its easy to identify extremes because RSI is range-bound.
But remember that RSI works best in range bound market and is less trustworthy in trending markets.
A new trader need to be cautious because during strong trends in the market/security, RSI may remain in overbought or oversold for extended periods.
Chart Timeframe:-
RSI indicator works well on all timeframes.
Timeframe depends on which strategy or settings are you using.
Generally a lower timeframe like 1 min, 3 min, 5 min, 15 min, 30 min, 1 Hr etc is used for intraday trades or short duration trades
and higher timeframes like 1 day, 1 week, 1 month are used for positional or long term trades.
Please Read the Idea "Mastering RSI with 11 Strategies" to understand this indicator better.
Indicator 1
Basis Strategy of Overbought and Oversold
Usually an asset with RSI reading of 70 or above indicates a bullish and an overbought situation.
overbought can be seen as trading at a higher price than it should.
traders may expect a price correction or trend reversal and sell the security.
but RSI indicator can stay in the overbought for a long time when the stock is in uptrend - This may trap an immature trader.
an Immature trader will enter a sell position when RSI become overbought (70), whereas a mature trader will enter sell position when RSI line crosses below the overbought line (70).
An asset with RSI reading of 30 or below indicates a bearish and an oversold condition.
oversold can be seen as trading at a lower price than it should.
traders may expect a price correction or trend reversal and buy the security.
but RSI indicator can stay in the oversold for a long time when the stock is in downtrend - This may trap an immature trader.
an Immature trader will enter a buy position when RSI become oversold (30), whereas a mature trader will enter buy position when RSI line crosses above the oversold line (30).
Center dotted Mid line is RSI 50.
Chart RSI is shown in yellow colour.
Red shaded area above the red horizontal line shows the stock or security has entered overbought condition. "R" signal in red shows a likely downside reversal, means it may be a likely Selling opportunity.
Green shaded area below the green horizontal line shows the stock or security has entered oversold condition. "R" signal in green shows a likely upside reversal, means it may be a likely Buying opportunity.
Note:-
so its better to wait for reversal signal.
traders may use 20 instead of 30 as oversold level and 80 instead of 70 as overbought level.
new traders may learn to use the indicator as per the prevailing trend to get better results.
false signals may be avoided by using bullish signals in bullish trend and bearish signals in bearish trend.
Indicator 2
RSI Strength Crossing 50
RSI crossing centreline 50 in the below chart showing strength and buy/sell signal.
Centre line is at RSI 50.
if RSI is above 50 its considered bullish trend. (increasing strength)
if RSI is below 50 its considered bearish trend. (decreasing strength)
RSI crossing centre line (50) upside may be a buy signal.
RSI crossing centre line (50) downside may be a sell signal.
"B" signal in green colour shows that RSI is crossing above Mid 50 horizontal line, which may be a likely Buy signal.
"S" signal in red colour shows that RSI is crossing below Mid 50 horizontal line, which may be a likely Sell signal.
Indicator 3
RSI 40 and RSI 60 Support and Resistance
RSI 40 acting as support in the below chart
In an uptrend RSI tends to remain in the 40 to 90 range with 40 as support (buying opportunity at support).
RSI 60 acting as resistance in the below chart
In a downtrend RSI tends to remain in 10 to 60 range with 60 as resistance (selling opportunity at resistance).
"40" signal in green colour shows that RSI is crossing above 40 horizontal line, which may be a likely Support in making and a Buy signal.
"60" signal in red colour shows that RSI is crossing below 60 horizontal line, which may be a likely Resistance in making and a Sell signal.
Note:-
These ranges may change depending on RSI settings and change in the market trend.
Indicator 4
RSI Divergence
Below chart shows a simple example of Bullish Divergence and Bearish Divergence.
An RSI divergence occurs when price moves in the opposite direction of the RSI.
A bullish divergence is when price is falling but RSI is rising. which means RSI making higher lows and price making lower lows (buy signal).
A bearish divergence is when price is rising but RSI is falling. which means RSI making lower high and price making higher highs (sell signal).
Divergences are more strong when appear in an overbought or oversold condition.
There may be many false signals during a strong uptrend or strong downtrend.
In a strong uptrend, RSI may show many false bearish divergences before finally reversing down.
same way in a strong downtrend, RSI may show many false bullish divergences before finally reversing up.
"Bull Div" signal along with divergence line in green colour shows Bullish Divergence, which may be a likely Buy signal.
"Bear Div" signal along with divergence line in red colour shows Bearish Divergence, which may be a likely Sell signal.
Indicator 5
Double Top & Double Bottom
Double Bottom = RSI goes below oversold (30). RSI comes back above 30. RSI falls back again towards 30 and again rise making a Double bottom. its a signal of buying and likely upside reversal.
Double Top = RSI goes above overbought (70). RSI comes back below 70. RSI rises back again towards 70 and again fall making a Double top. its a signal of selling and likely downside reversal.
Double Bottom is shown with Green Dashed line joining two low's of RSI indicating a likely Buy Signal.
Double Top is shown with Red Dashed line joining two High's of RSI indicating a likely Sell Signal.
Indicator 6
Trendline Support and Resistance
Below chart shows RSI Trendline Resistance and Support
RSI resistance trendline = Connect three or more points on the RSI line as it falls to draw a RSI downtrend line (RSI resistance trendline).
Everytime it takes resistance from a RSI downtrend line its a selling opportunity.
RSI support trendline = Connect three or more points on the RSI line as it rises to draw a RSI uptrend line (RSI support trendline).
Everytime it takes support on a RSI uptrend line its a buying opportunity.
RSI Resistance trendline shown in Red colour indicating a likely fall again after rejection from this Red trendline till the time RSI breaks above it to change the trend from Bearsih to Bullish.
RSI support trendline shown in Green colour indicating a likely Rise again after support from this Green trendline till the time RSI breaks below it to change the trend from Bullish to Bearish.
Indicator 7
Trendline Breakout and Breakdown
Below chart shows RSI Trendline Breakout and Breakdown
RSI resistance trendline Breakout = Connect three or more points on the RSI line as it falls to draw a RSI downtrend line (RSI resistance trendline).
Whenever it breakout above RSI resistance trendline its a buying opportunity.
RSI support trendline Breakdown = Connect three or more points on the RSI line as it rises to draw a RSI uptrend line (RSI support trendline).
Whenever it breakdown below RSI support trendline its a selling opportunity.
Note:-
Correlate both the RSI and the closing price to ensure proper breakout or breakdown.
Challenge is to correctly identify if a breakout or breakdown is sustainable or its a false signal.
Indicator 8
RSI Crossover same timeframe
RSI with two different RSI length crossing each other on same timeframe.
when lower RSI length crossing above higher RSI length its a buy signal.
when lower RSI length crossing below higher RSI length its a sell signal.
for example RSI with length 7 & length 14 on 15 Minutes timeframe.
Green Cross shows that Fast RSI is crossing above Slow RSI on the same timeframe with different RSI length Settings, which means it may be a likely Buy Signal.
Red Cross shows that Fast RSI is crossing below Slow RSI on the same timeframe with different RSI length Settings, which means it may be a likely Sell Signal.
Indicator 9
RSI Crossover Multi timeframe
RSI with same RSI length but on two different timeframes crossing each.
when lower timeframe RSI crossing above higher timeframe RSI its a buy signal.
when lower timeframe RSI crossing below higher timeframe RSI its a sell signal.
for example RSI with length 14 on 5 Minutes and 1 Hr timeframes.
Green Cross shows that Lower Timeframe RSI is crossing above Higher Timeframe RSI with same RSI length Settings, which means it may be a likely Buy Signal.
Red Cross shows that Lower Timeframe RSI is crossing below Higher Timeframe RSI with same RSI length Settings, which means it may be a likely Sell Signal.
Indicator 10
RSI EMA/WMA/SMA Crossover
when RSI crossing above EMA/WMA/SMA its a buy signal.
when RSI crossing below EMA/WMA/SMA its a sell signal.
Green Circle shows that RSI is crossing above EMA/WMA/SMA etc, which means it may be a likely Buy Signal.
Red Circle shows that RSI is crossing below EMA/WMA/SMA etc, which means it may be a likely Sell Signal.
Indicator 11
RSI with Bollinger bands
Bollinger bands and RSI complimenting each other and giving a Buy and Sell signal in below chart
if a security price reaches upper band of a Bollinger Band channel and also the RSI is above 70 (overbought), a trader can look for selling opportunities (reversal) (sell).
but in case price reaches upper band of a Bollinger Band channel but RSI is not above 70 (overbought), there may be chance that security remains in an uptrend, so a trader may wait before entering a sell position.
if a security price reaches lower band of a Bollinger Band channel and also the RSI is below 30 (oversold), a trader can look for buying opportunities (reversal) (buy).
but in case price reaches lower band of a Bollinger Band channel but RSI is not below 30 (oversold), there may be chance that security remains in an downtrend, so a trader may wait before entering a buy position.
so bollinger band with RSI can give a double confirmation on a reversal.
Buy Signal = If the RSI is below Green Horizontal line (Oversold zone) and also below Lower Bollinger Band it indicates that an upside reversal may come, which means that it may be a likely Buy Signal.
Sell Signal = If the RSI is above Red Horizontal line (Overbought zone) and also above Upper Bollinger Band it indicates that an Downside reversal may come, which means that it may be a likely Sell Signal.
Special Thanks to //© HoanGhetti for RSI Trendlines.
Limitations of the RSI:-
RSI works best in range bound market and is less trustworthy in trending markets.
So new traders may get trapped in an uptrend or a downtrend if they forget to see the overall long term trend of that security.
Traders should set stop loss and take profit levels as per risk reward ratio.
Note:
Don't confuse RSI and relative strength. RSI is changes in the price momentum of a security.
whereas relative strength compares the price performance of two or more securities.
Like other technical indicators, RSI also is not a holy grail. It can only assist you in building a good strategy. You can only succeed with proper position sizing, risk management and following correct trading Psychology (No overtrade, No greed, No revenge trade etc).
THIS INDICATOR OF RSI IS FOR EDUCATIONAL PURPOSE AND PAPER TRADING ONLY. YOU MAY PAPER TRADE TO GAIN CONFIDENCE AND BUILD FURTHER ON THESE. PLEASE CONSULT YOUR FINANCIAL ADVISOR BEFORE INVESTING. WE ARE NOT SEBI REGISTERED.
Hope you all like it
happy learning.

cd_RSI_Divergence_CxGeneral:
The Relative Strength Index (RSI) is a momentum oscillator widely used by traders in price analysis. In addition to showing overbought/oversold zones, divergences between RSI and price are also tracked to identify trading opportunities.
The general consensus is that oscillators alone are not sufficient for entries and should be evaluated together with multiple confirmations.
This oscillator is designed as an additional confirmation/compatible tool for strategies that already use higher time frame (HTF) sweeps and lower time frame (LTF) confirmations such as Change in State Delivery (CISD) or Change of Character (CHOCH).
Features:
While RSI oscillators are commonly displayed in line format (classic), this indicator also offers candlestick-style visualization.
Depending on the selected source, period length, and EMA length, RSI can be displayed as lines and/or candlesticks.
Divergence detection & tracking:
Price and RSI values are monitored on the chosen higher time frame (from the menu) to determine highs and lows. For divergence display, the user can choose between two modes:
1- Alignment with HTF Sweep
2- All
1 - Alignment with HTF Sweep:
First, the price must sweep the previous high/low of the candle on the HTF (i.e., break it) but fail to continue in that direction and return inside (sweep).
If this condition is met, RSI values are checked:
If price makes a high sweep but RSI fails to make a new high → divergence is confirmed.
If price makes a low sweep but RSI fails to make a new low → divergence is confirmed.
Divergence is then displayed on the chart.
2 - All:
In this mode, sweep conditions are ignored. Divergence is confirmed if:
Price makes a new high on HTF but RSI does not.
RSI makes a new high on HTF but price does not.
Price makes a new low on HTF but RSI does not.
RSI makes a new low on HTF but price does not.
Menu & Settings:
RSI visualization (source + period length + EMA period length)
Option to choose classic/candlestick style display
Color customization
Higher time frame selection
Adjustable HTF boxes and table display
Final notes:
This oscillator is designed as an additional confirmation tool for strategies based on HTF sweep + LTF CISD/CHOCH confirmation logic. The chosen HTF in the oscillator should match the time frame where sweeps are expected.
Divergence signals from this oscillator alone will not make you profitable.
For spot trades, monitoring sweeps and divergences on higher time frames is more suitable (e.g., Daily–H1 / Weekly–H4).
My personal usage preferences:
Entry TF: 3m
HTF bias: Daily + H1
Sweep + CISD: 30m / 3m
Market Structure: 3m
RSI divergence: HTF = 30m
If all of them align bullish or bearish ( timeframe alignment ), I try to take the trade.
I’d be glad to hear your feedback and suggestions for improvement.
Happy trading!

IDX - 5UPThe UDX-5UP is a custom indicator designed to assist traders in identifying trends, entry and exit signals, and market reversal moments with greater accuracy. It combines price analysis, volume, and momentum (RSI) to provide clear buy ("Buy") and sell ("Sell") signals across any asset and timeframe, whether you're a scalper on the 5M chart or a swing trader on the 4H chart. Inspired by robust technical analysis strategies, the UDX-5UP is ideal for traders seeking a reliable tool to operate in volatile markets such as cryptocurrencies, forex, stocks, and futures.
Components of the UDX-5UP
The UDX-5UP consists of three main panels that work together to provide a comprehensive view of the market:
Main Panel (Price):
Pivot Supertrend: A dynamic line that changes color to indicate the trend. Green for an uptrend (look for buys), red for a downtrend (look for sells).
SMAs (Simple Moving Averages): Two SMAs (8 and 21 periods) to confirm the trend direction. When the SMA 8 crosses above the SMA 21, it’s a bullish signal; when it crosses below, it’s a bearish signal.
Entry/Exit Signals: "Buy" (green) and "Sell" (red) labels are plotted on the chart when entry or exit conditions are met.
Volume Panel:
Colored Volume Bars: Green bars indicate dominant buying volume, while red bars indicate dominant selling volume.
Volume Moving Average (MA 20): A blue line that helps identify whether the current volume is above or below the average, confirming the strength of the movement.
RSI Panel:
RSI (Relative Strength Index): Calculated with a period of 14, with overbought (70) and oversold (30) lines to identify momentum extremes.
Divergences: The indicator detects divergences between the RSI and price, plotting signals for potential reversals.
How the UDX-5UP Works
The UDX-5UP uses a combination of rules to generate buy and sell signals:
Buy Signal ("Buy"):
The Pivot Supertrend changes from red to green.
The SMA 8 crosses above the SMA 21.
The volume is above the MA 20, with green bars (indicating buying pressure).
The RSI is rising and, ideally, below 70 (not overbought).
Example: On the 4H chart, the price of Tether (USDT) is at 0.05515. The Pivot Supertrend turns green, the SMA 8 crosses above the SMA 21, the volume shows green bars above the MA 20, and the RSI is at 46. The UDX-5UP plots a "Buy".
Sell Signal ("Sell"):
The Pivot Supertrend changes from green to red.
The SMA 8 crosses below the SMA 21.
The volume is above the MA 20, with red bars (indicating selling pressure).
The RSI is falling and, ideally, above 70 (overbought).
Example: On the 4H chart, the price of Tether rises to 0.05817. The Pivot Supertrend turns red, the SMA 8 crosses below the SMA 21, the volume shows red bars, and the RSI is above 70. The UDX-5UP plots a "Sell".
RSI Divergences:
The indicator identifies bullish divergences (price makes a lower low, but RSI makes a higher low) and bearish divergences (price makes a higher high, but RSI makes a lower high), plotting alerts for potential reversals.
Adjustable Settings
The UDX-5UP is highly customizable to suit your trading style:
Pivot Supertrend Period: Default is 2. Increase to 3 or 4 for more conservative signals (fewer false positives, but more lag).
SMA Periods: Default is 8 and 21. Adjust to 5 and 13 for smaller timeframes (e.g., 5M) or 13 and 34 for larger timeframes (e.g., 1D).
RSI Period: Default is 14. Reduce to 10 for greater sensitivity or increase to 20 for smoother signals.
Overbought/Oversold Levels: Default is 70/30. Adjust to 80/20 in volatile markets.
Display Panels: You can enable/disable the volume and RSI panels to simplify the chart.
How to Use the UDX-5UP
Identify the Trend:
Use the Pivot Supertrend and SMAs to determine the market direction. Uptrend: look for buys. Downtrend: look for sells.
Confirm with Volume and RSI:
For buys: Volume above the MA 20 with green bars, RSI rising and below 70.
For sells: Volume above the MA 20 with red bars, RSI falling and above 70.
Enter the Trade:
Enter a buy when the UDX-5UP plots a "Buy" and all conditions are aligned.
Enter a sell when the UDX-5UP plots a "Sell" and all conditions are aligned.
Plan the Exit:
Use Fibonacci levels or support/resistance on the price chart to set targets.
Exit the trade when the UDX-5UP plots an opposite signal ("Sell" after a buy, "Buy" after a sell).
Tips for Beginners
Start with Larger Timeframes: Use the 4H or 1D chart for more reliable signals and less noise.
Combine with Other Indicators: Use the UDX-5UP with tools like Fibonacci or the Candles RSI (another powerful indicator) to confirm signals.
Practice in Demo Mode: Test the indicator in a demo account before using real money.
Manage Risk: Always use a stop-loss and don’t risk more than 1-2% of your capital per trade.
Why Use the UDX-5UP?
Simplicity: Clear "Buy" and "Sell" signals make trading accessible even for beginners.
Versatility: Works on any asset (crypto, forex, stocks) and timeframe.
Multiple Confirmations: Combines price, volume, and momentum to reduce false signals.
Customizable: Adjust the settings to match your trading style.
Author’s Notes
The UDX-5UP was developed based on years of trading and technical analysis experience. It is an evolution of tested strategies, designed to help traders navigate volatile markets with confidence. However, no indicator is infallible. Always combine the UDX-5UP with proper risk management and fundamental analysis, especially in unpredictable markets. Feedback is welcome – leave a comment or reach out with suggestions for improvements!

Comprehensive Trading Toolkit [BigBeluga]Trading Toolkit is a comprehensive indicator inspired by the trading strategies of the renowned crypto influencer Michaël van de Poppe . This tool combines RSI divergences, correction zones, and advanced support/resistance levels to provide traders with a robust framework for analyzing market movements.
🔵 Key Features:
RSI Divergences on Chart:
Automatically identifies and plots RSI divergences (bullish and bearish) directly on the main price chart.
Green lines indicate bullish divergences, suggesting potential upward reversals.
Red lines indicate bearish divergences, signaling possible downward movements.
Correction Boxes:
Traders typically define a correction as a drop in value of 10% or more. This drop can happen over a few hours or a few days. Also, it can last for less than 24 hours or many months.
This indicator visualizes corrections with blue shaded boxes, triggered by a percentage decline defined in the settings.
The boxes highlight sharp price drops, helping traders identify significant market movements quickly.
Advanced Support and Resistance Levels:
Dynamically detects key support and resistance levels based on price pivots.
When the price is above a level, it plots a green shaded area from the cross point, marking support.
When the price drops below a level, it plots a red shaded area, highlighting resistance.
Dashed lines indicate weaker levels, while solid lines represent stronger, more reliable levels.
🔵 Usage:
Identify Divergences: Use plotted RSI divergences to detect potential market reversals and align them with price action.
Analyze Correction Zones: Utilize correction boxes to evaluate significant price declines and find potential buying opportunities during these corrections.
Leverage Support and Resistance Levels: Confirm breakouts, reversals, or consolidation zones with the color-coded areas.
Enhance Risk Management: Combine divergences and correction zones to set informed stop-loss or take-profit levels.
Trading Toolkit empowers traders with actionable insights into market trends, corrections, and support/resistance dynamics, making it an invaluable tool for crypto and forex markets.

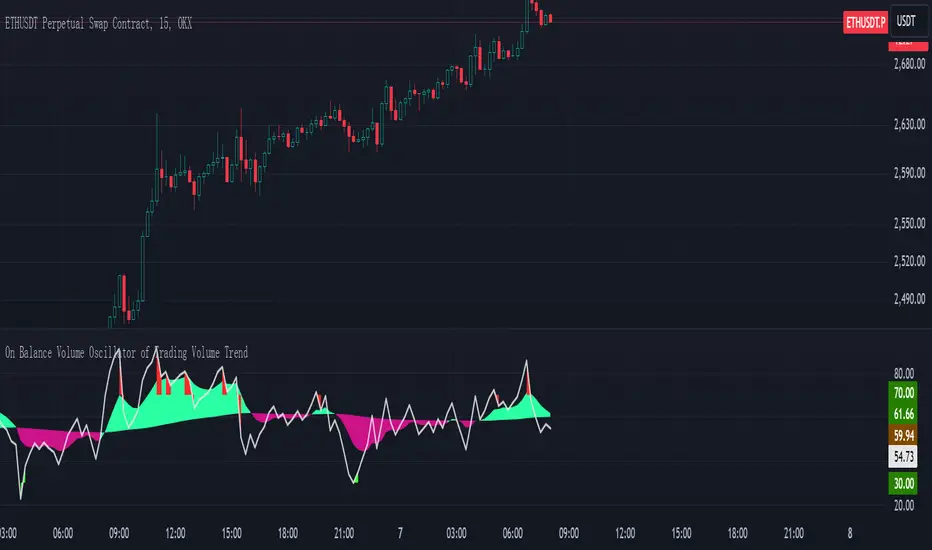
On Balance Volume Oscillator of Trading Volume TrendOn Balance Volume Oscillator of Trading Volume Trend
Introduction
This indicator, the "On Balance Volume Oscillator of Trading Volume Trend," is a technical analysis tool designed to provide insights into market momentum and potential trend reversals by combining the On Balance Volume (OBV) and Relative Strength Index (RSI) indicators.
Calculation and Methodology
* OBV Calculation: The indicator first calculates the On Balance Volume, which is a cumulative total of the volume of up days minus the volume of down days. This provides a running tally of buying and selling pressure.
* RSI of OBV: The RSI is then applied to the OBV values to smooth the data and identify overbought or oversold conditions.
* Exponential Moving Averages (EMAs): Two EMAs are calculated on the RSI of OBV. A shorter-term EMA (9-period in this case) and a longer-term EMA (100-period) are used to generate signals.
Interpretation and Usage
* EMA Crossovers: When the shorter-term EMA crosses above the longer-term EMA, it suggests increasing bullish momentum. Conversely, a downward crossover indicates weakening bullish momentum or increasing bearish pressure.
* RSI Divergences: Divergences between the price and the indicator can signal potential trend reversals. For example, if the price is making new highs but the indicator is failing to do so, it could be a bearish divergence.
* Overbought/Oversold Conditions: When the RSI of OBV is above 70, it suggests the market may be overbought and a potential correction could be imminent. Conversely, when it is below 30, it suggests the market may be oversold.
Visual Representation
The indicator is plotted on a chart with multiple lines and filled areas:
* Two EMAs: The shorter-term EMA and longer-term EMA are plotted to show the trend of the OBV.
* Filled Areas: The area between the two EMAs is filled with a color to indicate the strength of the trend. The color changes based on whether the shorter-term EMA is above or below the longer-term EMA.
* RSI Bands: Horizontal lines at 30 and 70 mark the overbought and oversold levels for the RSI of OBV.
Summary
The On Balance Volume Oscillator of Trading Volume Trend provides a comprehensive view of market momentum and can be a valuable tool for traders. By combining the OBV and RSI, this indicator helps identify potential trend reversals, overbought and oversold conditions, and the strength of the current trend.
Note: This indicator should be used in conjunction with other technical analysis tools and fundamental analysis to make informed trading decisions.
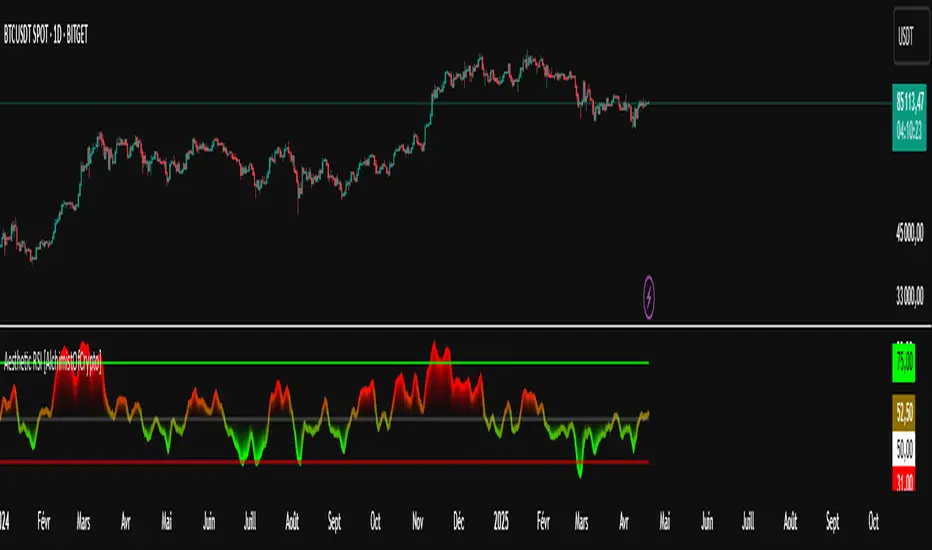
Aesthetic RSI [AlchimistOfCrypto]🌌 Aesthetic RSI – Unveiling the Fractal Forces of Markets 🌌
Category: Momentum Indicators 📈
"The RSI oscillator, formalized through an advanced mathematical prism, reveals the underlying fractal structures of price movements. This indicator draws inspiration from quantum principles of divergence-convergence where the probability of a return to equilibrium increases proportionally to the distance from the median point. Our implementation employs sophisticated algorithmic smoothing to filter out the stochastic noise inherent in financial markets, allowing visualization of the true momentum forces according to thermodynamic entropy principles applied to trading systems."
📊 Professional Trading Application
The Aesthetic RSI is a visually stunning and mathematically refined take on the classic Relative Strength Index. With customizable settings, advanced smoothing, and eight unique visual palettes, it empowers traders to detect momentum shifts and divergences with unparalleled clarity.
⚙️ Indicator Configuration
- Length 📏
The core parameter (default: 20) that determines the calculation period.
- Lower values (8-14): Increase sensitivity for short-term trading.
- Higher values (21-34): Provide stronger signals for position trading.
- OverBought/OverSold Thresholds 🎯
Customizable boundaries (default: 75/25) to identify extreme market conditions.
- Calibrate based on asset volatility: Higher volatility assets may need wider thresholds (80/20) to reduce false signals.
- Style 🎨
Eight meticulously crafted visual palettes optimized for pattern recognition:
- Miami Vice (default): High-contrast cyan/magenta scheme for spotting divergences.
- Cyberpunk: Yellow/purple combo to highlight momentum shifts.
- Classic: Traditional green/red for conventional analysis.
- High Contrast: Maximum visual separation for traders with visual impairments.
- Specialized palettes (Forest, Ocean, Fire, Monochrome): Tailored for diverse market conditions.
- Mode Selection 🔄
- Full: Displays a complete gradient spectrum across the RSI range, emphasizing momentum transitions between 35-65.
- OverZone: Focuses on actionable extreme zones, reducing noise in ranging markets.
🚀 How to Use
1. Adjust Length ⏰: Set the period based on your trading style (short-term or long-term).
2. Fine-Tune Thresholds 🎚️: Customize overbought/oversold levels to match the asset’s volatility.
3. Select a Palette 🌈: Choose a visual style that enhances your pattern recognition.
4. Choose Mode 🔍: Use "Full" for detailed momentum analysis or "OverZone" for extreme zone focus.
5. Spot Divergences ✅: Look for price-RSI divergences to anticipate reversals.
6. Trade with Precision 🛡️: Combine with other indicators for high-probability setups.
📅 Release Notes (April 2025)
Aesthetic RSI blends quantum-inspired mathematics with artistic visualization, redefining momentum analysis. Stay tuned for future enhancements! ✨
🏷️ Tags
#Trading #TechnicalAnalysis #RSI #Momentum #Divergence #MultiTimeframe #TradingStrategy #RiskManagement #Forex #Stocks #Crypto #Bitcoin #AlgoTrading #DayTrading #SwingTrading #TheAlchimist #QuantumTrading #VisualTrading #PatternRecognition
Momentum Divergence SignalDescription:
The Momentum Divergence Signal is a powerful tool that identifies potential trend reversals by analyzing the interaction between price movements and main oscillators. It highlights moments when price action diverges from the following, which can be a key signal of a trend shift. The most important aspect of this indicator is its ability to detect bullish and bearish divergences.
Coming to the critical part, it is highly recommended to pair this indicator with another trend confirmation tool for improved decision-making, as it works on catching both trend continuation and reversal signals, but it is always favored to match use it as a trend continuation entry provider.
Core Functionality:
Session-Based Signals:
The indicator limits signals to specific market sessions: the Asian, London, and US sessions, optimizing trade opportunities during active trading hours.
Cooldown Mechanism:
To prevent signal spamming, a cooldown period of at least 8 bars is required between each signal, ensuring that new signals are spaced out and not over-generating.
Divergence with Trend Confirmation:
While the RSI divergence alone can highlight potential trend shifts, this script is best paired with other trend-following indicators to filter out false signals. This ensures that the divergence signal is part of a broader, more reliable trend-following strategy.
Visual Components:
Buy and Sell Arrows: Visual arrows on the chart where the divergence occurs, accompanied by "Buy" and "Sell" labels in white to clearly indicate the signal points.
Advanced Concepts:
Divergence as a Reversal Signal: The key strength of this indicator lies in detecting divergences that can indicate a trend reversal. Divergences often precede significant changes in price direction, offering potential opportunities for traders to enter or exit positions before the trend fully shifts.
Pairing with Trend Confirmation Indicators: Since divergence signals can sometimes produce false positives, the most effective use of this tool comes when paired with a trend-following indicator (such as moving averages or price action analysis) to validate the reversal signals.
Applications:
Trend Reversal Detection: Monitor for divergences between price action and RSI to identify potential trend reversals. These signals are most useful when combined with trend confirmation tools to ensure the validity of the reversal.
Strategic Use in Trend-Following Systems: This indicator is best employed within a trend-following strategy where it serves as an additional confirmation signal for market shifts. While it can identify potential reversal points, its strength lies in its ability to identify shifts in momentum within an ongoing trend.
Real-Time Visual Feedback: The "Buy" and "Sell" signals, that are displayed directly on the chart, providing real-time context for traders.
Disclaimer: This indicator is designed for informational purposes only and should not be considered financial advice. Traders should combine it with other market analysis tools and perform their own research before making trading decisions.

The Ultimate Backtest - Fontiramisu█ OVERVIEW
The Ultimate Backtest allows you to create an infinite number of trading strategies and backtest them easily and quickly.
You can leverage the trading setup you created with the tradingview's real-time alert system.
The tool is constantly being improved to accommodate more in-house indicators in order to imagine more trading strategies.
█ HOW IT WORKS.
The tool is divided into 3 main parts:
1. The indicators:
These are the indicators that you will be able to set up to create your setups.
Example: rsi, exponential moving average, home made resistance/support indicator etc.
We are working to add more and more in-house indicators to multiply the trading strategies.
2. The entry/exit strategy:
The entry/exit trades management is a central point of the strategy.
Here we propose several ways to take profits and in-house optimizations to enter a position.
3. The setup: the combination of indicators
Here it is up to you to create your own recipe.
You combine the different indicators set up above to make a real strategy.
Example: RSI Divergence + Location on a support.
Let's look at this in more detail.
Below is a description of all sections
█ 1. THE INDICATORS
TREND: MA (moving average) -->
Set up a moving average from multiple methods (sma, ema, smma...) of the type and length you want.
> A long is taken if the price is above the MA.
> A short is taken if the price comes below the MA.
You can set up a smoothing MA from the existing moving average and use it in the same way.
ENVELOPE: SUPER TREND -->
The supertrend is a trend following indicator. It clearly describes the distinction between downtrends and uptrends with a red or green direction. It is calculated according to the ATR and a factor.
> A long is taken when the direction is green and the price touches the supertrend support line.
> A short is taken when the direction is red and the price touches the supertrend resistance line.
ENVELOPE: BOLLINGER BAND -->
Bollinger bands are used to evaluate the volatility and probable evolution of prices, here we exploit the envelope
> A long is taken if the price crosses the lower band.
> A short is taken if the price crosses the upper band.
CLOUD: ICHIMOKU -->
The Ichimoku cloud aims to identify the direction and reversal points of dominant market trends. It displays support and resistance levels.
> A long is taken when the price enters the green ichimoku cloud.
> A short is taken when the price enters the red ichimoku cloud.
MOMENTUM: MACD ZERO LAG / MACD / RSI -->
RSI (Relative Strength Index) reflects the relative strength of upward movements, compared to downward movements.
MACD (Moving Average Convergence Divergence) is a momentum indicator that follows the trend and shows the correlation between two moving averages of the asset price.
MACD ZERO LAG is calculated in the same way except that the exponential moving averages that make up the calculation do not lag.
> A long is taken on a potential bullish divergence.
> A short is taken on a potential bearish divergence.
For now, with these indicators, we only take a trade based on divergences but we will add overbuy/oversell etc.
MOMENTUM: MA SLOPE -->
This house indicator allows you to use the slope of a moving average as a measure of momentum.
Define the length of the moving average whose slope we will take.
We then take a fast ma of the slope then a slow ma (You define the lengths with the parameters)
The tool foresees a subtraction between the slow and fast ma to have another interpretation of the slope.
This indicator is available and can be viewed freely on my tradingview profile.
> A long is taken when there is a potential bullish divergence on the fast/slow MA or the difference.
> A short is taken when there is a potential bear divergence on the fast/slow MA or the difference.
RESISTANCE: R/S FONTIRAMISU -->
An in-house indicator that shows resistances and supports according to the chosen parameters.
Indicator available and can be viewed freely on my tradingview profile.
> A long is taken when the price arrives on a support.
> A short is taken when the price arrives on a resistance.
-----
MOMENTUM DIVERGENCE -->
Section used to set the divergence detection.
The first field allows you to select which momentum you want to calculate the divergence on.
PIVOT DETECTION -->
Used to calculate top and dip on the chart, it is used with divergences/resistances/enter-exit optimizations....
Default parameters are: Deviation: 2.5, Depth: 10.
█ 2. STRATEGY FOR ENTERING/EXITING TRADES.
STRATEGY: TP/SL -->
Enter/Exit Trade Mode" field: The first field allows you to choose between two modes:
1. TP/SL Mode:
This mode allows you to take entries with take profits that you define afterwards with the TP1 and TP2 parameters .
> The stop loss is calculated automatically by taking the last dip if it is a long and the last top if it is a short.
> You can add a "Stop Loss % Offset" which will increase the size of the stop loss by the % value you set.
> If you activate TP2, the profit taking is split between TP1 and TP2, you can select the percentage of profit taking split between TP1 and TP2 via the "Percent Exit Profit TP1" field.
> The "TPX Multiplier" fields allow you to define the desired Risk Reward, if = 1 then RR = 1/1.
> A Trailing stop option is available, if active then the profit take will be split between TP1 and Trailing stop.
For the moment you can choose between the two MA's set up above to serve as trailing stop:
> In long, if the price goes below the MA then you take the profit (or the loss)
> In short, if the price goes above the MA then you take the profit (or the loss)
2. ONLY BUY/SELL:
Here the take profits are not taken into account, we only have an alternation between the long and the shorts.
The trailing stop applies to this mode and can be interesting depending on the use.
STRATEGY: SETUP OPTIMIZER (FP) -->
Here we have 3 home made optimization tools to take more relevant trades.
1. FAVORABLE ENTRY FROM PIVOT.
Here the tool will favor entries with interesting locations depending on dips and tops before.
A red cross with "FP" will appear on the chart each time a trade does not meet this condition.
2.STOP LOSS MAX (SL).
Will only take trades where the stop loss is maximum at X%.
A red cross with "%SL" will appear on the chart each time a trade does not meet this condition.
3. MOVE ALREADY TRADED.
Will not take several trades in the same move.
This can avoid cascading losing trades on some setups.
A red cross with "MT" will appear on the chart each time a trade does not meet this condition.
█ 3. THE SETUP: THE COMBINATION OF INDICATORS
Here, let your creativity speak.
You are free to assemble the indicators in the following way:
The conditions defined inside a group (group1/group2/group3) are combined to each other via an OR operator .
Example, if "cond01 = Momentum DIv" and "cond02 = Res/Sup Location", then trades will be triggered if one of the two conditions is met.
The conditions defined between several groups are multiplied via the AND operator .
Example, if "cond01 = Momentum DIv" and "cond12 = Res/Sup Location", then trades are taken if both conditions are met at the same time.
ALL CONDITIONS:
> NONE
No conditions selected.
> Momentum Div
Triggers when a potential divergence occurs on the selected momentum (in the divergence section).
> Momentum Div UT Sup
Triggers when a potential divergence occurs on the selected momentum (in the divergence section) in the upper timeframe.
The upper timeframe of the momentum is calculated directly in the code by multiplying the set parameters by 4 (fastlenght/slowlenght...).
> Multi MA
It is set in the "Trend: MA" section and is triggered by the conditions mentioned in the "INDICATORS" section.
> Smooting MA
Is set in the "Trend: MA" section and is triggered by the conditions mentioned in the "INDICATORS" section.
> Super Trend Env
Is set in the "ENVELOPE: SUPER TREND" section and is triggered by the conditions mentioned in the "INDICATORS" section.
> BB Env
It is set in the "ENVELOPE: BOLLINGER BAND" section and is triggered by the conditions mentioned in the "INDICATORS" section.
> Ichimoku Cloud
Is set in the "CLOUD: ICHIMOKU" section and is triggered by the conditions mentioned in the "INDICATORS" section.
> Res/Sup Location
Is set in the "RESISTANCE: R/S" section and is triggered by the conditions mentioned in the "INDICATORS" section.

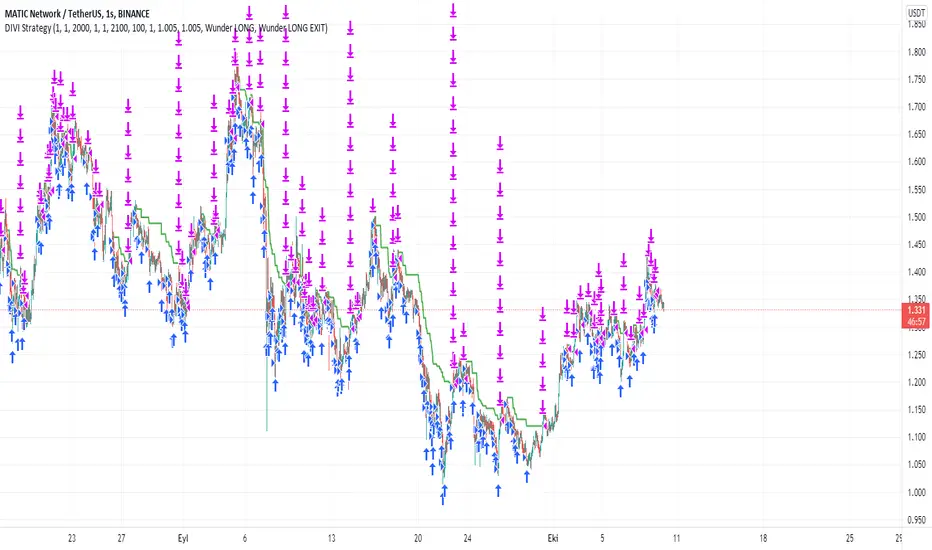
DIVI Wunder StrategyAs it is known, divergence is a situation we encounter very often on graphs. Various divergencies may occur according to many indicators. MACD divergence, RSI divergence... In the strategy I use only positive divergence. What is positive divergence I will explain on MACD positive divergence A MACD positive divergence is a situation in which the MACD does not reach a new low, despite the fact that the price of the stock reached a new low. This is seen as a bullish trading signal—hence, the term “positive divergence.” So I thought of these divergencies and came up with a new strategy. Combining the divergencies with the VOLPIN strategy I wrote earlier, a great strategy has emerged. When the divergence signals are came from MACD,RSI,CCI,OBV,Chaikin Money Flow, VWmacd and Money Flow Index all these indicators I sent a buy signal until the 40 times completed. ThenI sent to sell signal when the price come to take profit level. In this strategy, you divide your principal into as many parts as you want. For example, let's say that you have 1000 dollars of money and you make purchases by dividing this money into 40 equal parts in the default settings of the indicator. $25 per purchase. After each purchase is made as 25 dollars, you can adjust your profit rate from the profit taking settings. When you look at the results of the strategy, your profit rate will be very high. I usually use this strategy in one hour periods. Of course you change it whatever you want. Also change all settings from panel to get more profit. Have fun :)
RSI Momentum Divergence Zones [ChartPrime]⯁ OVERVIEW
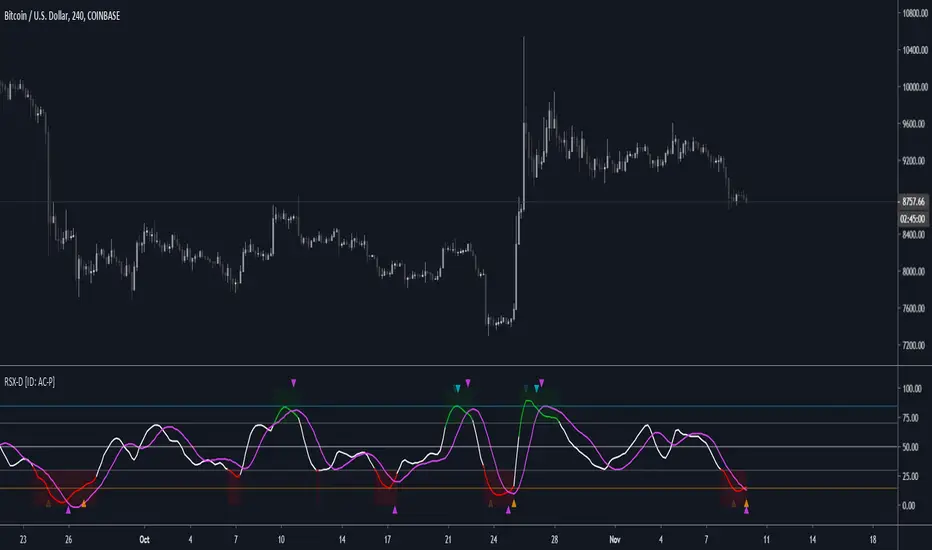
RSI Momentum Divergence Zones is a hybrid oscillator and chart overlay tool that detects RSI-based momentum divergences and projects them as key zones on the chart. By combining RSI divergence logic with horizontal level plotting, this indicator reveals high-probability support and resistance areas where price has historically reacted to hidden or classic divergences.
⯁ KEY FEATURES
Momentum-Based RSI Source:
Instead of the classic RSI input, this tool uses the momentum of price as the RSI source:
rsiSrc = ta.mom(close, 10)
This emphasizes acceleration and deceleration of price moves, sharpening divergence signals and making them more responsive to early shifts in momentum.
Automatic Divergence Detection (Optional):
When enabled, the indicator continuously scans for:
— Bullish Divergence : Price makes a Lower Low while RSI forms a Higher Low
— Bearish Divergence : Price makes a Higher High while RSI forms a Lower High
It ensures divergence is valid by checking the spacing between pivots (min 5, max 50 bars).
Divergence Labels & Markers (RSI Pane + Chart):
When a valid divergence is detected:
— On RSI pane:
Labels appear at HL/LH points (“Bull” / “Bear”)
Colored lines show pivot structures
— On price chart:
Labels (“▲ Bull” / “Bear ▼”) mark price pivot that triggered the divergence
Lines highlight the exact price level at the divergence origin
Divergence Zones / Levels (Toggleable):
The indicator projects horizontal zones across the chart based on confirmed divergence points.
These levels dynamically extend as long as price respects them, and auto-expire once broken.
They act as S/R levels created by market imbalance caused by divergence reactions.
Dynamic Zone Extension Logic:
Once plotted, divergence levels will extend to the right:
— If price respects the level, the zone keeps growing
— If broken in the opposite direction, the level stops extending and turns dashed (visually showing break)
Zone Layering and Limit Control:
You can limit the number of simultaneous zones shown on the chart (e.g., 10 most recent).
Old zones automatically expire and are removed to keep the chart clean and focused.
Color Customization and Intensity:
Different colors for bullish and bearish zones let you easily distinguish trend direction.
Background fill, line width, and transparency are all adjustable.
Clean Zone Management with Arrays:
Behind the scenes, the script uses custom divLevel type arrays to manage plotted levels, ensuring they stay up-to-date, extend correctly, and delete once invalidated.
⯁ USAGE
Use bullish divergence zones as potential demand areas and bearish ones as supply zones.
Combine RSI pane labels with price-level zones to confirm strength of reversal.
Watch for price approaching a divergence level to anticipate reactions or breakouts.
Use divergence levels as trade triggers, stop-loss guides, or take-profit markers.
Limit signal count using the “Qty Divergence Zones” setting to reduce chart clutter.
Enable divergence detection only when you want to focus on key structural zones — ideal for swing or positional setups.
⯁ CONCLUSION
RSI Momentum Divergence Zones blends oscillator divergence logic with price action structure to uncover hidden strength or weakness in the market. With flexible zone plotting and clean visual signals, this tool empowers traders to identify where momentum turns into structure — turning hidden signals into tradable edges.

Mean Reversion Bundle [ActiveQuants]The Mean Reversion Bundle indicator is a powerful and versatile toolkit designed for traders who specialize in mean reversion strategies . This comprehensive bundle integrates eight key technical indicators renowned for their ability to identify potential price reversals, overbought/oversold conditions, and market exhaustion points. By consolidating Moving Averages (Fast & Slow) , Bollinger Bands , RSI (with Divergence) , Stochastic , Keltner Channels , Standard Pivot Points , ATR , and the Choppiness Index into a single, efficient script, it significantly streamlines chart analysis and empowers robust strategy development.
This bundle operates on the core principle of mean reversion: prices tend to revert to their historical average or mean over time . The included indicators provide multiple perspectives to assess these potential turning points:
Dynamic Support/Resistance: Moving Averages, Bollinger Bands, Keltner Channels, Pivot Points.
Momentum Oscillators: RSI, Stochastic.
Overbought/Oversold Conditions: RSI, Stochastic, Bollinger Bands.
Volatility Assessment: ATR, Bollinger Bands, Keltner Channels.
Market Condition Filter: Choppiness Index (Range vs. Trend).
Reversal Signals: RSI Divergence, Bollinger Band recovery.
By enabling users to selectively activate, extensively customize, and visualize these tools ( often with multi-timeframe capabilities ), the Mean Reversion Bundle facilitates a nuanced and layered approach to identifying high-probability mean reversion setups.
█ KEY FEATURES
All-in-One Mean Reversion Suite: Access eight distinct mean reversion indicators within a single TradingView script slot, saving valuable indicator space.
Modular Design: Easily toggle each indicator (Fast MA, Slow MA, Bollinger Bands, RSI, Stochastic, Keltner Channels, Pivot Points, ATR, Choppiness Index) On or Off through the intuitive settings menu to tailor your analysis.
Deep Customization: Fine-tune a wide array of parameters for every indicator, including lengths, sources, MA types, colors, line styles, levels, and specific calculation methods to precisely match your trading strategy and the asset's characteristics.
Multi-Timeframe (MTF) Capability: Configure most indicator components to analyze data from a different timeframe than your main chart, providing crucial higher-level context for mean reversion signals (e.g., daily RSI on an hourly chart).
Integrated Alert System: Pre-built alert conditions for critical mean reversion events such as:
- Price Crossover/Crossunder (Fast MA)
- Price Crossover/Crossunder (Slow MA)
- Lower Bollinger Band Recovery
- Upper Bollinger Band Recovery
- Bullish RSI Divergence
- Bearish RSI Divergence
Set up these alerts directly through TradingView's alert creation dialog. (See section on "█ SETTING UP ALERTS " for more details).
Advanced MA & RSI Smoothing: Option to apply a secondary smoothing MA or even Bollinger Bands directly to the Fast MA, Slow MA, and RSI lines for refined signal generation.
Sophisticated Pivot Points Module: Includes multiple Pivot Point types (Traditional, Fibonacci, Woodie, Classic, DM, Camarilla) with flexible timeframes (Daily to Decennially) and dynamic drawing of historical levels.
RSI Divergence Detection: Automatically plots potential bullish and bearish divergences between price and the RSI, a classic reversal signal.
█ USER INPUTS
The settings panel is organized into distinct sections for each of the 8 core indicator components:
Fast MA & Slow MA: On/Off, MA Type, Source, Length, Color, Line Width, Smoothing Type (None, MA, or MA + BBs), Smoothing Length, BB StdDev (if smoothing with BBs), Timeframe, Wait TF Close.
Bollinger Bands: On/Off, Length, Basis MA Type, Source, StdDev Multiplier, Offset, Colors, Timeframe, Wait TF Close.
RSI: On/Off, Source, Length, Overbought/Middle/Oversold Levels, Color, Line Width, Smoothing Type (None, MA, or MA + BBs), Smoothing Length, BB StdDev (if smoothing with BBs), Plot Divergence, Divergence Lookback Left/Right, Timeframe, Wait TF Close.
Stochastic: On/Off, %K Length, %K Smoothing, %D Smoothing, Overbought/Middle/Oversold Levels, Colors, Timeframe, Wait TF Close.
Keltner Channels: On/Off, Length, Multiplier, Source, Use Exponential MA (for basis), Bands Style (ATR, TR, Range), ATR Length, Colors, Timeframe, Wait TF Close.
Pivot Points: On/Off, Type, Pivots Timeframe (Anchor), Number of Pivots Back, Use Daily-based Values, Show Labels, Show Prices, Labels Position, Line Width, Line Style, and individual color/visibility toggles for P, S1-S5, R1-R5.
ATR: On/Off, Length, Smoothing Type, Color, Timeframe, Wait TF Close.
Choppiness Index: On/Off, Length, Offset, Upper/Middle/Lower Band Levels, Color, Timeframe, Wait TF Close.
█ SETTING UP ALERTS
The Mean Reversion Bundle comes with several pre-configured alert conditions to notify you of potential trading opportunities. To set up an alert:
Click the " Alert " button (clock icon) on TradingView's right-hand toolbar or top panel.
In the " Condition " dropdown, select " Mean Reversion Bundle ".
A second dropdown will appear, allowing you to choose from the specific alert conditions built into the script (e.g., " Price Crossover (Fast MA) ", " Bullish RSI Divergence ", " Lower Bollinger Band Recovery ").
You can also create more complex alerts by selecting one of the indicator's plotted lines (e.g., " RSI ", " Stochastic %K ", " Bollinger Band Basis ") in the first condition box, then choosing a comparison (e.g., " Crossing Down ", " Greater Than "), and then selecting another value or plotted line from the indicator in the third box.
Choose your preferred " Trigger " option:
- " Only Once ": The alert triggers the first time the condition is met, even on an unclosed (intra-bar) candle. The alert then deactivates.
- " Once Per Bar Close ": (Recommended for most mean reversion signals) The alert triggers only after the current bar closes if the condition was true on that closed bar. This ensures signals are based on confirmed price action and allows the alert to re-trigger on subsequent bars if the condition remains true.
- Other options like " Once Per Bar " or " Once Per Minute " are also available for different needs.
Customize the alert name, message, and notification preferences.
Click " Create ".
█ STRATEGY EXAMPLES
The following examples are for illustrative purposes only to demonstrate how indicators in this bundle can be combined for mean reversion strategies. They are not financial advice. Always conduct thorough backtesting and research.
1. Bollinger Band Reversal with RSI Confirmation
Goal: Identify potential reversals when price touches an outer Bollinger Band and RSI shows overbought/oversold conditions.
Setup: Enable Bollinger Bands (e.g., 20,2), RSI (e.g., 14), and optionally the Choppiness Index.
Entry (Long):
- Price touches or briefly closes below the Lower Bollinger Band.
- RSI is in the oversold region (e.g., below 30) or shows bullish divergence.
- Optional Filter: Choppiness Index > 61.8 (indicating a ranging market favorable for BB mean reversion).
- Enter on a confirming candle (e.g., price closes back inside the Lower Band, or a bullish candle pattern forms).
Entry (Short): Reverse logic for Upper Bollinger Band and overbought RSI (e.g., above 70) or bearish divergence.
Management: Stop-loss beyond the recent swing low/high or a multiple of ATR. Target the Bollinger Band basis line or the opposite band.
2. Stochastic Oversold/Overbought with Pivot Point Support/Resistance
Goal: Trade bounces from key Pivot Point levels when confirmed by Stochastic extremes.
Setup: Enable Stochastic (e.g., 14,3,3), Pivot Points (e.g., Daily Traditional), and Fast MA (e.g., 9 EMA) for short-term trend context.
Entry (Long):
- Price approaches a significant Pivot Support level (S1, S2).
- Stochastic %K and %D lines are in the oversold region (e.g., below 20) and ideally show a bullish crossover (%K crosses above %D).
- Optional Filter: Price is above the Fast MA, or the Fast MA starts to slope up.
- Enter on signs of price rejection at the Pivot level.
Entry (Short): Reverse logic for Pivot Resistance levels (R1, R2) and overbought Stochastic (e.g., above 80) with a bearish crossover.
Management: Stop-loss below the Pivot Support (for longs) or above Pivot Resistance (for shorts). Target the next Pivot level or a fixed risk-reward ratio.
3. RSI Divergence at Keltner Channel Extremes
Goal: Capitalize on weakening momentum (divergence) as price tests the outer Keltner Channel bands.
Setup: Enable RSI (with Divergence plotting enabled), Keltner Channels (e.g., 20,2 EMA basis, ATR 10), and ATR (for stop placement).
Entry (Long):
- Price is testing or near the Lower Keltner Channel band.
- A Bullish RSI Divergence is plotted (price makes a lower low, but RSI makes a higher low).
- Enter once the divergence is confirmed and price shows signs of turning up.
Entry (Short):
- Price is testing or near the Upper Keltner Channel band.
- A Bearish RSI Divergence is plotted (price makes a higher high, but RSI makes a lower high).
- Enter once divergence is confirmed and price shows signs of turning down.
Management: Place stop-loss based on ATR (e.g., 1.5x ATR below entry for longs) or beyond the Keltner Channel. Target could be the Keltner basis line or a measured move.
█ CONCLUSION
The Mean Reversion Bundle offers a sophisticated yet user-friendly suite of tools essential for traders focusing on mean reversion. By consolidating these powerful indicators, providing extensive customization , multi-timeframe analysis , and integrated alerts , this bundle simplifies the analytical workflow and aids in the development of more robust and nuanced trading strategies. Whether identifying potential exhaustion points, confirming overbought/oversold conditions, or finding precise entry near dynamic support/resistance, this bundle is a versatile asset for your technical analysis toolkit.
█ IMPORTANT NOTES
⚠ Parameter Optimization: The default settings are starting points. Always adjust indicator parameters (lengths, multipliers, levels) based on the specific asset, its volatility, and the timeframe you are trading. Thorough backtesting is crucial.
⚠ Multi-Timeframe Dynamics: Using the " Timeframe " input can be very powerful. If " Wait TF Close " is enabled (default), signals from higher timeframes will only update upon the close of that higher timeframe bar. Disabling it may lead to signals changing intra-bar.
⚠ Confluence is Key: Avoid relying on a single indicator. The strength of this bundle lies in combining signals from multiple indicators to build a confluence case for a trade.
⚠ Chart Clarity: While many tools are available, only enable those pertinent to your current strategy to maintain a clear and actionable chart.
⚠ Signal Confirmation: Indicator signals are typically finalized on bar close. Be cautious when acting on intra-bar signals, as they can change before the bar is complete. Using " Once Per Bar Close " for alerts is generally recommended for mean reversion signals.
█ RISK DISCLAIMER
Trading involves a substantial risk of loss and is not suitable for all investors. The Mean Reversion Bundle indicator is provided for educational and informational purposes only . It does NOT constitute financial advice or a recommendation to buy or sell any asset. Indicator signals identify potential patterns based on historical data but do not guarantee future price movements or profitability. Always conduct your own thorough research, utilize multiple sources of information, and implement robust risk management practices before making any trading decisions. Past performance is not indicative of future results.
📊 Happy trading! 🚀

Combo 4+ KDJ STO RSI EMA3 Visual Trend Pine V5@RL! English !
Combo 4+ KDJ STO RSI EMA3 Visual Trend Pine V5 @ RL
Combo 4+ KDJ STO RSI EMA3 Visual Trend Pine V5 @ RL is a visual trend following indicator that groups and combines four trend following indicators. It is compiled in PINE Script Version V5 language.
• STOCH: Stochastic oscillator.
• RSI Divergence: Relative Strength Index Divergence. RSI Divergence is a difference between a fast and a slow RSI.
• KDJ: KDJ Indicator. (trend following indicator).
• EMA Triple: 3 exponential moving averages (Default display).
This indicator is intended to help beginners (and also the more experienced ones) to trade in the right direction of the market trend. It allows you to avoid the mistakes of always trading against the trend.
The calculation codes of the different indicators used are standard public codes used in the usual TradingView coding for these indicators.
The STO indicator calculation script is taken from TradingView's standard STOCH calculation.
The RSI indicator calculation script is a replica of the one created by @Shizaru.
The KDJ indicator calculation script is a replica of the one created by @iamaltcoin.
The Triple EMA indicator calculation script is a replica of the one created by @jwilcharts.
This indicator can be configured to your liking. It can even be used several times on the same graph (multi-instance), with different configurations or display of another indicator among the four that compose it, according to your needs or your tastes.
A single plot, among the 4 indicators that make it up, can be displayed at a time, but either with its own trend or with the trend of the 4 (3 by default) combined indicators (sell=green or buy=red, background color).
Trend indications (potential sell or buy areas) are displayed as a background color (bullish: green or bearish: red) when at least three of the four indicators (3 by default and configurable from 1 to 4) assume that the market is moving in the same direction. These trend indications can be configured and displayed, either only for the signal of the selected indicator and displayed, or for the signals of the four indicators together and combined (logical AND).
You can tune the input, style and visibility settings of each indicator to match your own preferences or habits.
A 'buy stop' or 'sell stop' signal is displayed (layouts) in the form of a colored square (green for 'stop buy' and red for 'stop sell'. These 'stop' signals can be configured and displayed, either only for the indicator chosen, or for the four indicators together and combined (logical OR).
Note that the presence of a Stop Long signal cancels the background color of the Long trend (green).
Likewise, the presence of a Stop Short signal cancels out the background color of the Short trend (red).
It is also made up of 3 labels:
• Trend Label
• signal Stop Label (signals Stop buy or sell )
• Info Label (Names of Long / Short / Stop Long / Stop Short indicators, and / Open / Close / High / Low ).
Each label is configurable (visibility and position on the graph).
• Trend label: indicates the number of indicators suggesting the same trend (Long or Short) as well as a strength index (PWR) of this trend: For example: 3 indicators in Short trend, 1 indicator in Long trend and 1 indicator in neutral trend will give: PWR SHORT = 2/4. (3 Short indicators - 1 Long indicator = 2 Pwr Short). And if PWR = 0 then the display is "Wait and See". It also indicates which current indicator is displayed and the display mode used (combined 1 to 4 indicators or not combined ).
• Signal Stop Label: Indicates a possible stop of the current trend.
• Label Info (Simple or Full) gives trend info for each of the 4 indicators and OHLC info for the chart (in “Full” mode).
It is possible to display this indicator several times on a chart (up to 3 indicators max with the Basic TradingView Plan and more with the paid plans), with different configurations: For example:
• 1-Stochastic - 2/4 Combined Signals - no Label displayed
• 1-RSI - Combined Signals 3/4 - Stop Label only displayed
• 1-KDJ - Combined Signals 4/4 - the 3 Labels displayed
• 1-EMA'3 - Non-combined signals (EMA only) - Trend Label displayed
Some indicators have filters / thresholds that can be configured according to your convenience and experience!
The choice of indicator colors is suitable for a graph with a "dark" theme, which you will probably need to modify for visual comfort, if you are using a "Light" mode or a custom mode.
This script is an indicator that you can run on standard chart types. It also works on non-standard chart types but the results will be skewed and different.
Non-standard charts are:
• Heikin Ashi (HA)
• Renko
• Kagi
• Point & Figure
• Range
As a reminder: No indicator is capable of providing accurate signals 100% of the time. Every now and then, even the best will fail, leaving you with a losing deal. Whichever indicator you base yourself on, remember to follow the basic rules of risk management and capital allocation.
BINANCE:BTCUSDT
**********************************************************************************************************************************************************************************************************************************************************************************
! Français !
Combo 4+ KDJ STO RSI EMA3 Visual Trend Pine V5@RL
Combo 4+ KDJ STO RSI EMA3 Visual Trend Pine V5@RL est un indicateur visuel de suivi de tendance qui regroupe et combine quatre indicateurs de suivi de tendance. Il est compilé en langage PINE Script Version V5.
• STOCH : Stochastique.
• RSI Divergence : Relative Strength Index Divergence. La Divergence RSI est une différence entre un RSI rapide et un RSI lent.
• KDJ : KDJ Indicateur. (indicateur de suivi de tendance).
• EMA Triple : 3 moyennes mobiles exponentielles (Affichage par défaut).
Cet indicateur est destiné à aider les débutants (et aussi les plus confirmé) à trader à dans le bon sens de la tendance du marché. Il permet d'éviter les erreurs qui consistent à toujours trader à contre tendance.
Les codes de calcul des différents indicateurs utilisés sont des codes publics standards utilisés dans le codage habituel de TradingView pour ces indicateurs !
Le script de calcul de l’indicateur STO est issu du calcul standard du STOCH de TradingView.
Le script de calcul de l’indicateur RSI Div est une réplique de celui créé par @Shizaru.
Le script de calcul de l’indicateur KDJ est une réplique de celui créé par @iamaltcoin.
Le script de calcul de l’indicateur Triple EMA est une réplique de celui créé par @jwilcharts
Cet indicateur peut être configuré à votre convenance. Il peut même être utilisé plusieurs fois sur le même graphique (multi-instance), avec des configurations différentes ou affichage d’un autre indicateur parmi les quatre qui le composent, selon vos besoins ou vos goûts.
Un seul tracé, parmi les 4 indicateurs qui le composent, peut être affiché à la fois mais, soit avec sa propre tendance soit avec la tendance des 4 (3 par défaut) indicateurs combinés (couleur de fond vente=vert ou achat=rouge).
Les indications de tendance (zones de vente ou d’achat potentielles) sont affichés sous la forme de couleur de fond (Haussier : vert ou baissier : rouge) lorsque au moins trois des quatre indicateurs (3 par défaut et configurable de 1 à 4) supposent que le marché évolue dans la même direction. Ces indications de tendance peuvent être configuré et affichés, soit uniquement pour le signal de l’indicateur choisi et affiché, soit pour les signaux des quatre indicateurs ensemble et combinés (ET logique).
Vous pouvez accorder les paramètres d’entrée, de style et de visibilité de chacun des indicateurs pour correspondre à vos propres préférences ou habitudes.
Un signal ‘stop achat’ ou ‘stop vente’ est affiché (layouts) sous la forme d’un carré de couleur (vert pour ‘stop achat’ et rouge pour ‘stop vente’. Ces signaux ‘stop’ peuvent être configuré et affichés, soit uniquement pour l’indicateur choisi, soit pour les quatre indicateurs ensemble et combinés (OU logique).
A noter que la présence d’un signal Stop Long annule la couleur de fond de la tendance Long (vert).
De même, la présence d’un signal Stop Short annule la couleur de fond de la tendance Short (rouge).
Il est aussi composé de 3 étiquettes (Labels) :
• Trend Label (infos de tendance)
• Signal Stop Label (signaux « Stop » achat ou vente)
• Infos Label (Noms des indicateurs Long/Short/Stop Long/Stop Short,
et /Open/Close/High/Low )
Chaque label est configurable (visibilité et position sur le graphique).
• Label Trend : indique le nombre d’indicateurs suggérant une même tendance (Long ou Short) ainsi qu’un indice de force (PWR) de cette tendance :
Par exemple : 3 indicateurs en tendance Short, 1 indicateur en tendance Long et 1 indicateur en tendance neutre donnera :
PWR SHORT = 2/4. (3 indicateurs Short – 1 indicateur Long=2 Pwr Short).
Et si PWR=0 alors l’affichage est « Wait and See » (Attendre et Observer).
Il indique aussi quel indicateur actuel est affiché et le mode d’affichage utilisé (combiné 1 à 4 indicateurs ou non combiné ).
• Signal Stop Label : Indique un possible arrêt de la tendance en cours.
• Infos Label (Simple ou complet) donne les infos de tendance de chacun des 4 indicateurs et les infos OHLC du graphique (en mode « Complet »).
Il est possible d’afficher ce même indicateur plusieurs fois sur un graphique (jusqu’à 3 indicateurs max avec le Plan Basic TradingView et plus avec les plans payants), avec des configurations différentes :
Par exemple :
• 1-Stochastique – Signaux Combinés 2/4 – aucun Label affiché
• 1-RSI – Signaux Combinés 3/4 – Label Stop uniquement affiché
• 1-KDJ – Signaux Combinés 4/4 – les 3 Labels affichés
• 1-EMA’3 - Signaux Non combinés (EMA seuls) – Trend Label affiché
Certains indicateurs ont des filtres/seuils (Thresholds) configurables selon votre convenance et votre expérience !
Le choix des couleurs de l’indicateur est adapté pour un graphique avec thème « sombre », qu’il vous faudra probablement modifier pour le confort visuel, si vous utilisez un mode « Clair » ou un mode personnalisé.
Ce script est un indicateur que vous pouvez exécuter sur des types de graphiques standard. Il fonctionne aussi sur des types de graphiques non-standard mais les résultats seront faussés et différents.
Les graphiques Non-standard sont :
• Heikin Ashi (HA)
• Renko
• Kagi
• Point & Figure
• Range
Pour rappel : Aucun indicateur n’est capable de fournir des signaux précis 100% du temps. De temps en temps, même les meilleurs échoueront, vous laissant avec une affaire perdante. Quel que soit l’indicateur sur lequel vous vous basez, n’oubliez pas de suivre les règles de base de gestion des risques et de répartition du capital.
BINANCE:BTCUSDT

Divergence Indicator [Trendoscope®]🎲 New Divergence Indicator by Trendoscope
Our latest Divergence Indicator revolutionizes the way traders identify market trends and potential reversals. Built upon the robust foundation of the Zigzag Trend Divergence Detector and inline with our recent implementation of the Divergence Goggles indicator, this tool is designed to be intuitive yet powerful, making it an essential addition to any trader's toolkit.
We received several queries on extending the Divergence Goggles to last N bars instead of using an interactive widget. Though it is possible, we thought the better approach is to enable the indicator to use any oscillator and trend indicator in order to define the divergence.
🎯 Key Features
Flexible Oscillator Integration : Choose from a wide range of built-in oscillators or import your own, including options like the innovative Multiband Oscillator. This versatility extends to using volume indicators like OBV for divergence calculations, broadening the scope of analysis.
Trend Identification Versatility : Utilize built-in methods like Zigzag and MA Difference, or integrate external trend indicators. Our system adapts to various methods, ensuring you have the right tools for precise trend identification.
Customizable Zigzag Sensitivity : Adjust the Zigzag based on your chosen oscillator's sensitivity to ensure divergence lines are accurate and visually coherent.
Repainting vs. Delayed Signals : Tailor the indicator to your strategy by choosing between immediate repainting signals and slightly delayed but more stable signals.
🎯 Understanding Divergence: Key Rules
Bullish Divergence
Happens only in downtrend
Observed on Pivot Lows
Price makes lower low whereas oscillator makes higher low, indicating weakness and possible reversal
Bearish Divergence
Happens only in uptrend
Observed on Pivot Highs
Price makes higher high whereas oscillator makes lower high, indicating weakness and possible reversal
Bullish Hidden Divergence
Happens only in uptrend
Observed on Pivot Lows
Price makes higher low, whereas indicator makes lower low due to price consolidation. In bullish trend, this is considered as bullish as the price gets a breather and get ready to surge further.
Bearish Hidden Divergence
Happens only in downtrend
Observed on Pivot Highs
Price makes lower high whereas oscillator makes higher high due to price consolidation. In bearish trend, this is considered as bearish as the price gets a breather and get ready to fall further.
🎯 Visual Insights: Divergence and Hidden Divergence
For a clearer understanding, refer to our visual guides:
🎲 Using the Divergence Indicator: A Step-by-Step Guide
🎯 Step 1 - Selecting the Oscillator
Customize your analysis by choosing from a variety of oscillators or importing your preferred one. Options are available to select a range of built-in oscillators and the loopback length. However, if the oscillator that user want to use is not in the list, they can simply load the oscillator from the indicator library and use it as an external signal.
In our current example, we are using a custom oscillator called - Multiband Oscillator
This also means, the indicator option is not limited to oscillators. Users can even make use of volume indicators such as OBV for the calculation of divergence.
🎯 Step 2 - Choosing the Trend Identification Method
Select from our built-in methods or integrate an external indicator to accurately identify market trends. Trend is one of the key parameters of divergence type identification. Trend can be identified mathematically by various methods. Some of them are as simple as above or below 200 moving average and some can follow trend based indicators such as supertrend and others can be very complex.
To cater for a wider audience, here too we have provided the option to use an external trend indicator. The simple condition for the external trend indicator is that it should return positive value for uptrend and negative value for downtrend.
Other than that, we also have 2 built in trend identification methods.
Zigzag - The trend is defined by the starting pivot of divergence line. If the starting pivot is Higher High or Higher Low, then it is considered uptrend. And if the starting pivot is either Lower Low or Lower High, then we consider it as downtrend.
MA Difference - In this case, the difference between the moving average of pivots joining the divergence line will determine the trend. It is considered uptrend if the moving average increased from starting pivot to ending pivot of the divergence line, and it is considered downtrend if the moving average decreased from starting pivot to the ending pivot of the divergence line.
🎯 Step 3 - Adjusting Zigzag Sensitivity
Fine-tune the Zigzag to match the oscillator's sensitivity, ensuring divergence lines are accurate and visually coherent.
🎯 Step 4 - Managing Repainting
Understand the implications of repainting in the last pivot of the Zigzag and choose between immediate or delayed signals based on your trading strategy. The last pivot of the zigzag repaint by design. This is not necessarily a bad thing. Users can just choose not to use the last pivot, but instead use the last but one for all the calculations. But, this also means, the signals will be delayed.
Indicator provides option to use repainting signal vs delayed signal. If you select the repaint option, the signals are shown immediately as and when they occur. But, there is a possibility that these signals change when the new price candles change zigzag pivot.
If you chose not to select the repaint option, then the divergence signals may lag by a few bars.
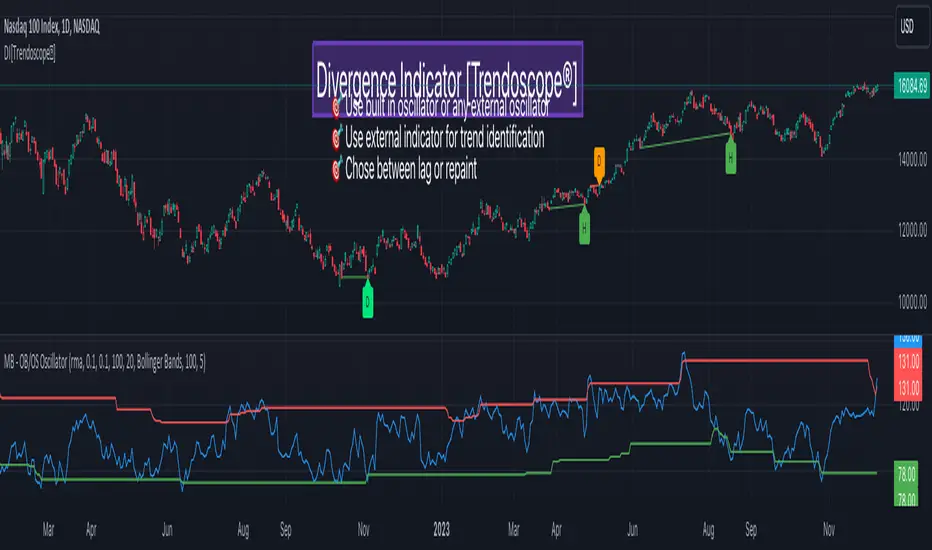
Triple RSI Indicator with ToggleThis script combines three relative strength index (RSI) indicators with different periods, and allows the user to toggle between them to generate overbought and oversold signals. The indicator is named "Triple RSI Indicator with Toggle" and has the short title "TRSI-T."
The input parameters for the RSI periods are set by the user and include a short RSI with a period of 5, a main RSI with a period of 14, and a long RSI with a period of 28. The overbought and oversold levels for each RSI can also be set by the user.
The script plots the three RSI lines on the chart and calculates a bar color based on the enabled RSI values. If all three RSI values are overbought, the bar color is set to fuchsia, if all three RSI values are oversold, the bar color is set to aqua, and if neither of these conditions is met, the bar color is set to not available.
The script also includes a fast RSI and an RSI exponential moving average (EMA) with adjustable periods. The RSI fast line is plotted along with the RSI EMA line, and a cloud fill is generated between the two lines. The fill color is based on whether the fast RSI line is above or below the RSI EMA line, with a blue color used for long signals and a pink color used for short signals.
This indicator can be used as part of a trading strategy in a number of ways. Here are a few examples:
Overbought and Oversold Signals: When the bar color of the indicator is fuchsia, it indicates that all three RSIs are overbought, and when the bar color is aqua, it indicates that all three RSIs are oversold. These signals can be used to enter a trade in the opposite direction, anticipating a reversal in price.
RSI Divergence: Traders can also look for divergences between the price and the RSI values. For example, if the price is making higher highs but the RSI values are making lower highs, it could indicate that the price trend is weakening and a reversal may be imminent. Conversely, if the price is making lower lows but the RSI values are making higher lows, it could indicate that the price trend is about to reverse.
RSI Cloud Signals: The cloud fill generated between the fast RSI and RSI EMA lines can be used to generate trading signals. When the fast RSI line is above the RSI EMA line and the fill color is blue, it can be a signal to go long. When the fast RSI line is below the RSI EMA line and the fill color is pink, it can be a signal to go short.
If anybody has some interesting thoughts on how to improve it, let me know!!
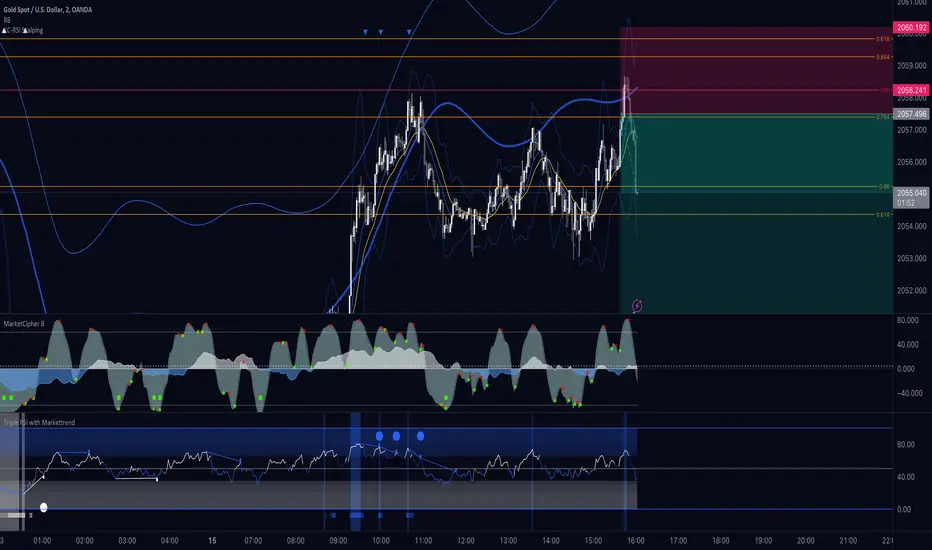
[astropark] MFI divergencesDear Followers,
today a new great Scalper Tool , based on a custom version of Money Flow (MFI) oscillator, which works on both Candlesticks, Heiking Ashi and Renko charts , from 1 second Renko chart and above (on non Renko charts, the higher, the better of course!), both on FOREX, Cryptocurrencies, Stocks and Commodities!
This tool has some cool features:
it works on all timeframes , on both Renko, Heikin Ashi and Candlesticks chart
it shows you both bullish and bearish divergences with a triangle up or down respectively
when it finds a strong bullish/bearish divergence , a flag will be displayed instead of a triangle
it shows you both hidden bullish and bearish divergences with a label "hid"
This script will let you set all notifications you may need in order to be alerted on each triggered divergence.
You may like to use it together with my Renko OBV Divergences indicator (which works on Candlesticks and Heiking Ashi too)
and my Renko RSI Divergences indicator (which works on Candlesticks and Heiking Ashi too)
On Bitmex/ByBit/Binance Bitcoin/USD chart best Renko settings is Traditional Renko chart with 11$ box size, while 0.5$ box size is suggested on Ethereum/USD pair.
This is a premium indicator , so send me a private message in order to get access to this script.
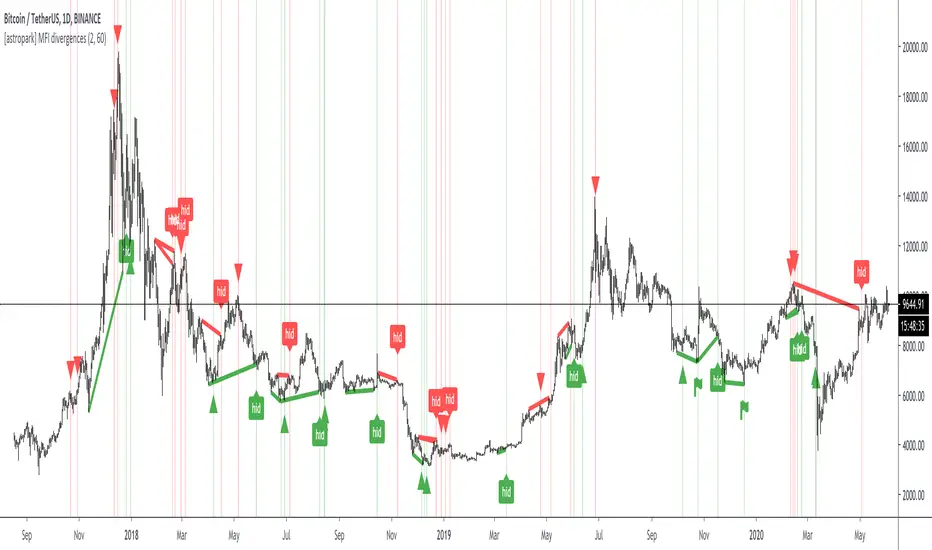
Malama's Dashboard with HeikinMalama's Dashboard with Heikin is a comprehensive trading indicator designed to provide traders with a consolidated view of market sentiment across multiple technical indicators. It combines Ichimoku Cloud, RSI, ADX, Choppiness Index, volume analysis, momentum, divergence detection, and multi-timeframe (MTF) MACD and volume trends to generate a composite sentiment score. The indicator displays these metrics in a visually intuitive table, enabling traders to quickly assess market conditions and make informed decisions. Optionally, it supports Heikin Ashi candles to smooth price data and reduce noise, aiding in trend identification. The script solves the problem of information overload by presenting key indicators in a single, trader-friendly dashboard, reducing the need for multiple charts or indicators.
Originality and Usefulness
This script is a unique mashup of several well-known technical indicators, integrated into a cohesive dashboard with a composite sentiment score. Unlike standalone indicators like RSI or Ichimoku, this script synthesizes signals from Ichimoku Cloud, RSI, ADX, Choppiness, volume, momentum, divergence, and MTF analysis into a unified sentiment metric. The inclusion of Heikin Ashi candles as an optional input adds flexibility for traders preferring smoothed price action. The composite score, derived from weighted contributions of each indicator, provides a novel way to gauge overall market direction, which is not commonly found in public open-source scripts. While individual components like RSI or Ichimoku are widely available, the script’s originality lies in its integrated approach, clear table visualization, and customizable settings, making it a practical tool for traders seeking a holistic market view.
Detailed Methodology ("How It Works")
The script processes multiple technical indicators and aggregates their signals into a composite sentiment score, displayed in a table. Below is a breakdown of its core components and logic:
Heikin Ashi Candles:
Logic: Optionally applies Heikin Ashi calculations to smooth price data. Heikin Ashi candles are computed using formulas for open, high, low, and close prices, reducing market noise and emphasizing trends.
Usage: When enabled, all subsequent calculations (Ichimoku, RSI, ADX, etc.) use Heikin Ashi prices instead of regular OHLC data, potentially improving trend clarity.
Ichimoku Cloud:
Logic: Calculates the Conversion Line (9-period high/low average), Base Line (26-period high/low average), Leading Span A (average of Conversion and Base Lines), and Leading Span B (52-period high/low average).
Signals: Bullish if the close price is above both Leading Spans; bearish if below; neutral otherwise.
Average Directional Index (ADX):
Logic: Computes ADX using a 14-period (default) directional movement index, measuring trend strength. PlusDI and MinusDI are calculated from price movements, and ADX is derived from their difference.
Signals: Bullish if PlusDI > MinusDI; bearish otherwise. ADX value indicates trend strength but is not used directly in sentiment scoring.
Relative Strength Index (RSI):
Logic: Calculates RSI over a 21-period (default) using the closing price. Overbought (>75) and oversold (<25) levels are user-defined.
Signals: Bullish if RSI > 50; bearish if RSI < 50. Overbought/oversold conditions are displayed but not used in the composite score.
Momentum:
Logic: Measures the difference between the current close and the close 10 periods ago (default).
Signals: Bullish if momentum > 0; bearish if < 0; neutral if 0.
Choppiness Index:
Logic: Calculates choppiness over a 14-period (default) using ATR and price range, normalized to a 0–100 scale. Values >61.8 indicate a sideways market; <38.2 indicate a trending market.
Signals: Bullish if choppiness < 38.2; bearish otherwise.
Volume Analysis:
Logic: Compares current volume to a 21-period (default) simple moving average (SMA). Bullish or bearish pressure is determined by whether the close is above or below the open.
Signals: Bullish if volume > 1.2x SMA and bullish pressure dominates; bearish if bearish pressure dominates; neutral otherwise.
Divergence Detection:
Logic: Identifies RSI divergences over a 5-period lookback. A bullish divergence occurs when price makes a lower low, but RSI makes a higher low; bearish divergence is the opposite.
Signals: Bullish or bearish based on divergence detection; neutral if no divergence.
Multi-Timeframe (MTF) Analysis:
Logic: Retrieves daily MACD (12, 26, 9) and volume SMA (21-period) from a higher timeframe. MACD is bullish if the MACD line > signal line; volume is bullish if current volume > daily SMA.
Signals: Bullish or bearish based on MACD and volume trends.
Composite Sentiment Score:
Logic: Aggregates signals from Ichimoku (±2), RSI (±1), ADX (±1), momentum (±1), choppiness (±1), divergence (±1), MTF MACD (±1), and MTF volume (±1). The score ranges from -8 to +8.
Signals: Bullish if score > 0; bearish if < 0; neutral if 0.
Alert Condition:
Triggers an alert when the composite sentiment flips (e.g., from bullish to bearish).
Strategy Results and Risk Management
This script is an indicator, not a strategy, and does not include backtesting or automated trade signals. However, the composite sentiment score can guide trading decisions. Assumptions for practical use include:
Commission and Slippage: Traders should account for realistic trading costs (e.g., 0.1% per trade) when acting on signals, though the script does not model these.
Risk Limits: Traders are advised to risk 5–10% of equity per trade, depending on their strategy and the strength of the composite score (e.g., higher scores may justify larger positions).
Trade Frequency: The script’s signals are based on multiple indicators, ensuring sufficient trade opportunities across trending and ranging markets.
Customization: Traders can adjust risk by modifying input parameters (e.g., RSI overbought/oversold levels or lookback periods) to align with their risk tolerance. For example, tightening RSI thresholds may reduce signal frequency but increase precision.
User Settings and Customization
The script offers several user-configurable inputs, allowing traders to tailor its behavior:
Use Heikin Ashi Candles (Boolean, default: false): Enables/disables Heikin Ashi smoothing for all calculations, affecting trend clarity.
ADX Length (Integer, default: 14, min: 1): Sets the period for ADX calculations, influencing trend strength sensitivity.
RSI Length (Integer, default: 21, min: 1): Adjusts RSI calculation period, impacting overbought/oversold detection.
RSI Overbought Level (Integer, default: 75, min: 1): Sets the RSI overbought threshold.
RSI Oversold Level (Integer, default: 25, min: 1): Sets the RSI oversold threshold.
Volatility Length (Integer, default: 21, min: 1): Controls the ATR period for volatility (used in Choppiness).
Volume MA Length (Integer, default: 21, min: 1): Sets the SMA period for volume analysis.
Momentum Length (Integer, default: 10, min: 1): Defines the lookback for momentum calculations.
Choppiness Length (Integer, default: 14, min: 1): Sets the period for Choppiness Index calculations.
These settings allow traders to adjust the indicator’s sensitivity to market conditions. For example, shorter RSI or ADX periods increase responsiveness but may generate more noise, while longer periods smooth signals but may lag.
Visualizations and Chart Setup
The script plots a table in the top-right corner of the chart, summarizing the following:
Header: Displays “MALAMA’S DASHBOARD” in white text on a black background.
Indicator Rows: Each row corresponds to an indicator (Ichimoku, RSI, ADX, Choppiness, Volume, Momentum, Divergence, MTF MACD, MTF Volume, Composite).
Columns:
Indicator: Lists the indicator name.
Value: Shows the calculated value (e.g., RSI value, composite score) and sentiment (e.g., Bullish, Bearish, Neutral).
Color Coding: Bullish signals are green, bearish signals are red, and neutral signals are gray, all with 85% transparency for readability.
Composite Sentiment: The final row displays the composite score and sentiment, providing a quick summary of market direction.
No trend lines, signal markers, or additional overlays are plotted, ensuring the chart remains uncluttered and focused on the dashboard’s insights.
Market Manipulation DetectorThe Market Manipulation Detector (MMD) is a technical tool designed to identify potential market manipulation attempts. The detector is based on a combination of heuristic techniques that may indicate intentional, non-fundamental movements in a market, potentially led by large entities or "whales".
Key Components:
Pump and Dump Detection: Identifies abnormal price and volume spikes that are indicative of a classic pump and dump.
Price Gap & Volume Correlation: Pinpoints gaps in price that aren't backed by a significant change in volume, indicating potential manipulative intent.
RSI Divergence with Volume: Captures instances where price action diverges from RSI, but volume does not support the divergence, indicating it might be artificially driven.
Whale Watcher: Watches for volume levels that significantly exceed the average, suggesting potential whale activity.
Heuristics:
Volume Spike: When the current volume exceeds the average volume by a multiplier, it may indicate unusual activity.
Price Spike: Unusually large candlesticks, in terms of price movement, can be indicative of potential manipulation.
Gap Without Volume: If the price jumps significantly without a corresponding rise in volume, it could be a sign of artificial movement.
RSI Bullish/Bearish Divergence: This is when the price moves in one direction (e.g., down) but the RSI moves in the opposite direction (e.g., up), and the volume does not support this divergence.
Whale Volume: When the current volume is exceedingly higher than the average, indicating possible large entity trades.
Visualization:
Dots on the chart: These represent potential manipulation events. Green dots signify bullish manipulation attempts, while red dots signify bearish ones.
Histogram: Offers a quick view of the manipulation score. It plots either 0 (no manipulation detected) or 100 (manipulation detected).
Important Note:
While MMD is a powerful tool, it's essential to remember that no indicator is infallible. The detector identifies patterns that could be indicative of market manipulation, but false positives can occur. Therefore, it's crucial to use this tool in conjunction with other technical indicators, fundamental analysis, and sound risk management strategies.

RSI Failure Swings & AO DivergencesHello!
The script identifies RSI divergences, similar to other public scripts; however, RSI failure swings are also distinguished. When a failure swing is identified, the script calculates the highest RSI measurement (bottom failure swing) or the lowest RSI measurement (top failure swing) between the two RSI pivot points. A continually updating line is plotted at the "fail point" until it is penetrated for two sessions! In addition, the script displays the RSI fail point measurement. RSI bearish divergences are only distinguished when both RSI peaks form above 70. bullish divergences are only distinguished when both RSI troughs form below 30. Top failure swings require the initial RSI peak be above 70, the second RSI peak can form at any measurement. Bottom failure swings require the initial RSI trough be below 30, the second RSI trough can form at any measurement.
Included are Awesome Oscillator divergences. The indicator is a bit tricky; the oscillator does not incorporate an upper or lower extremity. Consequently, the script uses interpolated percentiles to characterize relatively high measurements and relatively low measurements. Bearish divergences that form within the 90th - 99th percentile are distinguished, and bullish divergences that form within the 1 - 10th percentile are distinguished. This can CERTAINLY be changed should you copy the source code and think of something better! For AO, white columns reflect a difference measurement >= 0; black bars reflect a difference measurement < 0

(JS) Ultimate RSISo my goal here was to combine all of my RSI ideas into a single indicator in order to make kind of a "Swiss Army Knife" version of the Relative Strength Index ...
------------------------------------------------------------------------------------------------------------------------------------------------------------------------------------------------------------------------------------------------------------------
So, let's begin with the first RSI indicator I made, which is the RSIDVW (Divergence/Volume Weighted);
To rephrase my original post, the "divergence/volume weighted" portion is meant to expand upon the current RSI format by adding more variables into the equation.
The standard RSI is based off one value that you select (open, close, OHLC4, HLC3, etc.) while this version takes three variables into account.
The default setting is to have RSI normal without anything added to it (Divergence Weight = 0)
1st - it takes the standard variable that RSI normally uses.
2nd - it factors RSI divergence by taking the RSI change % and price change % to form a ratio. Using this ratio, I duplicated the RSI formula and created a divergence RS to be factored in with the standard price RS .
3rd - it takes Relative Volume and amplifies/weakens the move based upon volume confirmation. (So if Relative Volume for a price bar is 1.0, the RSI plot would be the same as it normally would)
So to explain the parameters
- Relative Volume Length: This uses the RV length you specify to determine spikes in volume (or lack of volume ), which then is added into the formula to influence the strength of the RSI move
- RV x Divergence: This is how I calculated the original formula, but you can leave this unchecked to turn Relative Volume off, or apply elsewhere.
- RV x RS: There's two sides, Divergence RS and Standard RS - these check marks allow you to select which part you prefer to be multiplied by Relative Volume .
Checking neither turns off Relative Volume , while checking both amplifies its effects by placing it on both sides of the equation.
-Divergence Weight: This controls how much the DVW portion of the formula influences the RSI plot. As I referred to earlier, default is 0 making RSI normal. The Scale is 0-2, so 1.0 would be the same as 50%.
When I do have DVW on, I generally set it to 0.5
-SMA Divergence: To smooth, or not to smooth, that is the question. UJsing an SMA here is much smoother in my opinon, but leaving it unchecked runs it through an RMA the same way standard RSI is calculated.
-Show Fractal Channel: This allows you to see the whole fractal channel around the RSI (This portion of the code, compliments of the original Ricardo Santos fractal script)
------------------------------------------------------------------------------------------------------------------------------------------------------------------------------------------------------------------------------------------------------------------
The next portion of the script is adding a "Slow RSI"...
This is rather simple really, it allows you to add a second RSI plot so that you can watch for crossovers between fast and slow lines.
-Slow RSI: This turns on the second RSI Plot.
-Slow RSI Length: This determines the length of the second RSI Plot.
------------------------------------------------------------------------------------------------------------------------------------------------------------------------------------------------------------------------------------------------------------------
Pivot Point RSI was something a friend of mine requested I make which turned out pretty cool, I thought... It is also available in this indicator.
-Pivot Points: Selecting this enables the rest of the pivot point related parts of the script
If Pivot Points isn't selected, none of the following things will work
-Plot Pivot: Plots the pivot point .
-Plot S1/R1: Plots S1/R1.
-Plot S2/R2: Plots S2/R2.
-Plot S3/R3: Plots S3/R3.
-Plot S4/R4: Plots S4/R4.
-Plot S5/R5: Plots S5/R5.
-Plot Halfway Points: Plots a line between each pivot .
-Show Pivot Labels: Shows the proper label for each pivot .
When using intraday charts, from a 15 minute interval or less the pivots are calculated based on a single days worth of price action, above that the distance expands.
Here are the current resolutions Pivot Points will work with:
Minutes - 1 , 2, 3, 5, 10, 13, 15, 20, 30, 39, 78, 130, 195
Hours - 1, 2, 3, 4, 5, 6
Daily
Weekly
Currently not available on seconds or monthly
------------------------------------------------------------------------------------------------------------------------------------------------------------------------------------------------------------------------------------------------------------------
Background Colors
Background Colors: I have six color schemes I created for this which can be toggled here (they can be edited).
Gray Background for Dark Mode: Having this on looks much better when using dark mode on your charts.
------------------------------------------------------------------------------------------------------------------------------------------------------------------------------------------------------------------------------------------------------------------
Now finally the last portion, Fibonacci Levels
-Fibonacci Levels: This is off, by default, which then uses the standard levels on RSI (30-50-70). When turned on, it removes these and marks fib levels from 0.146 through 0.886.
------------------------------------------------------------------------------------------------------------------------------------------------------------------------------------------------------------------------------------------------------------------
So the quick rundown:
Ultimate RSI contains "divergence/volume weighted" modifications, a slow RSI plot, pivot points , and Fibonacci levels all while auto-plotting divergence and having the trend illustrated in the background colors.
RSI has always been my "go to" indicator, so I hope you all enjoy this as much as I do!

RSX-D [ID: AC-P]The "AC-P" version of Jaggedsoft's RSX Divergence and Everget's RSX script is my personal customized version of RSX with the following additions and modifications:
LSMA-D line that averages in three LSMA components to form a composite, the LSMA-D line. Offset for the LSMA-D line is set to -2 to offset latency from averaging togther the LSMA components to form a composite - recommended to adjust to your timeframe and asset/pair accordingly.
Divergence component from JustUncle, RicardoSantos, and Neobutane divergence scripts
Crossover indication and alerts for Midline, and custom M1 and M2 levels for both RSX and the LSMA-D line from Daveatt's CCI Stochastic Script
EMA21/55 zone cross highlighting option
SMA9/EMA45 MA option from my RSI sma/ema Cu script
Libertus Divergences and Pivot labels from Jaggedsoft's RSX Divergence script are hidden/off by default
Designed for darkmode by default. Minor visual changes from Jaggedsoft's and Everget's script(s) for darkmode and visual aesthetic.
Please Note:
Divergences that use fractal-based detection logic, offset, or a combination of both generally have a 1-2 bar/candle lag. This is an INHERENT limitation of divergence detection with fractals and offsets. Divergences generally will have a higher strikerate on HTF than LTF due to the 1-2 bar lag. While I'm not going to rule out a programming solution or math construct/formula that attempts to alleivates the 1-2 bar lag for divergences, this script is not it - please keep that in mind when using divergence components with a fractal base and offset.
LSMA-D is a composite of three LSMA lines, all with offset options. Different lengths and Offset values can compensate/adjust for the smoothing/latency from RSX, but only up to a certain point. For each LSMA, the least square regression line is calculated for the previous time periods, so the idea is that with finely tuned adjustments, you can get crossover/crossunder signals from the RSX with the LSMA-D line that you simply can't get with the SMA9/EMA45 due to the already smoothed RSX.
The defaults for the RSX and various components for the LSMA-D here will MOSTLY LIKELY NOT WORK OR BE APPLICABLE to every timeframe and asset that you trade - adjust, backtest, and test accordingly. The defaults are here are MEANT to be adjusted to the asset class and timeframe that you are trading.
If you're not familiar with the LSMA, tradingview author Alexgrover has a few great scripts that go into detail how the LSMA works, in addition to different interpretations and implementations of the LSMA.
References/Acknowledgements:
//@version=4
// Copyright (c) 2019-present, Alex Orekhov (everget)
// Jurik RSX script may be freely distributed under the MIT license.
//
//-------------------------------------------------------------------
// Acknowledgements:
//---- Base script:
// RSX Divergence — SharkCIA by Jaggedsoft
//
// Jurik Moving Average by Everget
//
//---- Divergences/Signals:
// Libertus RSI Divergences
//
// Price Divergence Dectector V3 by JustUncle
//
// Price Divergence Detector V2 by RicardoSantos
//
// Stochastic RSI with Divergences by Neobutane
//
// CCI Stochastic by Daveatt
//
//---- Misc. Reference:
// RSI SMA/EMA Cu by Auroagwei
//
// CBCI Cu by Auroagwei
//
// Chop and explode by fhenry0331
//
// T-Step LSMA by RafaelZioni
//
// Scripts by Jaggedsoft for structure and formatting
// Scripts by Everget for structure and formatting
//-------------------------------------------------------------------
// RSX-D v08
// Author: Auroagwei
// www.tradingview.com
//-------------------------------------------------------------------