OPEN-SOURCE SCRIPT
Güncellendi Triple RSI Indicator with Toggle
This script combines three relative strength index (RSI) indicators with different periods, and allows the user to toggle between them to generate overbought and oversold signals. The indicator is named "Triple RSI Indicator with Toggle" and has the short title "TRSI-T."
The input parameters for the RSI periods are set by the user and include a short RSI with a period of 5, a main RSI with a period of 14, and a long RSI with a period of 28. The overbought and oversold levels for each RSI can also be set by the user.
The script plots the three RSI lines on the chart and calculates a bar color based on the enabled RSI values. If all three RSI values are overbought, the bar color is set to fuchsia, if all three RSI values are oversold, the bar color is set to aqua, and if neither of these conditions is met, the bar color is set to not available.
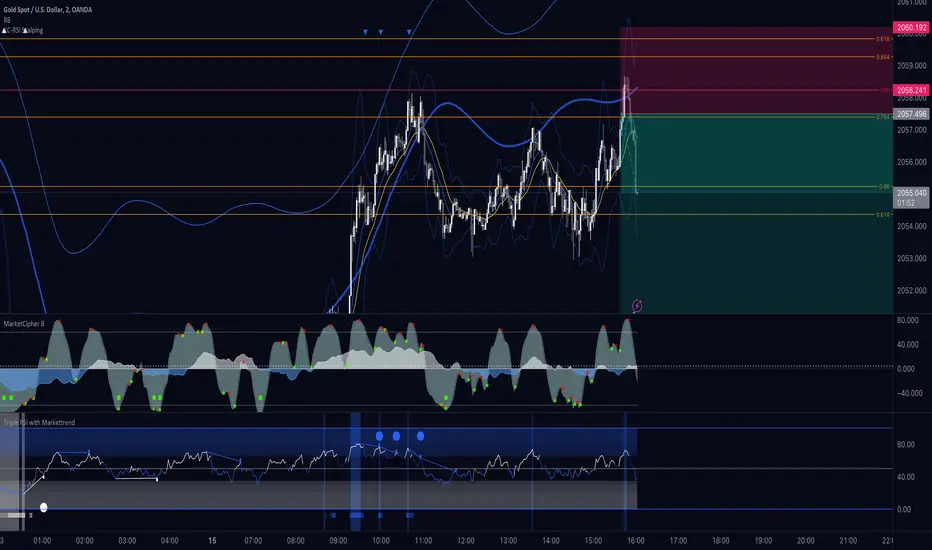
The script also includes a fast RSI and an RSI exponential moving average (EMA) with adjustable periods. The RSI fast line is plotted along with the RSI EMA line, and a cloud fill is generated between the two lines. The fill color is based on whether the fast RSI line is above or below the RSI EMA line, with a blue color used for long signals and a pink color used for short signals.
This indicator can be used as part of a trading strategy in a number of ways. Here are a few examples:
Overbought and Oversold Signals: When the bar color of the indicator is fuchsia, it indicates that all three RSIs are overbought, and when the bar color is aqua, it indicates that all three RSIs are oversold. These signals can be used to enter a trade in the opposite direction, anticipating a reversal in price.
RSI Divergence: Traders can also look for divergences between the price and the RSI values. For example, if the price is making higher highs but the RSI values are making lower highs, it could indicate that the price trend is weakening and a reversal may be imminent. Conversely, if the price is making lower lows but the RSI values are making higher lows, it could indicate that the price trend is about to reverse.
RSI Cloud Signals: The cloud fill generated between the fast RSI and RSI EMA lines can be used to generate trading signals. When the fast RSI line is above the RSI EMA line and the fill color is blue, it can be a signal to go long. When the fast RSI line is below the RSI EMA line and the fill color is pink, it can be a signal to go short.
If anybody has some interesting thoughts on how to improve it, let me know!!
The input parameters for the RSI periods are set by the user and include a short RSI with a period of 5, a main RSI with a period of 14, and a long RSI with a period of 28. The overbought and oversold levels for each RSI can also be set by the user.
The script plots the three RSI lines on the chart and calculates a bar color based on the enabled RSI values. If all three RSI values are overbought, the bar color is set to fuchsia, if all three RSI values are oversold, the bar color is set to aqua, and if neither of these conditions is met, the bar color is set to not available.
The script also includes a fast RSI and an RSI exponential moving average (EMA) with adjustable periods. The RSI fast line is plotted along with the RSI EMA line, and a cloud fill is generated between the two lines. The fill color is based on whether the fast RSI line is above or below the RSI EMA line, with a blue color used for long signals and a pink color used for short signals.
This indicator can be used as part of a trading strategy in a number of ways. Here are a few examples:
Overbought and Oversold Signals: When the bar color of the indicator is fuchsia, it indicates that all three RSIs are overbought, and when the bar color is aqua, it indicates that all three RSIs are oversold. These signals can be used to enter a trade in the opposite direction, anticipating a reversal in price.
RSI Divergence: Traders can also look for divergences between the price and the RSI values. For example, if the price is making higher highs but the RSI values are making lower highs, it could indicate that the price trend is weakening and a reversal may be imminent. Conversely, if the price is making lower lows but the RSI values are making higher lows, it could indicate that the price trend is about to reverse.
RSI Cloud Signals: The cloud fill generated between the fast RSI and RSI EMA lines can be used to generate trading signals. When the fast RSI line is above the RSI EMA line and the fill color is blue, it can be a signal to go long. When the fast RSI line is below the RSI EMA line and the fill color is pink, it can be a signal to go short.
If anybody has some interesting thoughts on how to improve it, let me know!!
Sürüm Notları
The "Triple RSI Indicator with Market Trend" is a sophisticated and versatile tool designed for traders who seek an in-depth analysis of market dynamics using the Relative Strength Index (RSI). This indicator enhances the traditional RSI by incorporating three different RSI lengths, which can be tailored to the trader's strategy. It's ideal for those who want a nuanced view of the market's momentum and potential reversal points.Key Features:
Triple RSI Analysis: Integrates three RSIs with customizable lengths, offering a layered view of market momentum at different timeframes.
Adaptable to Market Trends: Adjusts overbought and oversold levels based on the selected market condition (Bullish, Bearish, or Ranging), making it highly responsive to varying market dynamics.
Customizable Thresholds: Users can define unique overbought and oversold thresholds for each RSI, providing tailored signals that align with their trading strategy.
Divergence Detection: Highlights divergences for each RSI, an essential feature for identifying potential price reversals and trend weaknesses.
Visual Clarity: Clearly plots the RSI values with distinct colors and lines, ensuring easy interpretation of market conditions. Bullish and bearish divergences are visually represented for quick analysis.
Real-time Alerts: Offers alert conditions for overbought and oversold scenarios, allowing traders to stay informed of significant market movements.
Flexible and User-friendly: Comes with an intuitive interface and customizable settings, making it suitable for both novice and experienced traders.
Benefits:
Enhanced Market Insight: By analyzing multiple RSIs, traders gain a deeper understanding of market momentum and potential turning points.
Adaptability: The indicator's responsiveness to different market conditions makes it a reliable tool in varying market scenarios.
Informed Decision Making: Divergence detection and tailored alerts aid in making well-informed trading decisions.
Whether you're a day trader, swing trader, or long-term investor, our "Triple RSI Indicator with Market Trend" is designed to enhance your trading strategy by providing comprehensive insights into market behavior.
Sürüm Notları
added MTF overbought oversold signal for triple rsi.and added alert conditions
Açık kaynak kodlu komut dosyası
Gerçek TradingView ruhuna uygun olarak, bu komut dosyasının oluşturucusu bunu açık kaynaklı hale getirmiştir, böylece yatırımcılar betiğin işlevselliğini inceleyip doğrulayabilir. Yazara saygı! Ücretsiz olarak kullanabilirsiniz, ancak kodu yeniden yayınlamanın Site Kurallarımıza tabi olduğunu unutmayın.
Feragatname
Bilgiler ve yayınlar, TradingView tarafından sağlanan veya onaylanan finansal, yatırım, işlem veya diğer türden tavsiye veya tavsiyeler anlamına gelmez ve teşkil etmez. Kullanım Şartları'nda daha fazlasını okuyun.