"renko" için komut dosyalarını ara


Renko RSI trend - StrategyThis strategy takes advantage of Renko chart's noise cancelling and follows the trend accordingly.
Without fundamentals, mean reversion and trend following are the only two wakes to make consistent profits (disregarding high frequency market making and stat-arb)
so here it is, a simple strategy that will bring dollar bills.
Commission : 0.075%
Slippage : 10 ticks

Renko Magic - StrategyThis strategy uses the Renko Candle's trend change and follows it with a trend.
Applied 10 ticks of slippage and Bitmex's market order commission.
Last Updated June 7th 2019.


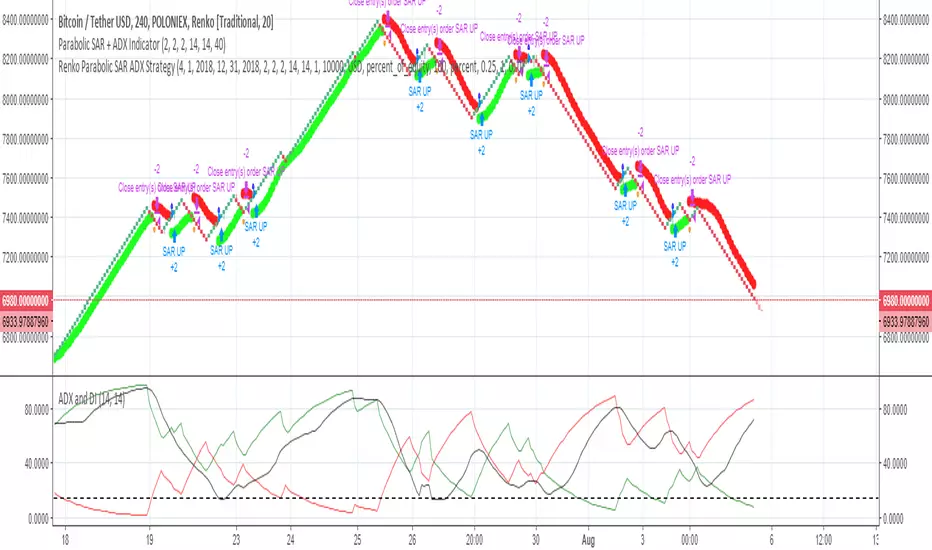
Renko Parabolic SAR + ADX Indicator (Need help on the alert)//This script is made using scripts by other authors. All credit goes to them. I am only copying snippets and making it work for me//
Problem Statement:
The script seems to work best using a fixed renko brick. The indicators do work but I have problems with the alert.
What often happens is, the signal appears (condition is met) BRIEFLY as the bar forms, it disappears a few seconds later, but the alert is still sent on the close of the bar.
I wish to receive these alerts on the close of a bar only if the condition is still met on the close of the bar
I am hoping someone can guide or fix the alertcondition such that it checks for the firmed signal before triggering the alert.
POLONIEX:BTCUSDT
[RENKO] [MAGIC] SLOW & FAST /w ALEART !!!!!!!!!! TEST previously created by vacalo69 !!!!!!!
NO LAG and NO REPAINT
On Renko chart with alert which works on Autoview
In backtest result $ value is equivalent to BTC
i have set the value as it shows in BTC with commission of 0.075%
This chart is BITMEX:LTCU18


Renko Pyramiding Strategy, Real-TimeReal-time version of our private Renko strategy, also added max position size and long/short enable/disable.


Renko with custom sourceThe script allows you to set custom date source for Renko chart through Format dialog.

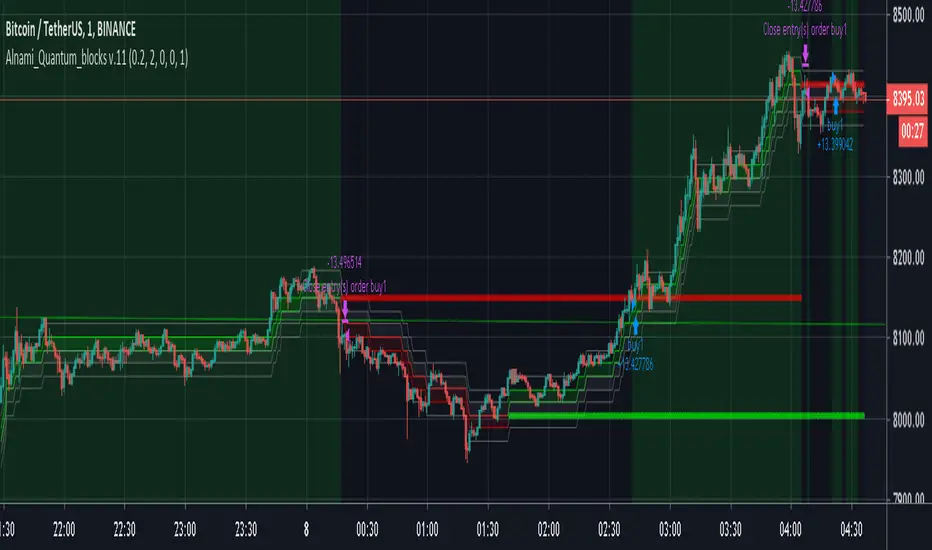
Alnami_Quantum_blocks v.11The (Al Nami Quantum Blocks v.11) script is based on Renko chart that is based on % move of the selected symbol. This is different from the traditional or ATR based Renko charts..
box size = user selected percentage x current price
Alnami Quantum Blocks Channel is composed of 5 levels that are calculated based on the box size:
1- Base
2- Green Box High (GBH) = Base + box size
3- Next Green Box trigger (GBN) = base + (box size x 2)
4- Red Box Low ( RBL ) = Base - box size
5- Next Red Box trigger ( RBN ) = base - (box size x 2)
Those levels will appear in the chart with the following order:
------GBN-------
------GBH-------
------BASE------
------RBL-------
------RBN-------
Usually when prices are trending up, the price will stay above the base for most of the time,, when it trending downwards, price stays below base most of the time..
Now how to time your entries based on the channel?
This strategy draws two levels, breakout level (top red line) and stop level (bottom green line).
If the price is above red line, place a buy order
If the price is below the green line, place a sell order
In version 11 of the Quantum blocks, you can choose to make the those two lines drawn using:
recent/near term price actions (less accurate) and fast - set the number of Legs to low value
or
wider term price actions (more accurate) and slow - set the number of Legs to high value
This version also tracks the last three changes for the red and green lines as following:
1- Above, Above, Above = 3
2- Above, Above, Below = 2
3- Above, Below, Below = 1
4- Below, Below, Below = 0
I did run full optimization for the settings of this strategy on Bitcoin (Binance:BTCUSDT) for the following multiple time frames using Amibroker scrips and data downloaded from Binance through a REST API call. The TFs were for 1min, 15min, 30min, 45min, 90min, 120min, 180min, and 240min.
pair Input Settings
btc TF Profit% Sys DD% Trade DD% sharpe% # Trades Win% Wave% # of Legs up lo
1 204 40.16 15.04 1.33 132 40.15 1.5 4 3 3
15 249 35 14.3 2.96 35 51.43 1.8 3 1 3
30 469 28.95 14.04 3.82 34 67.65 1.4 3 1 3
45 712 54.48 23.3 2.49 46 54.35 1.7 3 3 3
90 1114 40.51 21.41 3.3 48 54.17 1.4 2 3 3
120 602 25.32 16.8 2.82 51 43.14 1.2 2 3 3
180 960 35.9 20.09 3.33 42 52.38 0.9 2 2 3
240 819 46.84 28.27 3.48 46 65.22 0.6 2 3 3
I spent a lot of time and resource in providing the above, If this script/back tests helped in making some profits, then kindly express your appreciation and support to this work by sending some altcoins to any of the following wallets, this will encourage me sharing more stuff with the public:
BTC : 15VLCLZRkEhhZn6E4gNjMLVYnmCcUzKvWU
LTC : LN6mE6aZhEqVVfssmaQ3kk8PPspWQ5wToy
ETH : 0x7901035f2b6f334fa404d0ceb187d7bfcfdb72ce
MM CHEATCODE V2The Best Renko system out there. The second coming to the original Cheatcode Algo we made
with options to use Tradition point calculations or ATR values for price measurement
- Select up to 3 tp levels
- ATR Risk calculator
- Strategy presets for easy setting selection for certain assets
- A trailing Ma for stint entries filters
- Volatility bands (BB, Kentler,Donchain)
- ATR super trend for added trend & trade filter
- MTF filter (up to 3)
- Added Session display as well as strict filter to only trade during that session(s) selected
- Full signal Alerts (meaning the full signal will send Entry, TP, Sl )
- added MM Capo volatility filter
Also Have Automation Version Available
How to use
You can use a setting preset in for the asset selected and the settings will automatically adjust but won't apply to your setting screen. (Tradingview limitations)
For the most part the buy signal will plot when the ATR moves in up/down direction
Filter your trades with the various trend detections indicators added when they all line up you have the best probability for the trade.
Renko is the best way to trade basic market structure and now with all the confirmation you need.
ALL Links below or PM us for access to this indicator Happy Trading

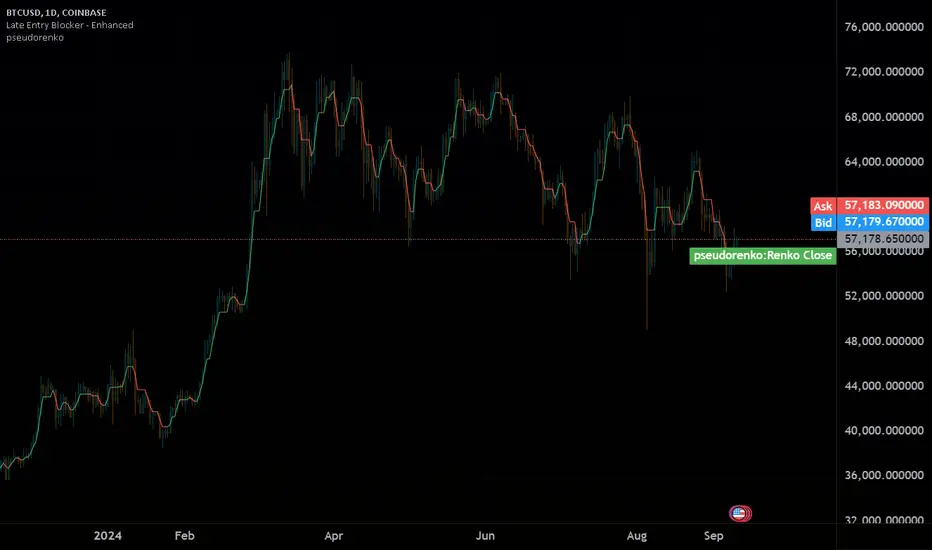
pseudorenko█ CALCULATE PSEUDO-RENKO VALUE
Calculates and returns the Pseudo-Renko Stabilized value (or close price) based on a given input value, along with the direction of the current Renko brick. This function adapts the traditional Renko brick size dynamically based on the volatility of the input value using a combination of SMA and EMA calculations. The calculated price represents the closing price of the most recent Pseudo-Renko brick, while the direction indicates the trend ( 1 for uptrend, -1 for downtrend).
Parameters:
* `val` :
* Type: ` float `
* Description: The input value upon which the Pseudo-Renko calculations are performed. You can use any price series or custom value as input.
* `sensitivity` :
* Type: ` float `
* Default Value: ` 1.0 `
* Description: Controls the sensitivity of the brick size to the volatility of the `val`. Higher values lead to larger bricks, resulting in a smoother Renko chart. Lower values produce smaller bricks, leading to a more reactive chart.
* Possible Values: Any positive float.
* `length` :
* Type: ` int `
* Default Value: ` 7 `
* Description: The length used for calculating the EMA and SMA in the dynamic brick size calculation. It influences how quickly the brick size adapts to changing volatility of the `val`.
* Possible Values: Any positive integer.
Return Values:
* `lastRenkoClose` :
* Type: ` float `
* Description: The closing price of the last completed Pseudo-Renko brick based on the `val`.
* `renkoDirection` :
* Type: ` int `
* Description: The direction of the current Pseudo-Renko brick based on the `val`:
* ` 1 `: Uptrend
* ` -1 `: Downtrend
* ` 0 `: No change (initially, or no brick change since the previous bar)
Example Usage:
//@version=5
indicator("Pseudo-Renko Stabilized (Val)", overlay=true)
// Get user inputs
sensitivityInput = input.float(0.1, "Sensitivity",0.01,step=0.01)
lengthInput = input.int(5, "Length",2)
// Example usage with the 'close' price as the input value
= pseudo_renko(math.avg(close,open), sensitivityInput, lengthInput)
// Plot the Renko close price
plot(renkoClose, "Renko Close", renkoDirection>0?color.aqua:color.orange,2)
// You can also use other values as input, such as:
// = pseudo_renko(high, sensitivityInput, lengthInput)
// = pseudo_renko(low, sensitivityInput, lengthInput)
This example demonstrates how to use the `pseudo_renko` function within an indicator. It takes user inputs for `sensitivity` and `length`, then calculates the Pseudo-Renko values using the average of the `close` and `open` prices as the `val`. The resulting `renkoClose` price is plotted on the chart, with a color change based on the `renkoDirection`. It also illustrates how you can use other values, like `high` and `low`, as input to the function.
Note: The Pseudo-Renko algorithm is based on adapting the Renko brick size dynamically based on the input `val`. This provides more flexibility compared to the normal, but is experimental. The `sensitivity` and `length` parameters, along with the choice of the `val`, offer further customization to tune the algorithm's behavior to your preference and trading style.
TrendMaster Gold, v. 6.2xTrendMaster Gold
The ultimate refinement of last year’s TrendMaster system, TrendMaster Gold takes deep pattern recognition to a new level tracking over 20 indicators triggering seven decision gates to trade in a Renko-smoothed charting environment. Optimized for higher returns over a wider range of instruments (see returns below), you are invited to trial this market-mirroring engine. Subscribers receive full breakdown for fine-tuning results to their market favorites while avoiding bot traps. Reach out by message to get your free trial. We are always available for questions, comments, and suggestions. There’s always room for improvement.
Results Chart
The backtests below show 1-year returns against a Buy and Hold (B+H) approach for 40 of the world’s top traded instruments (as measured by price volume or similar indicator). The TrendMaster system was run on the top 10 instruments in each of four major markets: Equities, ETFs, Cryptocurrencies, and Forex. All tests were on a 30min chart, set to Renko “Traditional” blocks (because TradingView does not support realtime alerts from ATR-based charts). Block size was set proportionately to price to give the instrument positive results, but there was no “cherry-picking”. (In fact, changing time frames would have produced even better returns in some cases, but it seemed best to use a consistent measure.) Subscribers to the system receive a full, step-by-step breakdown on how to customize the parameters to get the best from their favorite markets.
(For each instrument, you see listed its Symbol (name), Profit % (annual return using TrendMaster Gold), Winning Trade % (being “right”), ProfitFactor (Ratio of money won to money lost), Max Draw Down % (point of worst % loss during the year), and B+H (how much the asset would have returned with no trades, via "buy-and-hold" )...)
TrendMaster Gold
Settings: 30 min, Traditional Renko box, over 1 year (June 1, 2018 - June 1, 2019)
EQUITIES
Symbol Profit % Trade % PF Max DrDn B + H
AMZN 2,212 62 6.6 3 7
AAPL 158 49 3.7 5 5
TSLA 8,263 57 5 6 -38
FB 179 47 3 8 -7
BABA 247 56 3.4 9 -23
BYND 348 67 17.9 6 140
MSFT 224 58 6.8 3 28
AMD 171 50 2.6 13 0
NFLX 2,132 55 5.2 11 -5
BA 560 54 4.9 3 97
ETFs
Symbol Profit % Trade % PF Max DrDn B + H
SPY 275 64 5.5 3 4
QQQ 865 62 6.1 3 5
EEM 278 60 5.3 2 0
IWM 783 61 6.1 2 -3
HYG 21 51 2.7 1 0.5
EWZ 798 58 5.6 5 26
LQD 12 54 2 1 6
EFA 121 61 4.5 2 -7
FXI 391 63 5.4 3 -15
XLF 200 58 3.4 5 -3
CRYPTOCURRENCIES
Symbol Profit % Trade % PF Max DrDn B + H
BTC/USD 3 million 55 4.7 8 -8
ETH/USD 2 million 52 4.9 21 -54
XRP/USD 6 million 52 4 13 -16.6
LTC/USD 222,000 54 3 13 13
BCH/USD 380,000 54 4.6 28 -5
EOS/USD 147,000 55 2.7 20 13
BNB/USDT 2 million 54 4.4 14 143
BSV/USD 334,000 65 18 5 -8
XLM/USD 34 million 51 2.8 12 34
ADA/USD 48,000 64 7 6 3
FOREX PAIRS
Symbol Profit % Trade % PF Max DrDn B + H
EUR/USD 13 41 1.3 5 -4
USD/JPY 3 37 1.1 4 -1
AUD/USD 24 43 1.4 4 10
USD/CAD 20 43 1.7 4 3
GBP/USD 36 46 1.8 2 -5
NZD/USD 21 47 1.6 2 -6
GBP/JPY 40 42 1.6 2 -6
EUR/JPY 18 54 3.2 2 -5
AUD/JPY 47 44 1.8 5 -10
EUR/GBP 17 46 1.7 4 0.1

KTS 0.1a [BETA]VERY early release of KTS for those who have contributed to the early efforts of the upcoming Kawaii Trading Suite package.
When you first add this to a chart- nothing will happen. You need to enable the features you want in the indicator's settings menu. Many of these are based off of indicators i've already published (and are linked for in-depth description). The following features available:
Daily Support/Resistance levels
Hourly Support/Resistance levels
General Support/Resistance levels
The three above use the same algorithm but are designed for different timeframes.
Renko Bar Overlay (overlays a Renko chart on any timeframe you want)
Renko Signal Overlay (for those who want to know when renkos go green/red without the giant overlay)
The two above indicators use 1D renkos by default (since that's the shortest TV lets free accounts use) but you can use any timeframe you wish in settings.
Alt Sentiment Signal overlay (Simple up/down arrow when altcoin sentiment changes)
Witchcraft support/resistance clouds (can be toggled individually)
Planned but not-yet-finished features include:
Ichimokou Clouds
Golden Cross signal
Plus many more things I haven't posted anywhere else yet. Be aware that beyond this point, anyone wishing to try this product will have to pay a reasonable fee. Please do not message me asking for access to private indicators if you have no intention of paying for them.

The Quantum Leap: Renko + ML(Note: This indicator uses the BackQuant & SuperTrend which takes a 4-5 seconds to load)
This strategy uses the following indicators (please see source code)
Synthetic Renko: Ignores time and focuses purely on price movement to detect clear trend reversals (Red-to-Green).
ATR (Average True Range): Measures volatility to calculate the Renko brick sizes and SuperTrend sensitivity.
Adaptive SuperTrend: A trend filter that uses volatility clustering to confirm if the market is currently in a "Bearish" state.
RSI (Relative Strength Index): A momentum gauge ensuring the asset is "Oversold" (exhausted) before we consider a setup.
Monthly Pivots: Horizontal support lines based on last month's data acting as price "floors" (S1, S2, S3).
SMA (Simple Moving Average): A 100-bar average ensuring we are strictly buying below the long-term mean (deep value).
BackQuant (KNN): A Machine Learning engine that compares current data to historical patterns to predict immediate momentum.
This is a sophisticated, multi-stage strategy script. It combines "Old School" price action (Renko) with "New School" Machine Learning (KNN and Clustering).
Here is the high-level summary of how we will break this down:
Topic 1: The "Bottom Hunter" Setup. How the script uses Renko bricks and aggressive filtering (SuperTrend, SMA, RSI, Pivots) to find a potential market bottom.
Topic 2: The ML Engine (BackQuant & SuperTrend). How the script uses K-Nearest Neighbors (KNN) to predict momentum and Volatility Clustering to adjust the SuperTrend.
Topic 3: The "Leap" Execution. How the script synchronizes the Setup (Topic 1) with the ML Trigger (Topic 2) using a time window.
Topic 1: The "Bottom Hunter" Setup
This script is designed as a Mean Reversion strategy (often called "catching a falling knife" or "bottom fishing"). It is trying to find the exact moment a downtrend stops and reverses.
Most strategies buy when price is above the 200 SMA or above the SuperTrend. This script does the exact opposite.
The Logic:
Renko Bricks: It simulates Renko bricks internally (without changing your chart view). It waits for a specific pattern: A Red Brick followed immediately by a Green Brick (a reversal).
The "Bearish" Filters: To generate a "WATCH" signal, the following must be true:
Price < SuperTrend: The market must officially be in a downtrend.
Price < SMA: Long-term trend is down.
Price < Monthly Pivot: Price is deeply discounted.
RSI < Threshold: The asset is oversold (exhausted).
Recommended Settings for daily signals for Stocks :
Confirmation : 10. (How many bars after Renko Buy signal the AI has to identify a bullish move).
Percentage : 2 (This is the Renko bar size. This represents 2% move.)
SMA: 100 (Signal must be found below 100 SMA)
Price must be below: PIVOT (This is the monthly Pivot levels)

Flex Renko Emulator Strategy by Zack_The_LegoThe author of the study is Zack_The_Lego but i made it into a strategy because its an awesome study by him.

ST15 Renko S/R V1I use this as part of a larger Renko scalping system to help find key S/R usually when placing TPs. I enjoy using it with 2 pip ATR renkos, but I think with a little tweaking it could work with many different trading styles. For 2 or 5 pip atr renkos it is as simple as putting it up on the chart. Hope it helps, thank you!!

Psychlogical TP Levels Indicator V 1This indicator works based on the Average True Range and Renko Charts.
The Renko charts are a perfect way to observe the market trend without noise.
From the image below, you can see that as long as the market is bullish, the Renko chart remains green, and when the market turns from bullish to bearish, the Renko chart also changes its direction. As can be seen in the image below
This indicator allows you to view the clear trend in the market.
Inside the indicator's settings, you can change the ATR Period you want. By default, it is set to 14.
Applying the indicator to charts will plot areas of two colours in a separate window. You have to pay attention to when the indicator changes its colour.
An important thing you need to understand is The psychological indicator is not a buy/sell indicator. It means you’ll not use it for opening a buy/sell trade. You’ll use it for Taking Profit levels only.
Here is how you can use the indicator to decide the take profit levels.
You can open your buy trades with any strategy you use. When you open your trade, you should pay attention to the colour or Psychological Indicator. Now, as the market goes up, you should wait for the indicator to turn from green to red, and when that happens, this will signal to close the trade.
Similarly, for short positions, you can open your sell trades with any strategy you use. When you open your trade, you should pay attention to the colour or Psychological Indicator. Now, as the market goes down, you should wait for the indicator to turn from red to green, and when that happens, this will signal to close the trade. Please check the image below.

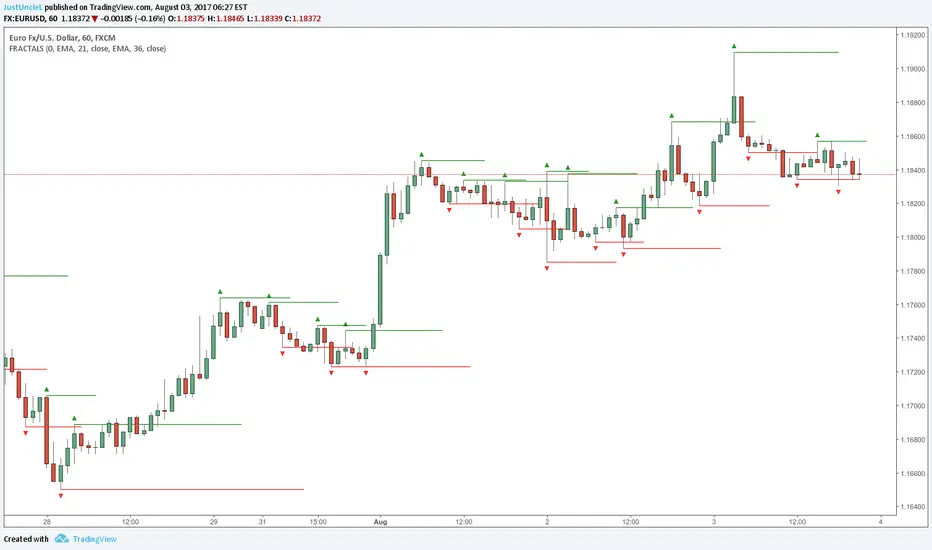
Fractals and Levels by JustUncleLEven though there are a many other Fractal and Level indicators, this indicator has some unique features. The indicator will display Fractals, fractal levels and HH/LL points, they will only be drawn after they have completed. Also the indicator has options to :
Show Ideal Fractals Only.
Use Renko Style Fractals, where open/close values are used instead of high/low to find Fractals. This is used to show the correct Fractals when Renko Wicks are enabled.
Has an optional Filter to only display Fractals that are above/below a MA Ribbon.
References:
This code is based on Fractal Levels V8 by RicardoSantos
This is a Renko Chart with "Renko Style Fractals" enabled, notice that the wicks are ignored and only the true Bricks are used for Fractals: