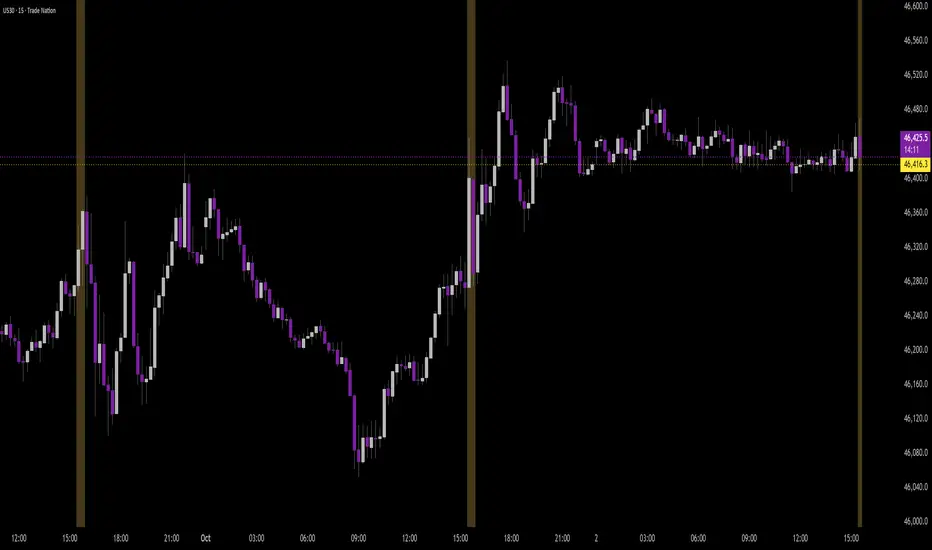
Opening Range candle percent of ATRIt takes the opening range of the first candle - 5, 10, 15 or whatever minute - and finds what percent of the ATR that is. So if the opening candle high is 15 and low is 14, its range is 1. If the ATR (daily or whatever you want) is 2, then the opening candle's range is 50% of the ATR.
The percentage is displayed on right in a blue box.
The indicator is used in reversal strategies, since opening candles that eat up a large amount of the daily ATR have a higher probability of reversing.
Indicator made with ChatGPT.
"range" için komut dosyalarını ara

Session Range by Black Dragon (Timezone + Days + Weekend)Session Range by Black Dragon (Timezone + Days + Weekend)

Weekly Open Range - TatoshiDisplays a weekly open range for both current and previous weeks. Gives users the flexibility to adjust the number of hours that the weekly open range is determined by. I personally use the first 3 hours, but play around with it.
A GOAT of a indicator, allows the user to easily set their bias for the week and extremely simple to build a strategy around.

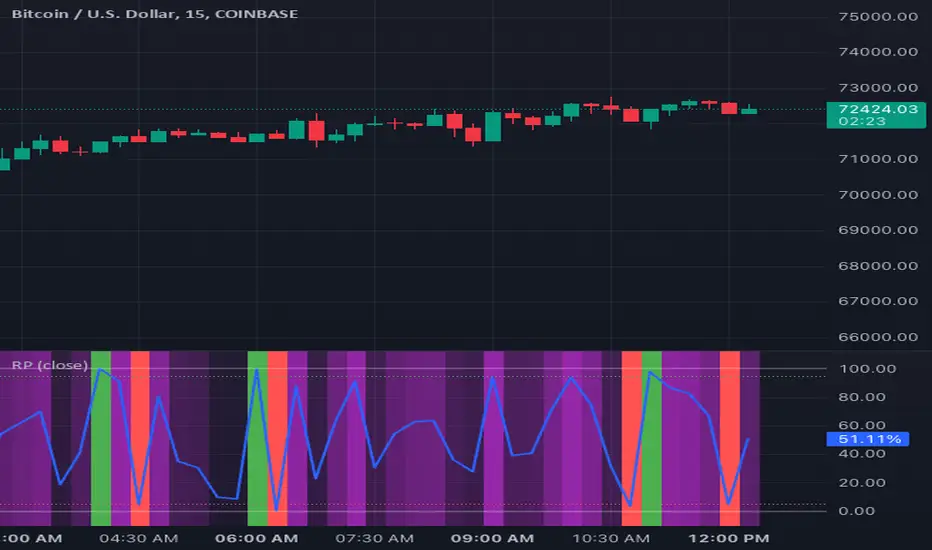
Range Oscillator with Alerts (Anson)Range Oscillator with Alerts (Anson)
From Range Oscillator (Zeiierman)
I made a little change and added an alert function.
The oscillator maps market movement as a heat zone, highlighting when the price approaches the upper or lower range boundaries and signaling potential breakout or mean-reversion conditions. Instead of relying on traditional overbought/oversold thresholds, it uses adaptive range detection and heatmap coloring to reveal where price is trading within a volatility-adjusted band.

R Dominant Range [CRT] by Sergi SernaR Dominant Range identifies the most influential R range located to the left of the current price action. It highlights the dominant zone that still impacts market behavior, helping traders understand which range is controlling the current structure.

Time Range by exp3rtsTime Window highlights a custom time range directly on your chart, helping you focus on specific market sessions or trading hours.
Key Features:
Highlights a custom time range with a shaded background
Fully adjustable start and end time (hour & minute)
Supports multiple time zones (e.g., GMT, UTC, Europe/Berlin)
Optional market color shading inside the window (bull/bear neutral tone)
Use Cases:
Mark London Open, New York Session, or any session overlap
Focus on high-probability trading hours
Visualize your backtesting timeframe or algo activity window
Track premarket or after-hours activity for futures or indices
Customization:
Set the beginning and end time in your local or exchange time zone
Choose your timezone string (e.g., "GMT", "Etc/UTC", "America/New_York")
Automatically colors candles in the time window for easy visibility
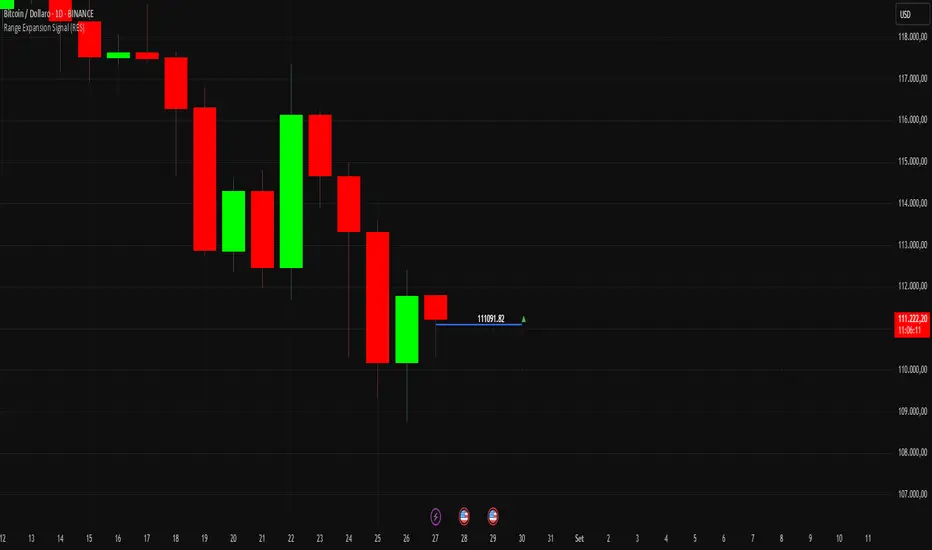
Range Expansion Signal (RES)Range Expansion Signal (RES)
The Range Expansion Signal (RES) is a lightweight yet effective indicator designed to highlight the internal dynamics of each candle.
🔹 How it works
Calculates the mid-price of each candle (the average between high and low).
Plots a horizontal line at the mid-price level.
Displays the mid-price value as a label on the chart.
Adds a directional marker:
▲ green when the current price is above the mid-price,
▼ red when the current price is below the mid-price.
🔹 How to use it
Quickly assess whether buying or selling pressure dominates within the candle.
Use as a reference in intraday or short-term strategies where range expansion matters.
Ideal for spotting potential breakouts, reversals, or confirming price action setups.
🔹 Why it’s useful
Unlike standard moving averages or static midpoints, RES provides a real-time visual signal directly on each candle. This makes it faster and cleaner to interpret price behavior without cluttering the chart.
[ BETA ][ IND ][ LIB ] Dynamic LookBack RSI RangeGet visual confirmation with this indicator if the current range selected had been oversold or overbough in the latest n bars

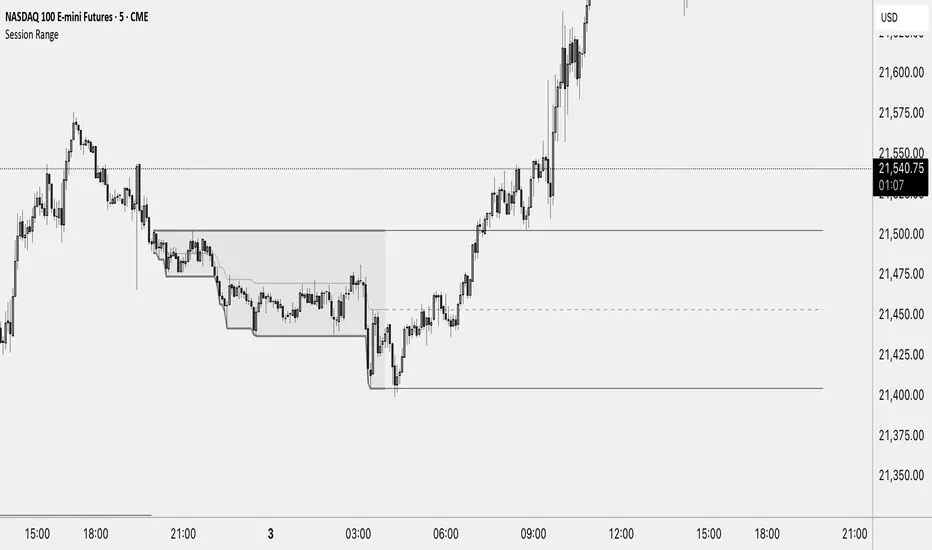
Session RangeThis Indicator Shows you the high, low and the midpoint for a chosen session and displays them on the chart.
You can make the following inputs:
Timezone: Choose your time zone (in UTC) to display the session correctly
Session Time: Choose the start time and end time of the session you want to have displayed.
Show Session Midpoint: Choose between displaying or not displaying the midpoint of the sessions high and low.
Extend Session Values until next Session: Choose this option if you want to display the sessions range until the next session starts. The midpoint will only be displayed if you chose "yes" at "Show Session Midpoint?"
Maximum number of bars between sessions: This is needed to ensure the correct display of the extended lines. Also this will affect the running speed of the script.
Limitations:
A higher number between bars slows down the script. What does that mean practically? If you choose to not have the sessions values displayed until the next session you can set this to 1 and the script will run as fast as it can. If you choose to display all the values until the next session you have to make sure that the number you put in is higher than the number of bars between the sessions. Otherwise the lines will be displayed backwards. As this affects the calculation speed you want to keep the number as low as possible. The default setting is 300 which is fine for 5 minute charts. On a 1 minute chart you will have to use something around 5000 depending on how long your session is.
Also the script will only run correctly if the start time of your session can be divided by the timeframe you are using. Example: you can use a 1min, 3min, 5min, or 15min chart on all sessions as they can only start every 15 minutes and 15 can be divided by all these numbers. A 2 minute timeframe will only work on sessions that start at minute 00 or 30, as 15 and 45 can not be divided by 2.
Customization and Alerts:
You can change the color of the sessions high, low, midpoint and background filling. The line style can also be changed but this might lead to a faulty display of the session.
The style of the extension lines can not be altered.
Alerts can be added for crossing the sessions high or low (after the session is finished). You do not have to display the extension lines in order to set an alert.
credit: The inspiration (especially for the look of this indicator) comes from the Asian Range by Nico948 indicator.
Daily Price RangeThe indicator is designed to analyze an instrument’s volatility based on daily extremes (High-Low) and to compare the current day’s range with the typical (median) range over a selected period. This helps traders assess how much of the "usual" daily movement has already occurred and how much may still be possible during the trading day.

Zerg range filter credit to Kivanc turkish pinecoder for base indicator i reworked with chatgpt and some common sense
this indicator similar to the ADX but i think its better visually to keep you out of market conditions that are unfavorable.
i made original indicator to work in a 0-100 enviroment (before it was a zero middle line oscillator) and added background coloring that has a lower and higher threshold setting. i also added a smoothing moving average. this will trigger threshold levels (not the core oscillator)
above higher level would indicate trending market conditions and its purple. these are the areas where you might want to buy low period moving average bounces like 10 or 21 ema
lower band will paint indicator background blue and its cold, meaning range bound trade ideas are likely play out better. selling resistance and buying horizontal supports for example.
you are encourage to play with lookback period and change thresholds until you find something that works for your trading.
on the picture above it illustrates how i intended its usage.
it also shows divergences which was not intended but also a function.
you can also observe as the oscillator likes to coil up into a tight range (horizontal or a wedge formation) and when these break their trendlines explosive moves are incoming usually.
if you have a trading system and can generate a lot of signals but want to filter out some loser trades this could be the indicator you were looking for.
i hope this will be inline with community guidelines. my other publishing got removed unfortunately

Relative Range at Time/ Relative volatility / High−Low This script is designed to help you compare the size of the current price candle (the difference between the highest and lowest prices in a given time period) to the average size of the last several candles. It does this by calculating the average range of a certain number of previous candles (you can set how many with the "Length" input) and then dividing the current candle's range by this average. The result is plotted on the chart as a bar: if the current candle's range is larger than the average, the bar is green; if it's smaller, the bar is red. A horizontal line is also drawn at the value of 1, so you can easily see whether the current candle's range is above or below the average. If there’s an issue with the data, the script will show an error message to let you know.

Range PercentageRange Percentage is a simple indicator utility to clearly display and dynamically alert on where a chosen series falls between two bounds, either series themselves or constant values.
To set up, select between series or value for upper and lower bounds. Only the chosen options will be used by the indicator, though you may enter the non-selected option. Configure the thresholds if you wish to use them for visual display or alerting. If you only care about the background color, disable both thresholds and the percentage line and move the indicator into the main pane.
Some sample use cases:
Coloring background on a zoomed-in chart to show to show price change relative to the entire value of an asset, not just the range selected on the y-axis
Get alerts which adjust dynamically as price approaches another series or dynamic value
Determine at a glance where a price falls between your identified support/resistance lines, no matter where you zoom or scroll
Compare relative gain of two assets
Identify trends of a price closing closer to low or high over time
This indicator is often most useful in conjunction with other indicators which produce a plotted series output and can save a lot of time thinking or interpreting. Its usefulness to a trader depends entirely on the rationale for choosing a lower/upper bound and sample series that are meaningful to that trader.
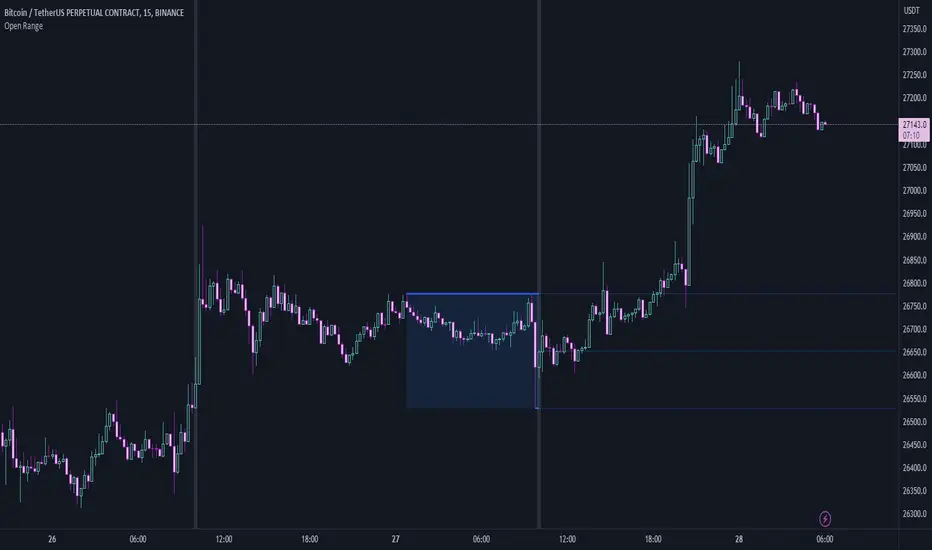
Open RangeThis is a simple script that will look back a set number of candles at a specified time (example: Ny Open) and find the "High and Low " of the range/ market in the given look back period. It will then draw two lines and the range zone as a box. Breakout traders can use these levels to help find interesting areas for a breakout. Reversal traders can use these levels to help locate false breakouts.
Simple type in your time zone Example: GMT-4
Set the time you want the indicator to draw the start line Example: 8:30am
then set the candle look back Example: 60
Hope this script helps spark some ideas
Happy trading
ATR Oscillator - Index (Average True range Oscillator)The purpose of converting the ATR value indicator to an oscillator;
It is known that the ATR value is not between the two specified values. So it is not compressed between 0 and 100 like RSI and %B etc. Therefore, conditions such as "A condition if ATR value is X, B condition if ATR value is Y" cannot be created. In order to create these conditions, the max and min value range of the ATR value must be determined. This indicator converts the ATR values into a percentage number according to the maximum and minimum ATR values in the period you will choose. Max value is 100, min value is 0. The considered ATR value, on the other hand, corresponds to the % of the difference between the max and min value in the selected period.
In this way, conditions such as "If the ATR Oscillator value is greater than 10 or 20 or 30" can now be created, or the value of another indicator can be calculated based on the ATR Oscillator value. For example; Let's say we want the standard deviation of BBand to change according to the value of the ATR Oscillator. If BBand Standard Deviation is 3 if ATRO value is 100, BBand Standard Deviation is 2 if ATRO value is 0, and BBand Standard Deviation is 2.5 when ATRO value is 50;
We can encode it as BBand_Std_Dev=((ATRO*0.01)+2 )
If the ATRO value is between .... and ...., you can make improvements such as plot color X.

Sw1tchFX - Average Daily RangeDESCRIPTION AND OVERVIEW
The Average Daily Range is a measure of volatility (typically across 5 days for the FX markets). I originally saw this being used in a trading system called ANTSSYS by Daryll Guppy and some other developers. I couldn't find it anywhere so I decided to build it from scratch.
What this does is allow you to measure volatility across various FX assets (I will apply other asset classes in the future that this is applicable to i.e. Crypto, Commodities, Blue Chip Stocks), and set realistic targets based off that volatility. Overall, this makes much more sense to me in the FX markets rather than support and resistance lines because it's based off the actual movement of the asset class. Market research shows that an asset class has a 80-85% chance to reach 75% of it's Average Daily Range (ADR).
Let's take a look at the daily ADR on the GBPNZD 15m chart. Notice how the values of the ADR act as real support and resistance based off the volatility of the asset. In this case, price did not quite reach the 75% ADR target.
Let's take a look at another example on EURNZD 15m chart. In this case, price hit the 75% target.
It's important to note that these levels do not bound the price. The probability that price exceeds it's 75% ADR is fairly low, but not impossible. Especially during important news events. Let's look at the recent USDCHF 15m chart for example.
Additionally, you can use these values to measure longer term movements (Weekly, and Monthly)
Here is a weekly view:
And a monthly view:
HOW I USE THIS
I use this in conjunction with some other indicators I've developed. Typically, I use range bars since I only care about price, not time. Additionally, averages are smoother when time is not taken into account and only price.
HOW THE CANDLE OPEN AND CLOSE IS CALCULATED
This is done based off of your own specific time zone and from the daily candle. So for me on PST, the daily candle will close at 1400. Once closed, a new ADR value is automatically calculated and added to the chart. There is an option to show past ADR values if you would like to see them or conduct additional research.

Relative Bi-Directional Volatility RangeThe basic math behind this Indicator is very similar to the math behind the Relative Strength Index without using a standard deviation as used for the Relative Volatility Index. The Volatility Range is calculated by utilizing the highs and lows. However not in the same way as in the Relative Volatility Index. This approach leads to different values, but the overall result clearly reveals the intrinsic Volatility of the chart, so the user can be aware, when something fundamentally is going on behind the scenes. If the Volatility rises on positive and negative range (-100 to 100) it implies that something fundamental is changing.
An advantage of using this kind of calculation is the possibility of separating the data into positive (buy pressure) and negative (sell pressure) components. The bi-directional character shows a slightly overhang in one of the directions, which can be used to detect a trend. A Moving Average of the users choice shell smoothen the overhang of the Relative Bi-Directional Volatility and show a trend direction. Similar to the math of the Relative Strength Index as standard a Relative Moving Average is preferred. If the Moving Average is in the positive range (0 to 100) it indicates a bullish trend, else if the Moving Average is in the negative range (0 to -100) it indicates a bearish trend. External Indicators can use a provided Trend Shift Signal which switches from 0 to 1, if the trend becomes bullish or from 0 to -1, if the trend becomes bearish.
The user should know, that in this Indicator the starting point of the Moving Averages always begins at the first bar, because the starting progress is approximated appropriately. Most Moving Averages require a minimum number of bars to be calculated, which is chosen with the Moving Average Length. In this cases the length used will be automatically reduced in the background until the number of bars is sufficient to match the chosen length. So if data history is very short, the Indicator can be used never the less as good as possible.
It is feasible to switch the Indicator on a higher timeframe, while staying in a lower timeframe on the chart. This can be useful for making the indication cleaner, if the Moving Average is to choppy and shows too many false signals. On the other hand the benefit of a higher timeframe (or a higher Moving Average Length) is paid with higher latency of the signaling. So the user has to decide what the best setting in his case is.
This Indicator can be used with all kinds of charts. Even charts with percentage or negative values should work fine.

Mondays Range by B1rdPlots mondays range (high, low and optionally average)
Features:
Added the option to extend the range for the entire week or just monday
Added the option to display if the high or low of the range has been taken and removes the level aftwards
Added the option to only display the current week
Added the option to visualize new weekly sessions
Added the option to mark mondays with a seperate background
Will update the script based on suggestions

GBTT Range Wave IndicatorOverview:
This script is a type of mean reversion indicator, it uses a short period EMA, the EMA5 to be exact, as its basis for a mean. From here, we run a modified version of ATR over a longer period of time to find an average range value for price movement. Finally, we calculate the cloud/band/wave by multiplying this range value by our deviation values to produce areas where the price could be considered too far from the mean (similar to an oversold or overbought scenario).
Additionally, we wrote this script with a goal to reduce or eliminate repainting. In the code, we have utilized OPEN values (instead of CLOSE) and previous candle values (not the current candle) to build all the data for the algorithm here to avoid the waves constantly moving and changing their values on real time candles. That said, this is NOT a guarantee that it will never repaint.
What you see:
Visually, the waves are always on the chart. Optionally, we provide a custom standard deviation channel based off the EMA5 (represented with a blue shading) and/or a simple ema5/21 crossover cloud. These can be used for additional confluence if desired, but are not necessary for the core function of the indicator which would be the upper and lower wave.
Intended use:
To provide educational content about the short term movement of an asset. Designed to be run on any time frame.
Disclaimer:
NOT intended to be a sole source of Technical Analysis or anything more than an educational tool!

Percentage Range IndicatorThe Percentage Range Indicator is useful for assessing the volatility of pairs for percentage-based grid bots. The higher the percentage range for a given time period, the more trades a grid bot is likely to generate in that period. Conversely, a grid bot can be optimised by using grids that are less than the Percentage Range Indicator value.
I have been using the Percentage Range Indicator based on the one hour time period and 168 periods of smoothing (seven days based on one-hour periods).
Enjoy.

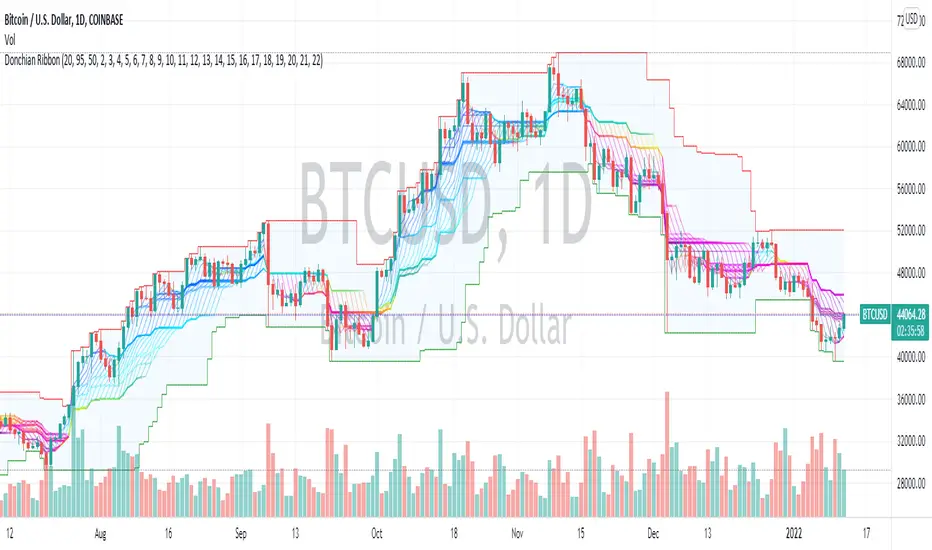
Donchian Range, RSI, and Levels SystemThe Donchian average is defined as average(highest, lowest) for a given period length. By plotting many different lengths, clustering of the lines seems to form natural support/resistance levels. A Donchian Channel and RSI rainbow colors are also provided to define the range and trend.
No Duplicates Interval Range & EQGenerates Range & EQ levels and removes duplicates. Prioritizes by higher timeframe for duplicates. For example, on Monday's open, weekly open is displayed while daily open is hidden automatically.

Fibonaci Opening Range Candle
Fibonacci Opening Range it is 50% and 0.61% of 5 min or 30min or 1 hour opening candle
search buying opportunities below 0.61
and selling opportunities above 0.50
Also acts as good support and resistance in intraday
BEST RESULTS IN INDEXES
Thanks & Best Regards
Marella Ganesh
