OPEN-SOURCE SCRIPT
Güncellendi Open Range
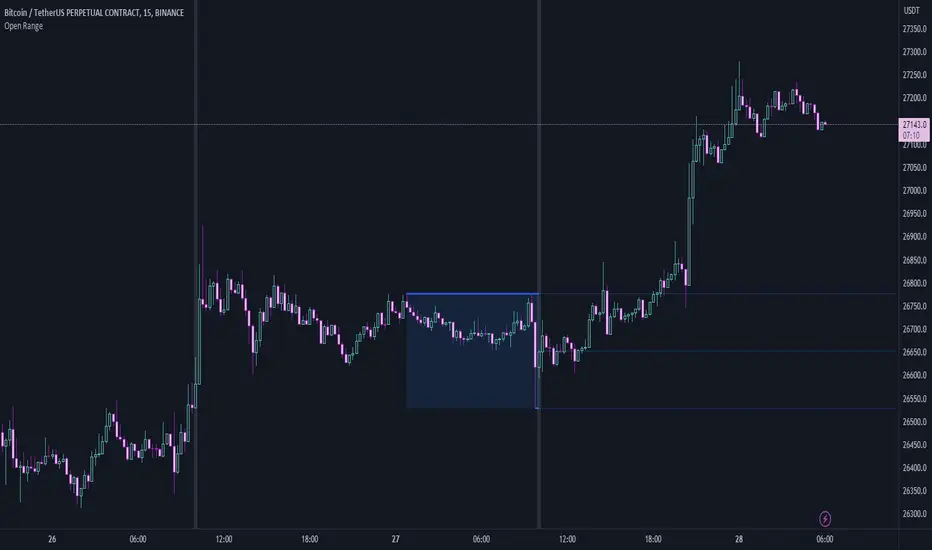
This is a simple script that will look back a set number of candles at a specified time (example: Ny Open) and find the "High and Low " of the range/ market in the given look back period. It will then draw two lines and the range zone as a box. Breakout traders can use these levels to help find interesting areas for a breakout. Reversal traders can use these levels to help locate false breakouts.
Simple type in your time zone Example: GMT-4
Set the time you want the indicator to draw the start line Example: 8:30am
then set the candle look back Example: 60
Hope this script helps spark some ideas
Happy trading
Simple type in your time zone Example: GMT-4
Set the time you want the indicator to draw the start line Example: 8:30am
then set the candle look back Example: 60
Hope this script helps spark some ideas
Happy trading
Sürüm Notları
I modified the script and removed the manual look back variable. It worked well however it didn't add flexibility to the user as it would require the user to update the look back each time they wanted to look at a different timeframe. I initially designed it for use on one timeframe. Not the script will auto adjust for the timeframe change so it will determine the candle lookback over a time range instead of a set candle look back amount much more flexible and consistent. Happy trading. Sürüm Notları
Update is a response to a user request for a mid point lineThe script now has as Line the can be shown or hidden the will mark the center point of the range.
Happy trading
Açık kaynak kodlu komut dosyası
Gerçek TradingView ruhuna uygun olarak, bu komut dosyasının oluşturucusu bunu açık kaynaklı hale getirmiştir, böylece yatırımcılar betiğin işlevselliğini inceleyip doğrulayabilir. Yazara saygı! Ücretsiz olarak kullanabilirsiniz, ancak kodu yeniden yayınlamanın Site Kurallarımıza tabi olduğunu unutmayın.
Feragatname
Bilgiler ve yayınlar, TradingView tarafından sağlanan veya onaylanan finansal, yatırım, işlem veya diğer türden tavsiye veya tavsiyeler anlamına gelmez ve teşkil etmez. Kullanım Şartları'nda daha fazlasını okuyun.