Range Gap/Open to Close/Close to CloseThis indicator shows the percentage variation of:
gap
close to close (day including gap)
open to close (without gap)
The green bars represent the days when the variation did not reach the selected range. The red bars show the days when the variation was higher than the selected range.
Best timeframe : DAY
"range" için komut dosyalarını ara

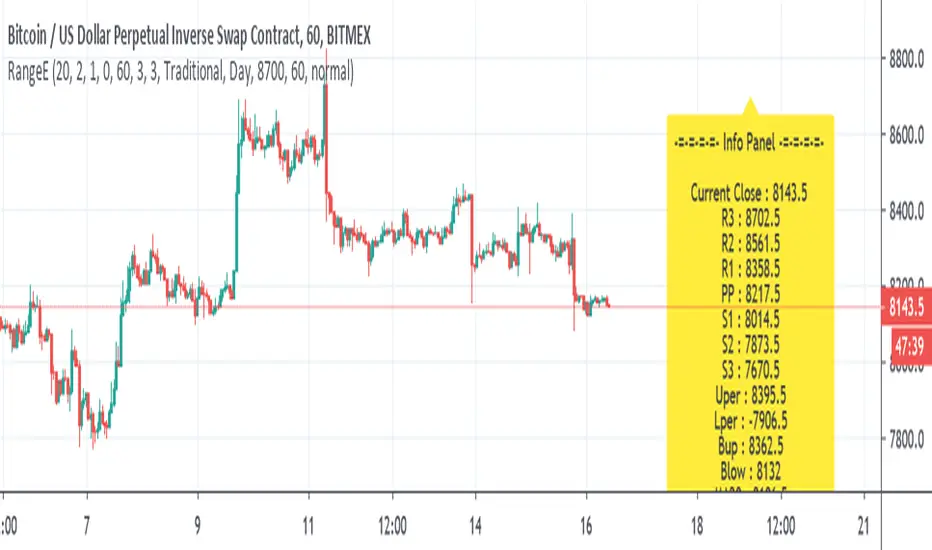
Range EstimateAs a trader I need to know what are the best ranges to get in or out
So this tool try to help a little bit .
First we have Pivot points (all forms with fib ,traditional etc)
next is percentage channel (uper=upper % from close and Lper=lower % from close) , in btc I use 3% up or low for 1 hour candles as it give me good range of lower and upper bound . This you need to change for different TF or different assets
next we have Bollinger upper and lower (Bup= Bollinger upper and Blow=Bollinger lower) it has also MTF function
last we MA =,20,50,100,200
in total the aim of this indicator is to give fast glance on the numbers that important to you as trader fast with a clean graph so you can add your indicator to it to see better how they work
The info panel you can change the font size, you can change distance by offset
and the position on the graph , you need to adjust with position -in this case since it btc I put number of 8700
let say it ETH then I put a number 5% above the close number
if it XRP = then the same trick , lets say 0.3 etc
Range Percent Histogram📌 Range Percent Histogram – Indicator Description
The Range Percent Histogram is a custom indicator that behaves like a traditional volume histogram, but instead of showing traded volume it displays the percentage range of each candle.
In other words, the height of each bar represents how much the price moved (in percentage terms) within that candle, from its low to its high.
🔧 What it shows
The indicator has two main components:
Component Description
Histogram Bars Columns plotted in red or green depending on the candle direction (green = bullish candle, red = bearish). The height of each bar = (high - low) / low * 100. That means a candle that moved, for example, 1 % from its lowest point to its highest point will show a bar with 1 % height.
Moving Average (optional) A 20-period Simple Moving Average applied directly to the bar values. It can be turned ON/OFF via a checkbox and helps you detect whether current range activity is above or below the average range of the past candles.
⚙️ How it works
Every time a new candle closes, the indicator calculates its range and converts it into a percentage.
This value is drawn as a column under the chart.
If the closing price is above the opening price → the bar is green (bullish range).
If the closing price is below the opening price → the bar is red (bearish range).
When the Show Moving Average option is enabled, a smooth line is plotted on top of the histogram representing the average percentage range of the last 20 candles.
📈 How to use it
This indicator is very helpful for detecting moments of range expansion or contraction.
One powerful way to use it is similar to a volume exhaustion / low-volume pattern:
Situation Interpretation
Consecutive bars with very low height Price is in a period of low volatility → possible accumulation or "pause" phase.
A sudden large bar after a series of small ones Indicates a strong pickup in volatility → often marks the start of a new impulse in the direction of the breakout.

Range Filter Buy and Sell 5min## **Enhanced Range Filter Strategy: A Comprehensive Overview**
### **1. Introduction**
The **Enhanced Range Filter Strategy** is a powerful technical trading system designed to identify high-probability trading opportunities while filtering out market noise. It utilizes **range-based trend filtering**, **momentum confirmation**, and **volatility-based risk management** to generate precise entry and exit signals. This strategy is particularly useful for traders who aim to capitalize on trend-following setups while avoiding choppy, ranging market conditions.
---
### **2. Key Components of the Strategy**
#### **A. Range Filter (Trend Determination)**
- The **Range Filter** smooths price fluctuations and helps identify clear trends.
- It calculates an **adjusted price range** based on a **sampling period** and a **multiplier**, ensuring a dynamic trend-following approach.
- **Uptrends:** When the current price is above the range filter and the trend is strengthening.
- **Downtrends:** When the price falls below the range filter and momentum confirms the move.
#### **B. RSI (Relative Strength Index) as Momentum Confirmation**
- RSI is used to **filter out weak trades** and prevent entries during overbought/oversold conditions.
- **Buy Signals:** RSI is above a certain threshold (e.g., 50) in an uptrend.
- **Sell Signals:** RSI is below a certain threshold (e.g., 50) in a downtrend.
#### **C. ADX (Average Directional Index) for Trend Strength Confirmation**
- ADX ensures that trades are only taken when the trend has **sufficient strength**.
- Avoids trading in low-volatility, ranging markets.
- **Threshold (e.g., 25):** Only trade when ADX is above this value, indicating a strong trend.
#### **D. ATR (Average True Range) for Risk Management**
- **Stop Loss (SL):** Placed **one ATR below** (for long trades) or **one ATR above** (for short trades).
- **Take Profit (TP):** Set at a **3:1 reward-to-risk ratio**, using ATR to determine realistic price targets.
- Ensures volatility-adjusted risk management.
---
### **3. Entry and Exit Conditions**
#### **📈 Buy (Long) Entry Conditions:**
1. **Price is above the Range Filter** → Indicates an uptrend.
2. **Upward trend strength is positive** (confirmed via trend counter).
3. **RSI is above the buy threshold** (e.g., 50, to confirm momentum).
4. **ADX confirms trend strength** (e.g., above 25).
5. **Volatility is supportive** (using ATR analysis).
#### **📉 Sell (Short) Entry Conditions:**
1. **Price is below the Range Filter** → Indicates a downtrend.
2. **Downward trend strength is positive** (confirmed via trend counter).
3. **RSI is below the sell threshold** (e.g., 50, to confirm momentum).
4. **ADX confirms trend strength** (e.g., above 25).
5. **Volatility is supportive** (using ATR analysis).
#### **🚪 Exit Conditions:**
- **Stop Loss (SL):**
- **Long Trades:** 1 ATR below entry price.
- **Short Trades:** 1 ATR above entry price.
- **Take Profit (TP):**
- Set at **3x the risk distance** to achieve a favorable risk-reward ratio.
- **Ranging Market Exit:**
- If ADX falls below the threshold, indicating a weakening trend.
---
### **4. Visualization & Alerts**
- **Colored range filter line** changes based on trend direction.
- **Buy and Sell signals** appear as labels on the chart.
- **Stop Loss and Take Profit levels** are plotted as dashed lines.
- **Gray background highlights ranging markets** where trading is avoided.
- **Alerts trigger on Buy, Sell, and Ranging Market conditions** for automation.
---
### **5. Advantages of the Enhanced Range Filter Strategy**
✅ **Trend-Following with Noise Reduction** → Helps avoid false signals by filtering out weak trends.
✅ **Momentum Confirmation with RSI & ADX** → Ensures that only strong, valid trades are executed.
✅ **Volatility-Based Risk Management** → ATR ensures adaptive stop loss and take profit placements.
✅ **Works on Multiple Timeframes** → Effective for day trading, swing trading, and scalping.
✅ **Visually Intuitive** → Clearly displays trade signals, SL/TP levels, and trend conditions.
---
### **6. Who Should Use This Strategy?**
✔ **Trend Traders** who want to enter trades with momentum confirmation.
✔ **Swing Traders** looking for medium-term opportunities with a solid risk-reward ratio.
✔ **Scalpers** who need precise entries and exits to minimize false signals.
✔ **Algorithmic Traders** using alerts for automated execution.
---
### **7. Conclusion**
The **Enhanced Range Filter Strategy** is a powerful trading tool that combines **trend-following techniques, momentum indicators, and risk management** into a structured, rule-based system. By leveraging **Range Filters, RSI, ADX, and ATR**, traders can improve trade accuracy, manage risk effectively, and filter out unfavorable market conditions.
This strategy is **ideal for traders looking for a systematic, disciplined approach** to capturing trends while **avoiding market noise and false breakouts**. 🚀

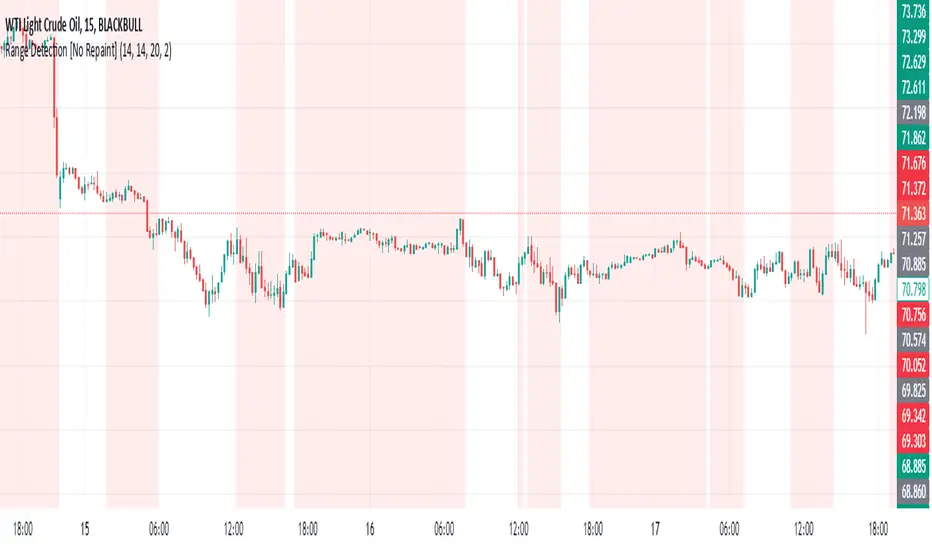
Range Detection [No Repaint]DETECTS RANGE EARLY
Using Confirmed Data:
All calculations now use to reference the previous completed candle
Signals are only generated based on completed candles
Range state is stored and confirmed before displaying
Key Changes to Prevent Repainting:
ATR calculations use previous candle data
Bollinger Bands calculate from previous closes
Price range checks use previous highs and lows
Range state is confirmed before displaying
How to Verify No Repainting:
Signals will only appear after a candle closes
Historical signals will remain unchanged
Alerts will only trigger on confirmed changes
This means:
The indicator will be slightly delayed (one candle)
But signals will be more reliable
Historical analysis will be accurate
Backtesting results will match real-time performance
Usage Tips with No-Repaint Version:
Wait for candle close before acting on signals
Use the confirmed range state for decision making
Consider the one-candle delay in your strategy timing
Alerts will only trigger on confirmed condition changes
Would you like me to:
Add a parameter to choose between real-time and no-repaint modes?
Add visual indicators for pending vs confirmed signals?
Modify the sensitivity of the range detection?
Range Force Impulse The "Range Force Impulse" indicator combines 4 useful indicators into one, freeing up chart real-estate and giving the trader insight into trend health, bull/bear commitment, range and volatility all at a glance.
The indicator consists of the following:
Direction - True Range and Average True Range columns shown above and below 0 depending on direction of the period's price
-- TR (gray) shows the current period's trading volatility
-- ATR (Impulse colors, see below) shows an EMA of TR over a specified length
-- Can be used to determine stops and targets (Example: Stop loss at prev close - ATR, Target at 2x ATR)
Index - Alexander Elder's EMA of (change(close) * volume), shows crosses above 0 (green) and below 0 (red), and intermediate signals
-- Shows bull vs. bear interest/commitment/dominance
-- Elder recommends EMA length of 2 for daily chart buy/sell signals, and 13 for weekly chart bull/bear dominance & trend direction signals
-- Intermediate signals are shown above 0 when falling (salmon), or below 0 when rising (pale yellow)
System - Range columns are colored using Alexander Elder's censorship system (green: do not short, red: do not long, blue: is up to you)
-- Shows overall trend health (Macd histogram and EMA up/down changes)

Range Trading Strategy
This indicator automatically marks the intraday trading range defined by the first four hours of the New York session (6:00 AM to 10:00 AM EST/EDT).
It calculates the highest high and lowest low within that window on a user-selected calculation timeframe, then projects those levels forward as horizontal lines that remain visible across any chart timeframe.
The lines can be displayed in real time while the window is forming or locked once the session ends, and optional price labels and background shading make the range easy to track.
Traders can use these reference levels to monitor potential breakout or reversal zones, manage risk, and plan entries/exits relative to the early session’s defined support and resistance.
For training check this video youtu.be

Range TableThe Range Table indicator calculates and displays the Daily Average True Range (ATR), the current day's True Range (TR), and two customizable ATR percentage values in a clean table format. It provides values in ticks, points, and USD, helping traders set stop-loss buffers based on market volatility.
**Features:**
- Displays the Daily ATR (14-period) and current day's True Range (TR) with its percentage of the Daily ATR.
- Includes two customizable ATR percentages (default: 75% and 10%, with the second disabled by default).
- Shows values in ticks, points, and USD based on the symbol's tick size and point value.
- Customizable table position, background color, text color, and font size.
- Toggle visibility for the table and percentage rows via input settings.
**How to Use:**
1. Add the indicator to your chart.
2. Adjust the table position, colors, and font size in the input settings.
3. Enable or disable the 75% and 10% ATR rows or customize their percentages.
4. Use the displayed values to set stop-loss or take-profit levels based on volatility.
**Ideal For:**
- Day traders and swing traders looking to set volatility-based stop-losses.
- Users analyzing tick, point, and USD-based risk metrics.
**Notes:**
- Ensure your chart is set to a timeframe that aligns with the daily ATR calculations.
- USD values are approximate if `syminfo.pointvalue` is unavailable.
Developed by FlyingSeaHorse.

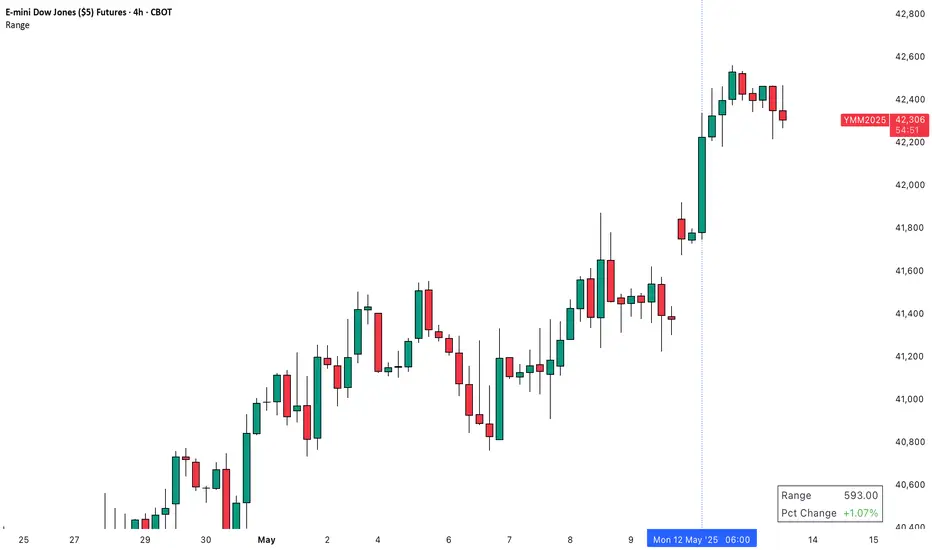
Range & Pct Change Table (Interactive)Indicator creates an interactive element that displays two key metrics for any selected candle:
1. Range - The difference between high and low prices (H-L)
2. Percentage Change - The percent change from open to close ((C-O)/O × 100)
Key Features
- Interactive Reference Point: Users can select any candle as a reference point using the time input
- Customizable Table: The table can be shown/hidden and positioned in different chart locations
This indicator is particularly useful for quickly analyzing the volatility (range) and directional movement (percentage change) of specific candles without having to manually calculate these values.
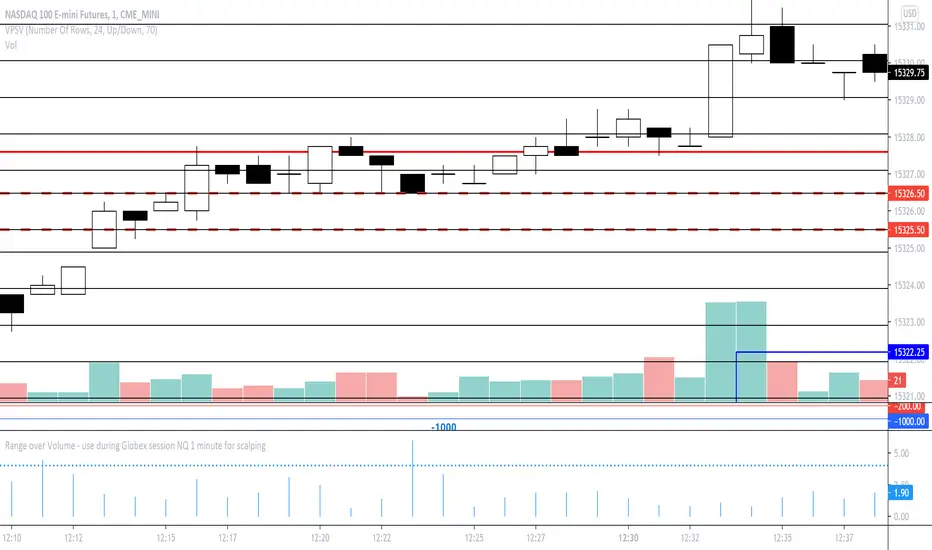
Range over Volume This is a scalping aid for NQ in the 1 minute time range for the Globex session.
Mathematically, the plot is range in ticks divided by 0.1*volume
This returns a histogram plot for RoV (range over volume)
The idea is that candles that ascribe a larger range with minimal volume does because there is unilateral aggression from the buy side, or sell side, and the subsequent behavioural outcome of this will either be an extension of that aggression unilaterally, or commonly, a counter to that aggression!
Wait for a candle to close with the RoV above 4.00. For that candle which formed the RoV above 4.00, plot the highs and lows of that candle and draw a 1.618x and -0.618x Fibonacci extension across it.
Enter short on the -0.618x and take profits at the -1.618x. Use the low of the ROV > 4 candle as a protective stop
Enter long on the 1.618 and take profits at 2.618. Use the high of the ROV > 4 candle as a protective stop
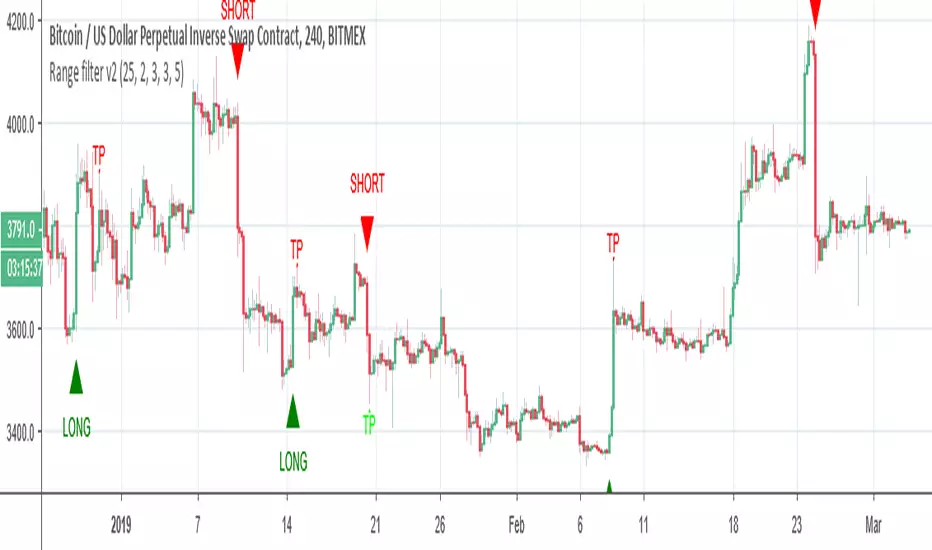
Range filter v2This version give us signal by the cross of super trend and range filter . since both system try to do the same but calculated different , I was thinking why not to cross them each other by the same way we do with MA length
if you want to see the real trend just remove the // from the plot of super trend and the range finder
alerts and take profit inside
Range Box for UK TimezoneThis is a simple range box for working in the UK.
There are many options plus the menu function is very easy to navigate.
The High / Low lines can be extended, colours changed etc.
Enjoy.

Range Trends Enhanced (eleven11)This indicator automatically draws your Range Trend lines based upon your timeframe. When you select a timeframe, in the options, those lines will be locked in, whenever you switch timeframes on the chart. This allows you to "lock in" a timeframe's trendlines and then view it on different timeframes. But if you want to view the current trendlines for a timeframe then you need to select that "lockdown" timeframe in the settings. The original code was created by eleven11

Range Channel by Atilla YurtsevenThis script creates a dynamic channel around a user-selected moving average (MA). It calculates the relative difference between price and the MA, then finds the average of the positive differences and the negative differences separately. Using these averages, it plots upper and lower bands around the MA as well as a histogram-like oscillator to show when price moves above or below the average thresholds.
How It Works
Moving Average Selection
The indicator allows you to choose among multiple MA types (SMA, EMA, WMA, Linear Regression, etc.). Depending on your preference, it calculates the chosen MA for the selected lookback period.
Relative Difference Calculation
It then computes the percentage difference between the source (typically the closing price) and the MA. (diff = (src / ma - 1) * 100)
Positive & Negative Averages
- Positive differences are averaged and represent how far the price typically moves above the MA.
- Negative differences are similarly averaged for when price moves below the MA.
Range Channel & Oscillator
- The channel is plotted around the MA using the average positive and negative differences (Upper Edge and Lower Edge).
- The “Untrended” histogram plots the difference (diff). Green bars occur when price is above the MA on average, and red bars when below. Two additional lines mark the upper and lower average thresholds on this histogram.
How to Use
Identify Overbought/Oversold Zones: The upper edge can serve as a dynamic overbought level, while the lower edge can suggest potential oversold conditions. When the histogram approaches or crosses these levels, it may signal price extremes relative to its average movement.
Trend Confirmation: Compare price action relative to the channel. If price and the histogram consistently remain above the MA and upper threshold, it could indicate a stronger bullish trend. If they remain below, it might signal a prolonged bearish trend.
Entry/Exit Timings:
- Entry: Traders can look for moments when price breaks back inside the channel from an extreme, anticipating a mean reversion.
- Exit: Watching how price interacts with these dynamic edges can help define stop-loss or take-profit points.
Because these thresholds adapt over time based on actual price behavior, they can be more responsive than fixed-percentage bands. However, like all indicators, it’s most effective when used in conjunction with other technical and fundamental tools.
Disclaimer
This script is provided for educational and informational purposes only. It does not guarantee any specific outcome or profit. Use it at your own discretion and risk.
Trade smart, stay safe.
Atilla Yurtseven

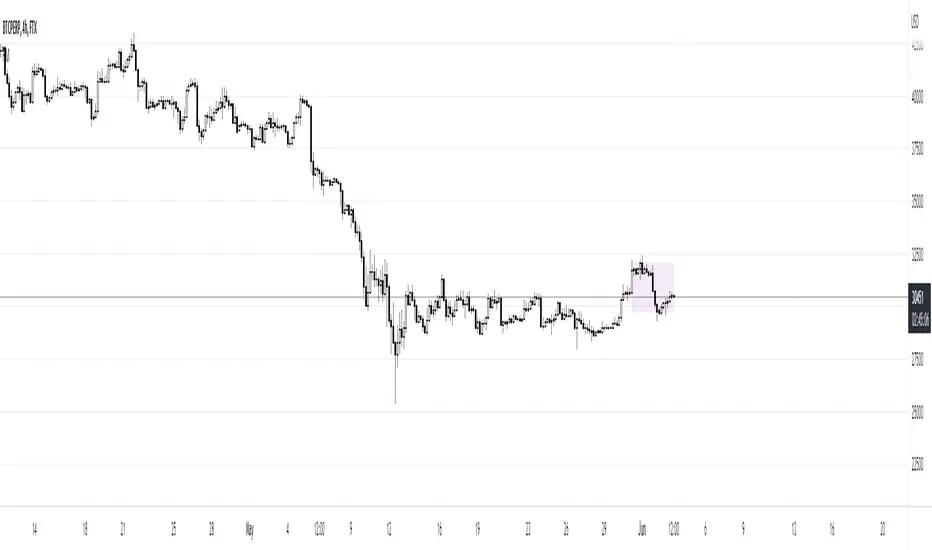
Range of body 30min avggives the average range of the past 30bars and indicates when a candle's body is greater than 150% the average.

Range of a source displayed in thirdsThis indicator will take the value of any external source input and display how it has changed over time (the lookback period in settings). For the purposes of display here I'm using the WT1 line from Wavetrend with Crosses by LazyBear to provide a source input.
The highest and lowest value of the source over the lookback period are used to determine the highest and lowest point - the green and red lines at the top and bottom of the bands. This region is then mathematically split into three, such that the source (and its optional moving average line) can be defined as being in the top third, the middle or the bottom third.
Applications for this could be in risk management where you may wish to take on a larger position size when a certain indicator is in the top third, or decide that you want to enter / leave positions when the source crosses in / out of the extreme points.

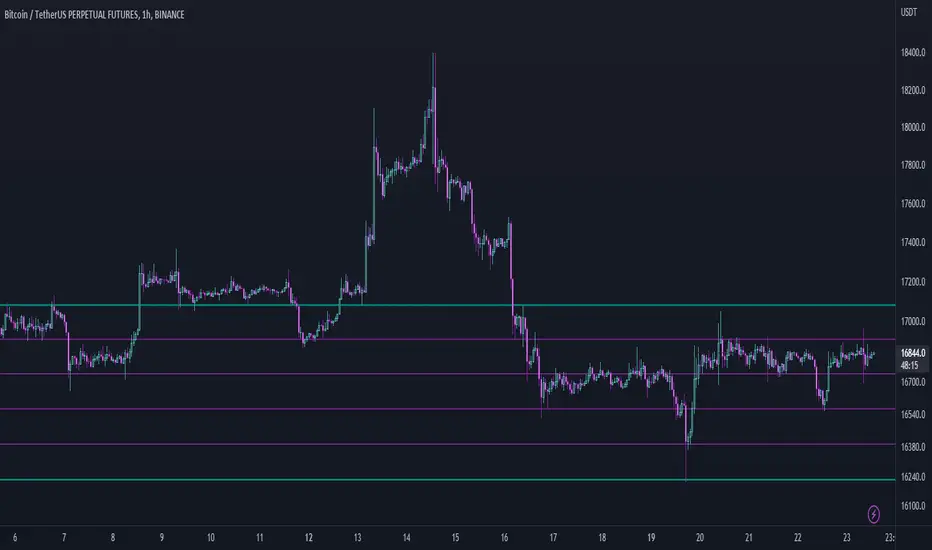
Range SlicerThis is a tool I quickly put together to work along side of my round number and Quarter Theory Scripts. This script allows you to set a price range between to values and slice them up into equal price zones. Happy Trading!
Range MarkerThis indicator is built for chart traders.
When using price and action to trade, you need to keep the chart scale the same.
So this indicator will help you to mark the range you choose.
Let you keep precise when reading the chart.
Enjoy it!
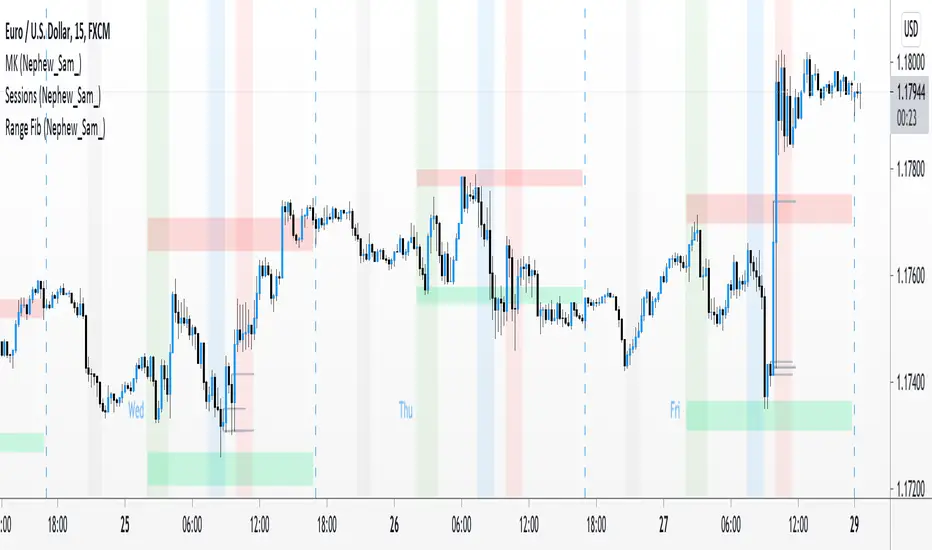
Range Fib (Nephew_Sam_)This indicator plots Fibonacci values based on a time range
Example: Asian session
If session time is 1700 - 0200, the indicator will find the high and low of that session then plot its fib extension lines and background outside of hours provided.
Currently supports 4 keys levels that can be changed under settings.
If you don't want the lines to display and only the background colors, you can uncheck the lines under the indicator settings -> styles.
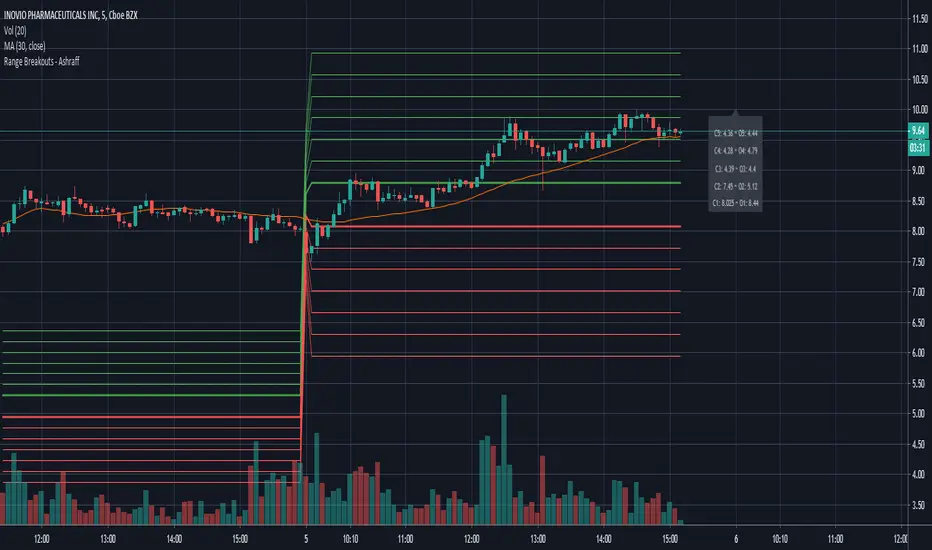
Range Breakouts - AshraffThis computes the Range Breakout strategy based on the last five days of stock data.
Range Spikes No NoiseSimilar to Sigma Spikes No Noise, but using range moves vs ATR20, either prior close to high or low and close to high or low.
Filtering out for noise by the treshold value

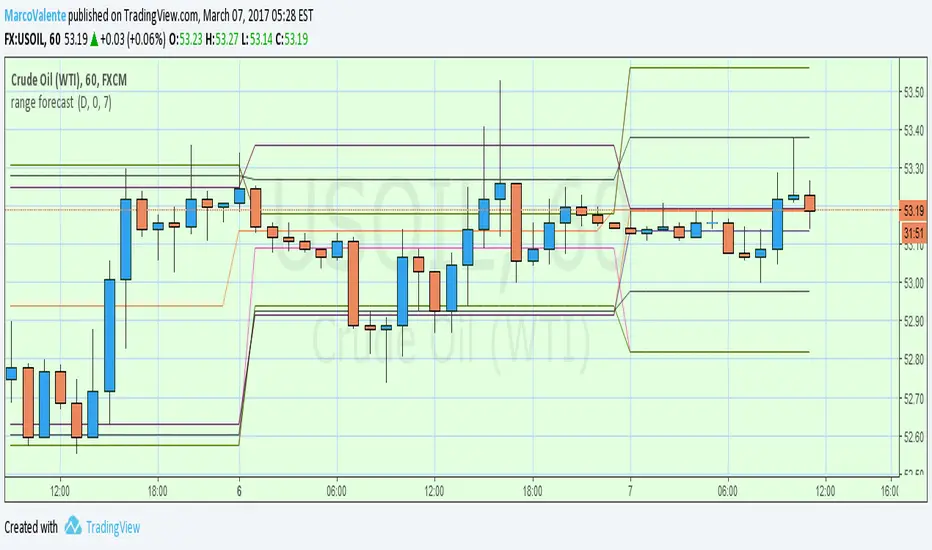
range forecast Calculate the price range , support and resistence for the current day. At the market open this algo will calculate the next price level with no repaint.
Custom Time Range HighlightThis indicator highlights specific time ranges on your TradingView chart with customizable background colors and labels, making it easier to identify key trading sessions and ICT (Inner Circle Trader) Killzones. It is designed for traders who want to mark important market hours, such as major sessions (Asia, New York, London) or high-volatility Killzones, with full control over activation, timing, colors, and transparency.
Features
Customizable Time Ranges: Define up to 9 different time ranges, including one custom range, three major market sessions (Asia, New York, London), and five ICT Killzones (Asia, NY Open, NY Close, London Open, London Close).
Individual Activation: Enable or disable each time range independently via checkboxes in the settings. By default, only the ICT Killzones are active.
Custom Colors and Transparency: Set unique background and label colors for each range, with adjustable transparency for both.
Labeled Time Ranges: Each active range is marked with a customizable label at the start of the period, displayed above the chart for easy identification.
Priority Handling: If multiple ranges overlap, the range with the higher number (e.g., Asia Killzone over Custom Range) determines the background color.
CET Time Zone: Time ranges are based on Central European Time (CET, Europe/Vienna). Adjust the hours and minutes to match your trading needs.
Settings
The indicator settings are organized into three groups for clarity:
Custom Range: A flexible range (default: 15:30–18:00 CET) for user-defined periods.
Session - Asia, NY, London: Major market sessions (Asia: 01:00–10:00, New York: 14:00–23:00, London: 09:00–18:00 CET).
ICT Killzones - Asia, NY, London: High-volatility periods (NY Open: 13:00–16:00, NY Close: 20:00–23:00, London Open: 08:00–11:00, London Close: 16:00–18:00, Asia: 02:00–05:00 CET).
For each range, you can:
Toggle activation (default: only ICT Killzones enabled).
Adjust start and end times (hours and minutes).
Customize the label text.
Choose background and label colors with transparency levels (0–100).
How to Use
Add the indicator to your chart.
Open the settings to enable/disable specific ranges, adjust their times, or customize colors and labels.
The chart will highlight active time ranges with the selected background colors and display labels at the start of each range.
Use it to focus on key trading periods, such as ICT Killzones for high-probability setups or major sessions for market analysis.
Notes
Ensure your time ranges align with your trading instrument’s session times.
Overlapping ranges prioritize higher-numbered ranges (e.g., Asia Killzone overrides London Session).
Ideal for day traders, scalpers, or ICT strategy followers who need clear visual cues for specific market hours.
Feedback
If you have suggestions for improvements or need help with customization, feel free to leave a comment or contact the author!
