Profit/Loss Live trackerI small script to track the current active trade live.
**HOW IT WORKS**
change inputs in parameter
- Entry price
- Invested capital
- Comission fees
Komut dosyalarını "profit" için ara

Profit Accumulator Relative Strength IndexHi Everyone
Thought I'd share this nice and simple RSI indicator with you which uses short and long length crossover to determine potential long and short trades. This indicator also has multiple timeframe functionality.
Please use this with other indicators or price action etc to confirm long and short trades.
Personally I like to see the crossover on the longer timeframe and close out on a lower timeframe (i.e. spot the entry on the 1hr charts and close my position based on the 15min)
If anyone would like alerts putting on here for crossover then just let me know.
Cheers
Mike

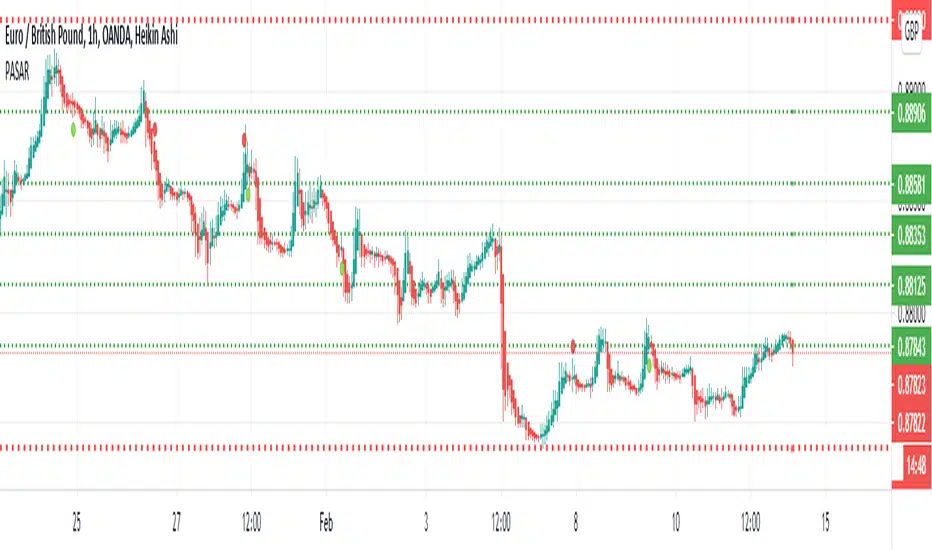
Profit Accumulator Support and ResistanceHi Everyone
Thought I'd share this support and resistance script.
This has two settings on it which are resolution (timeframe) and the number of bars back to look. The default setting is 1 Week and 2 bars which is the one I like using the most.
The highest high and lowest low are indicated by the thicker red lines on the chart.
Enjoy using this.
Cheers
Mike
Profit Accumulator Heat MapHi Everyone
Happy to share this heat map packed full of indicators to make those trading decisions. There are a whole host of indicators including:
Inverse Fischer Transform
Moving Average Slope
EMA50 Crossover
Schaff Trend Cycle
MACD
RSI
Stochastic RSI
Moving Average Cross Over
Quantitative Qualitative Estimation
On Balance Volume
All of the indicators are customisable in the settings so you can adjust them to how you want.
I often find that the combination of MACD and QQE provide good early entry and exit signals.
Any comments or improvements then please feel free to get in touch.
Cheers
Mike
Big thanks go to @everget, @JustUncleL and @LazyBear for the use of their codes.

Profit Accumulator VolatilityHi Everyone
I thought I'd share my new volatility trend indicator for anyone to use.
The indicator tracks the volatility in the market and plots this accordingly. Any plot above the zero line is a bullish signal and anything below the zero line is a bearish signal.
Long and Short Entry points are indicated at the 10 and -10 values respectively. A value of over 40 , or under -40 indicates a strong trend.
Possible entry and exit points are also highlighted on the chart.
I've added alerts onto this indicator highlighting possible entry and exit points as well as when strong trends are developing and when they are over.
This is intended to be used with your own indicators and/or analysis of the market and should be used carefully.
I personally like to use this indicator for entry on the one hour chart and then drop down to the 15 minute chart to confirm my entry and to use that timeframe for my exit.
Please feel free to forward any improvements that you'd like to make.
Cheers
Mike

Profit Accumulator On Balance VolumeOn Balance Volume Indicator
This is a support indicator to the Main Indicator which has also been published.
This indicator is from the basis of user Everget and a friend of mine on another site. This indicator has used a smoothing function in an attempt to provide more robust signals.
In this indicator the user is looking for:
Long trade: Upward sloping signal line and OBV greater than the signal line (shaded green).
Short trade: Downward sloping signal line and OBV less than the signal line (shaded red).
A horizontal signal line is a sign that the market is moving horizontally and trades should be placed very carefully. This indicator should definitely be used with the others in the suite to provide confluence when making a trade.
I've been using this successfully on the one hour FX charts, but seems to work equally as well on higher or lower time frames (not less than 15min).
The other indicators which are part of the suite are shown on the website which is highlighted in my signature at the bottom of the page. Purchase of the main indicator gives access to the full suite of eight indicators. I use the other indicators to confirm the direction of the trade and to determine if I want to trade or not. I use it along with the 2min, 15min and 4hr timeframes to identify the best entry window and how long I'm likely to be in the trade.
Support can be provided via private message or in the comments below.
The links are provided below for access to the indicator.

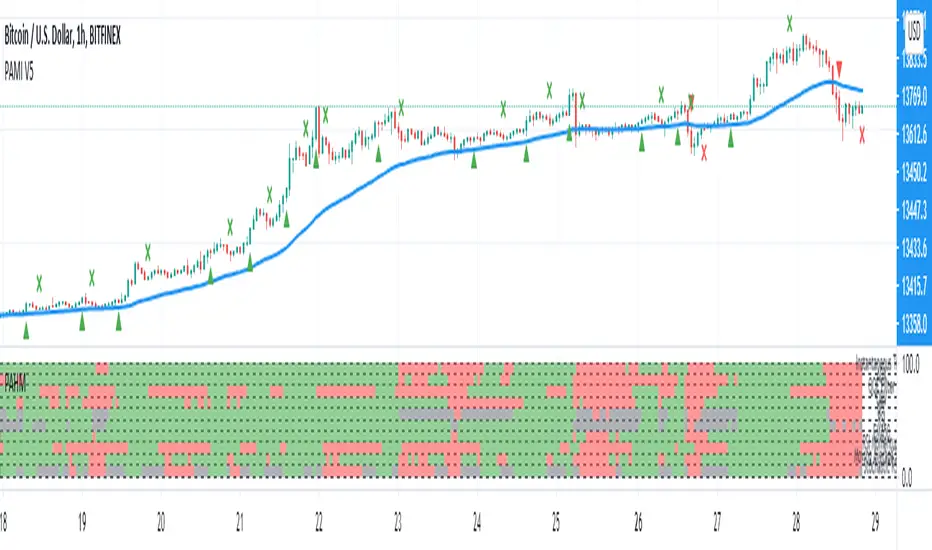
Profit Accumulator Heat MapHeat Map Indicator
This is a support indicator to the Main Indicator which has also been published.
This is a list of a number of indicators which cover trend, momentum and volatility. The key is very simple for this indicator, green is a long trade, red is a short trade and grey is an indicator which may be transitioning. The indicators uses are: MACD, PSAR, Bollinger Bands, RSI, Momentum and Chandelier Exit. All of the settings are customisable within the indicator and the user can best fit these around their charts. The simplicity of the heat map is that the more of one colour there is, the more likely it is that a trade can be placed.
I've been using this successfully on the one hour FX charts, but seems to work equally as well on higher or lower time frames (not less than 15min).
The other indicators which are part of the suite are shown on the website which is highlighted in my signature at the bottom of the page. Purchase of the main indicator gives access to the full suite of eight indicators. I use the other indicators to confirm the direction of the trade and to determine if I want to trade or not. I use it along with the 2min, 15min and 4hr timeframes to identify the best entry window and how long I'm likely to be in the trade.
Support can be provided via private message or in the comments below.
The links are provided below for access to the indicator.
Profit Accumulator Moving Average SlopeMoving Average Slope Indicator
This is a support indicator to the Main Indicator which has also been published.
This indicator makes use of custom and adjustable moving averages. There are two options for this centred oscillator:
Average of Three Moving Averages on Current Time Frame
Average of Three Moving Average Time Frames for One Length (i.e. if I'm using a 1hr time frame I would take the average of 30min, 1hr and 4hr moving averages with a 12 length).
When the trend line crosses above zero it is an indication for a long trade and when the trend line crosses below zero it is an indication for a short trade.
Whilst an actual alert function is not set for the indicator, the TradingView alert function can be used to trigger a message when the trendline crosses above or below zero.
I've been using this successfully on the one hour FX charts, but seems to work equally as well on higher or lower time frames (not less than 15min).
The other indicators which are part of the suite are shown on the website which is highlighted in my signature at the bottom of the page. Purchase of the main indicator gives access to the full suite of eight indicators. I use the other indicators to confirm the direction of the trade and to determine if I want to trade or not. I use it along with the 2min, 15min and 4hr timeframes to identify the best entry window and how long I'm likely to be in the trade.
Support can be provided via private message or in the comments below.
The links are provided below for access to the indicator.

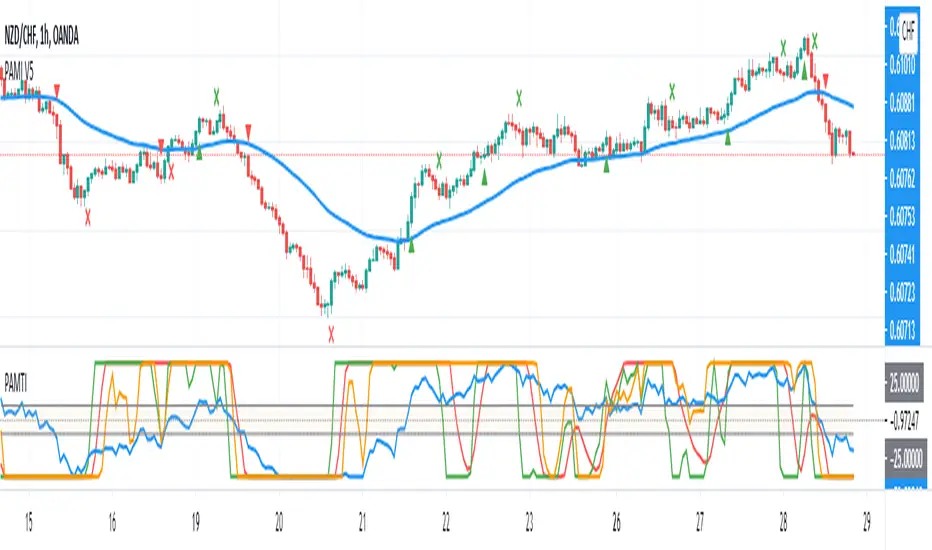
Profit Accumulator Momentum Trend IndicatorMomentum Trend Indicator
This is a support indicator to the Main Indicator which has also been published.
This indicator uses a modified stochastic trendline and a smoothed momentum line (which combines stochastic, RSI and moving average). This is a centred oscillator from -100 to 100 which makes it easier to track. The stochastic line is the quicker moving line which potentially acts as the first trigger. If the momentum line then begins to follow, then it is an indication that a trade should be made.
Long Trades: The Stochastic line is above 25 and the momentum line is greater than -25.
Short Trade: The Stochastic line is below -25 and the momentum line is less than 25.
Whilst an actual alert function is not set for the indicator, the TradingView alert function can be used to trigger a message when either the stochastic line or momentum line crosses -25/25 (the key levels).
I've been using this successfully on the one hour FX charts, but seems to work equally as well on higher or lower time frames (not less than 15min).
The other indicators which are part of the suite are shown on the website which is highlighted in my signature at the bottom of the page. Purchase of the main indicator gives access to the full suite of eight indicators. I use the other indicators to confirm the direction of the trade and to determine if I want to trade or not. I use it along with the 2min, 15min and 4hr timeframes to identify the best entry window and how long I'm likely to be in the trade.
Support can be provided via private message or in the comments below.
The links are provided below for access to the indicator.
Profit Accumulator %BB%Bollinger Band Width
This is a support indicator to the Main Indicator which has also been published.
This indicator uses the close of a candle and compares where it is in relation to the upper and lower levels of a Bollinger Band. This is a centred oscillator where anything below the zero line is indicating a short signal and anything above zero is indicating a long signal. The crossing of the zero line is an important point for this indicator.
Whilst an actual alert function is not set for the indicator, the TradingView alert function can be used to trigger a message when the line crosses zero (up or down).
I've been using this successfully on the one hour FX charts, but seems to work equally as well on higher or lower time frames (not less than 15min).
The other indicators which are part of the suite are shown on the website which is highlighted in my signature at the bottom of the page. Purchase of the main indicator gives access to the full suite of eight indicators. I use the other indicators to confirm the direction of the trade and to determine if I want to trade or not. I use it along with the 2min, 15min and 4hr timeframes to identify the best entry window and how long I'm likely to be in the trade.
Support can be provided via private message or in the comments below.
The links are provided below for access to the indicator.

Profit Bazoka Mr.HokageTinggal ikuti signal saja dan jika ada signal baru maka yang lama di tutup ikut yang baru

Profit Maker Mr.Hokage V1Tinggal ikuti arahnya gunakan Time frame 4H bisa di gunakan di crypto,Forex,Saham dan lain lain
Profit Maximizer 90%-95% IntraDayTrade Strategy WithTester Developed for Intraday and for very very Lesser Time Frame Trading. Note: Invite only Script .Request to me Access permission to test this.
Strategy tester enabled .All you can test this in live market in any segment.
Lesser the time frame greater the success rates as the test results.
This can be used : Crypto Currency/Bitcoins ,Forex,currencies ,Index ,Commodity Gold/silver ,Oil Market and in Equity /Futures
It will work for BINARY OPTION ,BINARY DIGITAL to enter and hold the position in right direction, User test it and confirm .
How to Use:
Three Main Zone BackGrounds: 1. Green Zone 2. LightRed Zone 3. Yellow Zone
1.Long only when Bar Color changed from Red or Black to BLUE and BackGround in Green, Hold the position until opposite color comes.
2.Short when BAR become Black and BackGround Red Exit when opposite color come.
3.Yellow Back Ground : Risk Trade Zone : When Red BARs Cautious Short , Yellow Zone LightGreen Bars (Avoid Trade) .In Yellow Zone Close the previous Entered postions.
Time Frame : Lesser Time Frame and holding for longer time will give Good Result . 1min-1Hrs . This will not work >1Hr Strategy and Candle will disappear >1hr TimeFrame.
Strategy Tester : Choose any Date Month Year to Current Date and check the results below in the Strategy Tester.
REPAINT/NO REPAINT : No Repaint ,Previous candles and Background Color wont change. In the current candle position wait for the candle to close to see the stability.Current candle color might oscillate bit However it will not change from Blue to Black or Black to Blue or Black to Red.
Note : Last Bar will be a actual Green or Red Bar by Default Do not Confuse with this.It is trading view default strategy design working way.Once Bar closes actual strategy color will appear.
ALERT /AUTOVIEW capabilities : Strategy Tester does not support ALERT by default as you all know.In the Indicator version Alert will be added for all Buy Sell and cover entries.
Test the strategy.
SCRIPT : Access must be given by me to test this .Once access given you can test ,Request for access .Without access Study Not Auth error will come.
Review and Feedback.Thank you!
Refer the Release notes for any updates and my posts below and in my idea page for more details. Thank you!
Any issues report to me to Fix.Thank you!

Profit Wave Indicator AcessPredicts Trends and Works With Every Market. Works with all time frame charts but, better results with higher time frame charts.
Use Base with buy side or sell side, don't have all indicators showing on chart.
(Either Base with Buy Side or Base with Sell Side.)
- Buy when Buy Side Crosses Under Base
- Sell when Sell Side Crosses Above Base
Best Strategy is to wait for buy side cross at support level or sell side cross at resistance level.


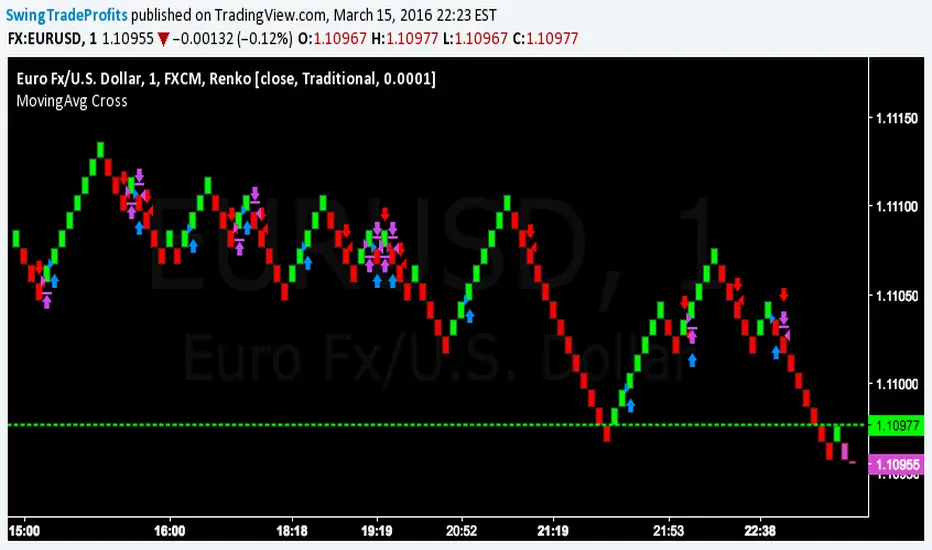
$EURUSD 1 Minute Chart StrategyYou must be using the renko chart with traditional settings with the block size set at .0001. This can be done by going to settings. Style at the bottom should be changed from ATR to traditional. The set the block size as .0001.
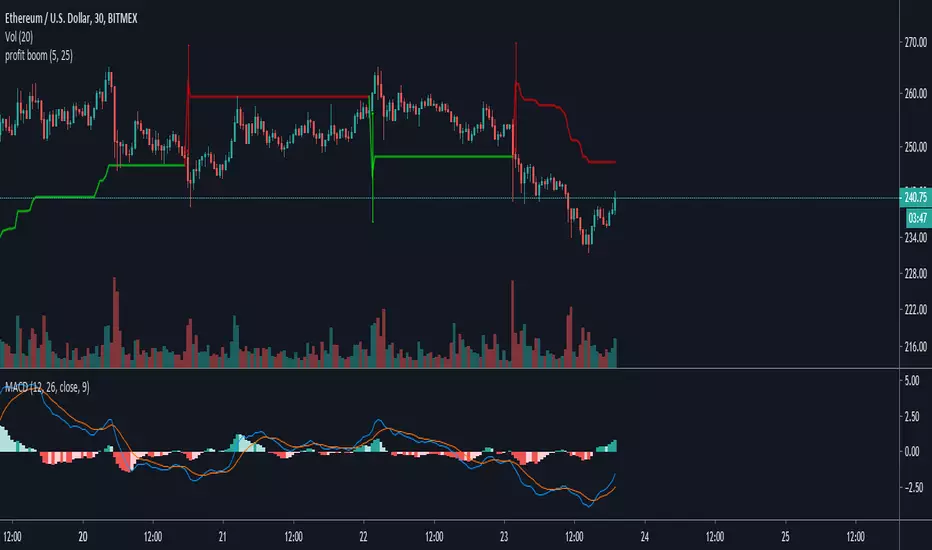
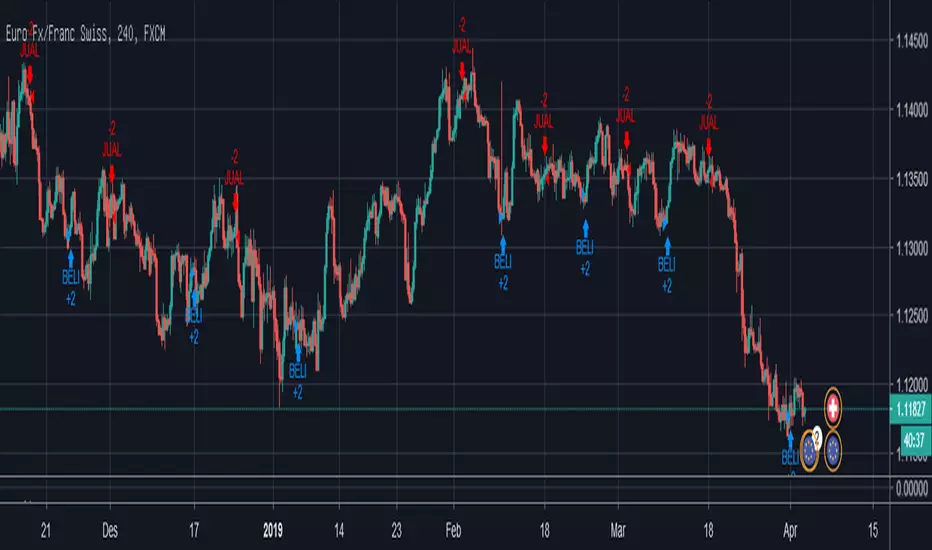
Profit target areaUpdate.
- you can specify count of bars used to detect reversal pattern
- you can specify count of bars used to determine lowest or highest price to place support or resistance
- area between lines is filled by green - ascending, red - descending trend
To trade:
- open position using stop command on S/R
- close position using limit command on retracement line
- close position when background colour indicates trend change
(erratum: last balloon on right should say "buy limit")

Autoback Grid Lab [trade_lexx]Autoback Grid Lab: Your personal laboratory for optimizing grid strategies.
Introduction
First of all, it is important to understand that Autoback Grid Lab is a powerful professional tool for backtesting and optimization, created specifically for traders using both grid strategies and regular take profit with stop loss.
The main purpose of this script is to save you weeks and months of manual testing and parameter selection. Instead of manually testing one combination of settings after another, Autoback Grid Lab automatically tests thousands of unique strategies on historical data, providing you with a comprehensive report on the most profitable and, more importantly, sustainable ones.
If you want to find mathematically sound, most effective settings for your grid strategy on a specific asset and timeframe, then this tool was created for you.
Key Features
My tool has functionality that transforms the process of finding the perfect strategy from a routine into an exciting exploration.
🧪 Mass testing of thousands of combinations
The script is able to systematically generate and run a huge number of unique combinations of parameters through the built-in simulator. You set the ranges, and the indicator does all the work, testing all possible options for the following grid settings:
* Number of safety orders (SO Count)
* Grid step (SO Step)
* Step Multiplier (SO Multiplier) for building nonlinear grids
* Martingale for controlling the volume of subsequent orders
* Take Profit (%)
* Stop Loss (%), with the possibility of calculating both from the entry point and from the dynamic breakeven line
* The volume of the base order (Volume BO) as a percentage of the deposit
🏆 Unique `FinalScore` rating system
Sorting strategies by net profit alone is a direct path to self—deception and choosing strategies that are "tailored" to history and will inevitably fail in real trading. To solve this problem, we have developed FinalScore, a comprehensive assessment of the sustainability and quality of the strategy.
How does it work?
FinalScore analyzes each combination not one by one, but by nine key performance metrics at once, including Net Profit, Drawdown, Profit Factor, WinRate, Sharpe coefficients, Sortino, Squid and Omega. Each of these indicators is normalized, that is, reduced to a single scale. Then, to test the strategy for strength, the system performs 30 iterations, each time assigning random weights to these 9 metrics. A strategy gets a high FinalScore only if it shows consistently high results under different evaluation criteria. This proves her reliability and reduces the likelihood that her success was an accident.
📈 Realistic backtesting engine
The test results are meaningless if they do not take into account the actual trading conditions. Our simulator simulates real trading as accurately as possible, taking into account:
* Leverage: Calculation of the required margin to open and hold positions.
* Commission: A percentage commission is charged each time an order is opened and closed.
* Slippage: The order execution price is adjusted by a set percentage to simulate real market conditions.
* Liquidation model: This is one of the most important functions. The script continuously monitors the equity of the account (capital + unrealized P&L). If equity falls below the level of the supporting margin (calculated from the current value of the position), the simulator forcibly closes the position, as it would happen on a real exchange. This eliminates unrealistic scenarios where the strategy survives after a huge drawdown.
🔌 Integration with external signals
The indicator operates in two modes:
1. `No Signal': Standard mode. The trading cycle starts immediately as soon as the previous one has been closed. Ideal for testing the "pure" mechanics of the grid.
2. `External Signal`: In this mode, a new trading cycle will start only when a signal is received from an external source. You can connect any other indicator (such as the RSI, MACD, or your own strategy) to the script and use it as a trigger to log in. This allows you to combine the power of a grid strategy with your own entry points.
📊 Interactive and informative results panel
Upon completion of the calculations, a detailed table with the TOP N best strategies appears on the screen, sorted according to your chosen criterion. For each strategy in the rating, you will see not only the key metrics (Profit, Drawdown, duration of transactions), but also all the parameters that led to this result. You can immediately take these settings and apply them in your trading.
Application Options: How To Solve Your Problems
Autoback Grid Lab is a flexible tool that can be adapted to solve various tasks, from complete grid optimization to fine—tuning existing strategies. Here are some key scenarios for its use:
1. Complete Optimization Of The Grid Strategy
This is the basic and most powerful mode of use. You can find the most efficient grid configuration for any asset from scratch.
* How to use: Set wide ranges for all key grid parameters ('SO Count`, SO Step, SO Multiplier, Martingale, TP, etc.).
* In the `No Signal` mode: You will find the most stable grid configuration that works as an independent, constantly active strategy, regardless of which-or entrance indicators.
* In the `External Signal` mode: You can connect your favorite indicator for input (for example, RSI, MACD or a complex author's script) and find the optimal grid parameters that best complement your input signals. This allows you to turn a simple signaling strategy into a full-fledged grid system.
2. Selecting the Optimal Take Profit and Stop Loss for Your Strategy
Do you already have an entry strategy, but you are not sure where it is best to put Take Profit and Stop Loss? Autoback Grid Lab can solve this problem as well.
* How to use:
1. Disable optimization of all grid parameters (uncheck SO Count, SO Step, Martingale, etc.). Set the Min value for SO Count to 0.
2. Set the ranges for iteration only for 'Take Profit` and `Stop Loss'.
3. Turn on the External Signal mode and connect your indicator with input signals.
* Result: The script will run your historical entry signals with hundreds of different TP and SL combinations and show you which stop order levels bring maximum profit with minimal risk specifically for your entry points.
3. Building a Secure Network with Risk Management
Many traders are afraid of grid strategies because of the risk of large drawdowns. With the help of the optimizer, you can purposefully find the parameters for such a grid, which includes mandatory risk management through Stop Loss.
* How to use: Enable and set the range for Stop Loss, along with other grid parameters. Don't forget to test both types of SL calculations (`From entry point` and `From breakeven line`) to determine which one works more efficiently.
* Result: You will find balanced strategies in which the grid parameters (number of orders, martingale) and the Stop Loss level are selected in such a way as to maximize profits without going beyond the acceptable risk level for you.
How To Use The Indicator (Step-By-Step Guide)
Working with the Autoback Grid Lab is a sequential process consisting of four main steps: from initial setup to analysis of the finished results. Follow this guide to get the most out of the tool.
Step 1: Initial Setup
1. Add the indicator to the chart of your chosen asset and timeframe.
2. Open the script settings. The first thing you should pay attention to is the ⚙️ Optimization Settings ⚙️ group.
3. Set the `Bars Count'. This parameter determines how much historical data will be used for testing.
* Important: The more bars you specify, the more statistically reliable the backtest results will be. We recommend using the maximum available value (25,000) to test strategies at different market phases.
* Consider: The indicator performs all calculations on the last historical bar. After applying the TradingView settings, it will take some time to load all the specified bars. The results table will appear only after the data is fully loaded. Don't worry if it doesn't appear instantly. And if an error occurs, simply switch the number of combinations to 990 and back to 1000 until the table appears.
Step 2: Optimization Configuration
At this stage, you define the "universe" of parameters that our algorithm will explore.
1. Set the search ranges (🛠 Optimization Parameters 🛠 group).
For each grid parameter that you want to optimize (for example, SO Count or `Take Profit'), you must specify three values:
* Min: The minimum value of the range.
* Max: The maximum value of the range.
* Step: The step with which the values from Min to Max will be traversed.
*Example:* If you set Min=5, Max=10, and Step=1 for SO Count, the script will test strategies with 5, 6, 7, 8, 9, and 10 safety orders.
* Tip for users: To get the first results quickly, start with a larger step (for example, TP from 0.5% to 2.5% in 0.5 increments instead of 0.1). After you identify the most promising areas, you can perform a deeper analysis by expanding the ranges around these values.
2. Set Up Money Management (Group `💰 Money Management Settings 💰`).
Fill in these fields with the values that best match your actual trading conditions. This is critically important for obtaining reliable results.
* Capital: Your initial deposit.
* Leverage: Leverage.
* Commission (%): Your trading commission as a percentage.
* Slippage (%): Expected slippage.
* Liquidation Level (%): The level of the supporting margin (MMR in %). For example, for Binance Futures, this value is usually between 0.4% and 2.5%, depending on the asset and position size. Specify this value for your exchange.
3. Select the Sorting Criterion and the Direction (Group `⚙️ Optimization Settings ⚙️').
* `Sort by': Specify the main criteria by which the best strategies will be selected and sorted. I strongly recommend using finalScore to find the most balanced and sustainable strategies.
* `Direction': Choose which trades to test: Long, Short or Both.
Step 3: Start Testing and Work with "Parts"
The total number of unique combinations generated based on your ranges can reach tens of millions. TradingView has technical limitations on the number of calculations that the script can perform at a time. To get around this, I implemented a "Parts" system.
1. What are `Part` and `Combinations in Part'?
* `Combinations in Part': This is the number of backtests that the script performs in one run (1000 by default).
* `Part`: This is the number of the "portion" of combinations that you want to test.
2. How does it work in practice?
* After you have everything set up, leave Part:1 and wait for the results table to appear. You will see the TOP N best strategies from the first thousand tested.
* Analyze them. Then, to check the next thousand combinations, just change the Part to 2 in the settings and click OK. The script will run a test for the next batch.
* Repeat this process by increasing the Part number (`3`, 4, 5...), until you reach the last available part.
* Where can I see the total number of parts? In the information row below the results table, you will find Total parts. This will help you figure out how many more tests are left to run.
Step 4: Analyze the Results in the Table
The results table is your main decision—making tool. It displays the best strategies found, sorted by the criteria you have chosen.
1. Study the performance metrics:
* Rating: Position in the rating.
* Profit %: Net profit as a percentage of the initial capital.
* Drawdown%: The maximum drawdown of the deposit for the entire test period.
* Max Length: The maximum duration of one transaction in days, hours and minutes.
* Trades: The total number of completed trades.
2. Examine the winning parameters:
* To the right of the performance metrics are columns showing the exact settings that led to this result ('SO Count`, SO Step, TP (%), etc.).
3. How to choose the best strategy?
* Don't chase after the maximum profit! The strategy with the highest profit often has the highest drawdown, which makes it extremely risky.
* Seek a balance. The ideal strategy is a compromise between high profitability, low drawdown (Drawdown) and the maximum length of trades acceptable to you (Max Length).
* finalScore was created to find this balance. Trust him — he often highlights not the most profitable, but the most stable and reliable options.
Detailed Description Of The Settings
This section serves as a complete reference for each parameter available in the script settings. The parameters are grouped in the same way as in the indicator interface for your convenience.
Group: ⚙️ Optimization Settings ⚙️
The main parameters governing the testing process are collected here.
* `Enable Optimizer': The main switch. Activates or deactivates all backtesting functionality.
* `Direction': Determines which way trades will be opened during the simulation.
* Long: Shopping only.
* Short: Sales only.
* Both: Testing in both directions. Important: This mode only works in conjunction with an External Signal, as the script needs an external signal to determine the direction for each specific transaction.
* `Signal Mode`: Controls the conditions for starting a new trading cycle (opening a base order).
* No Signal: A new cycle starts immediately after the previous one is completed. This mode is used to test "pure" grid mechanics without reference to market conditions.
* External Signal: A new cycle begins only when a signal is received from an external indicator connected via the Signal field.
* `Signal': A field for connecting an external signal source (works only in the `External Signal` mode). You can select any other indicator on the chart.
* For Long** trades, the signal is considered received if the value of the external indicator ** is greater than 0.
* For Short** trades, the signal is considered received if the value of the external indicator ** is less than 0.
* `Bars Count': Sets the depth of the history in the bars for the backtest. The maximum value (25000) provides the most reliable results.
* `Sort by`: A key criterion for selecting and ranking the best strategies in the final table.
* FinalScore: Recommended mode. A comprehensive assessment that takes into account 9 metrics to find the most balanced and sustainable strategies.
* Profit: Sort by net profit.
* Drawdown: Sort by minimum drawdown.
* Max Length: Sort by the minimum length of the longest transaction.
* `Combinations Count': Indicates how many of the best strategies (from 1 to 50) will be displayed in the results table.
* `Close last trade`: If this option is enabled, any active trade will be forcibly closed at the closing price of the last historical bar. For grid strategies, it is recommended to always enable this option in order to get the correct calculation of the final profit and eliminate grid strategies that have been stuck for a long time.
Group: 💰 Money Management Settings 💰
The parameters in this group determine the financial conditions of the simulation. Specify values that are as close as possible to your actual values in order to get reliable results.
* `Capital': The initial deposit amount for the simulation.
* `Leverage`: The leverage used to calculate the margin.
* `Slippage` (%): Simulates the difference between the expected and actual order execution price. The specified percentage will be applied to each transaction.
* `Commission` (%): The trading commission of your exchange as a percentage. It is charged at the execution of each order (both at opening and closing).
* `Liquidation Level' (%): Maintenance Margin Ratio. This is a critical parameter for a realistic test. Liquidation in the simulator occurs if the Equity of the account (Capital + Unrealized P&L) falls below the level of the supporting margin.
Group: 🛠 Optimization Parameters 🛠
This is the "heart" of the optimizer, where you set ranges for iterating through the grid parameters.
* `Part`: The portion number of the combinations to be tested. Start with 1, and then increment (`2`, 3, ...) sequentially to check all generated strategies.
* `Combinations in Part': The number of backtests performed at a time (in one "Part"). Increasing the value may speed up the process, but it may cause the script to error due to platform limitations. If an error occurs, it is recommended to switch to the step below and back.
Three fields are available for each of the following parameters (`SO Count`, SO Step, SO Multiplier, etc.):
* `Min`: Minimum value for testing.
* `Max': The maximum value for testing.
* `Step`: The step with which the values in the range from Min to Max will be iterated over.
There is also a checkbox for each parameter. If it is enabled, the parameter will be optimized in the specified range. If disabled, only one value specified in the Min field will be used for all tests.
* 'Stop Loss': In addition to the standard settings Min, Max, Step, it has an additional parameter:
* `Type`: Defines how the stop loss price is calculated.
* From entry point: The SL level is calculated once from the entry price (base order price).
* From breakeven line: The SL level is dynamically recalculated from the average position price after each new safety order is executed.
Group: ⚡️Filters⚡️
Filters allow you to filter out those results from the final table that do not meet your minimum requirements.
For each filter (`Max Profit`, Min Drawdown, `Min Trade Length`), you can:
1. Turn it on or off using the checkbox.
2. Select the comparison condition: Greater (More) or Less (Less).
3. Set a threshold value.
*Example:* If you set Less and 20 for the Min Drawdown filter, only those strategies with a maximum drawdown of less than 20% will be included in the final table.
Group: 🎨 Visual Settings 🎨
Here you can customize the appearance of the results table.
* `Position': Selects the position of the table on the screen (for example, Bottom Left — bottom left).
* `Font Size': The size of the text in the table.
* `Header Background / Data Background`: Background colors for the header and data cells.
* `Header Font Color / Data Font Color`: Text colors for the header and data cells.
Important Notes and Limitations
So that you can use the Autoback Grid Lab as efficiently and consciously as possible, please familiarize yourself with the following key features of its work.
1. It is a Tool for Analysis, not for Signals
It is extremely important to understand that this script does not generate trading signals in real time. Its sole purpose is to conduct in—depth research (**backtesting**) on historical data.
* The results you see in the table are a report on how a particular strategy would have worked in the past.
* The script does not provide alerts and does not draw entry/exit points on the chart for the current market situation.
* Your task is to take the best sets of parameters found during optimization and use them in your real trading, for example, when setting up a trading bot or in a manual trading system.
2. Features Of Calculations (This is not a "Repainting")
You will notice that the results table appears and is updated only once — when all historical bars on the chart are loaded. It does not change in real time with each tick of the price.
This is correct and intentional behavior.:
* To test thousands, and sometimes millions of combinations, the script needs to perform a huge amount of calculations. In the Pine Script™ environment, it is technically possible to do this only once, at the very last bar in history.
* The script does not show false historical signals, which then disappear or change. It provides a static report on the results of the simulation, which remains unchanged for a specific historical period.
3. Past Results do not Guarantee Future Results.
This is the golden rule of trading, and it fully applies to the results of backtesting. Successful strategy performance in the past is not a guarantee that it will be as profitable in the future. Market conditions, volatility and trends are constantly changing.
My tool, especially when sorting by finalScore, is aimed at finding statistically stable and reliable strategies to increase the likelihood of their success in the future. However, it is a tool for managing probabilities, not a crystal ball for predicting the future. Always use proper risk management.
4. Dependence on the Quality and Depth of the Story
The reliability of the results directly depends on the quantity and quality of the historical data on which the test was conducted.
* Always strive to use the maximum number of bars available (`Bars Count: 25,000`) so that your strategy is tested on different market cycles (rise, fall, flat).
* The results obtained on data for one month may differ dramatically from the results obtained on data for two years. The longer the testing period, the higher the confidence in the parameters found.
Conclusion
The Autoback Grid Lab is your personal research laboratory, designed to replace intuitive guesses and endless manual selection of settings with a systematic, data—driven approach. Experiment with different assets, timeframes, and settings ranges to find the unique combinations that best suit your trading style.

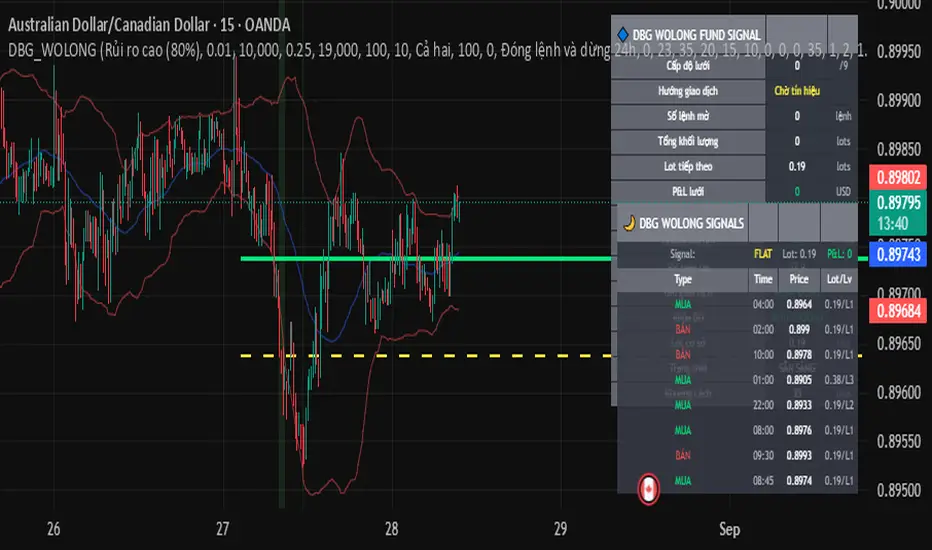
DBG X WOLONG FUND Indicator DBG X WOLONG FUND SIGNAL – Grid Trading Strategy
Description
This Pine Script indicator provides a grid-based trading framework that combines technical filters with systematic order placement. It is designed for analyzing market structure and studying how grid systems react under different market conditions.
Key Features
Technical Filters
Bollinger Bands (35-period): Used to identify price extremes relative to volatility.
RSI Filter (20-period): Optional momentum filter for entry conditions.
ATR-based Grid Spacing: Dynamic adjustment of order intervals.
Breakout Detection: Identifies when price moves outside defined levels.
Grid Mechanics
Position Sizing Options: Includes multiplier-based sizing rules.
Maximum Grid Levels: Up to 9 layers can be configured.
Weighted Exit Calculation: Uses average position levels for take profit management.
Stop Loss Options: Can be set individually per order or on a portfolio basis.
Risk Parameters
Lot Calculation Methods: Fixed, dynamic, or equity-based percentage.
Drawdown Limit: Ability to stop new orders when a predefined loss threshold is reached.
Session Control: Trading activity can be filtered by time of day (GMT).
Direction Control: Long-only, short-only, or both directions.
Visual Components
Dashboard: Displays grid status, open exposure, and drawdown levels.
Labels & Lines: Entry points, position sizes, take profit, and stop levels.
Trade Log: Shows recent activity with timestamps.
How It Works
Entry signals may be triggered when price moves outside Bollinger Band ranges.
RSI filter can confirm or reject potential entries.
When price moves against the position, additional orders are placed at defined grid intervals.
Position sizing can be scaled based on multipliers.
Grid closes when the average take profit target is reached or stop criteria are met.
Default Settings
Grid spacing: ATR-based (approx. 35 pips)
Take profit: 10 pips on the first order
Max orders: 9 grid levels
Example risk allocation: 20% equity
Default trading hours: 24/7
Possible Applications
Studying price behavior in sideways markets.
Analyzing potential mean reversion setups.
Running multi-pair experiments for portfolio observation.
Exploring risk allocation models under grid conditions.
Alerts
New entry signals
Drawdown threshold reached
Grid maximum level triggered
Grid cycle completed
⚠️ Disclaimer:
This script is intended for educational and analytical purposes only. It does not guarantee profits and should not be considered financial advice. Test thoroughly on historical data before considering any live application.
Lot Size & Risk Calculator [FunkyMax]🔹 Overview
This script is a lot size and risk management calculator directly integrated into your chart.
It automatically determines the optimal position size based on your account balance, chosen risk percentage, and stop-loss distance.
In addition to risk calculation, the script also displays Entry, Stop-Loss, and Take-Profit levels on the chart, along with a dashboard panel summarizing all key trading information:
Account balance
Selected risk %
Amount at risk
Optimal lot size
Stop & TP distances in pips
Risk/Reward ratios (R:R)
Potential profit for each TP
Contract size & pip size
🔹 Key Features
✅ Automatic lot size calculation based on:
Account balance
Risk %
Stop-Loss distance
✅ Clear visual display:
Dynamic labels for Entry, Stop, and TP (supports 1 or 2 TPs)
Colored lines (green for TP, red for SL, blue for Entry)
Profit/Loss zones filled on the chart
✅ Dashboard panel:
Compact summary displayed on-screen (position customizable)
Real-time automatic updates
✅ Automatic asset detection:
Forex: contract size = 100,000 (pip = 0.0001 or 0.01 for JPY pairs)
Gold (XAUUSD): contract size = 100 (pip = 0.1)
Indices & crypto: contract size = 1 (pip = 1.0)
Manual override available (custom contract & pip size)
✅ Multi-currency support:
Display in USD or EUR
🔹 How to Use
Add the indicator to your chart then define entry price, stop-loss, Take-Profit targets (TP1 & TP2) by clicking directly on chart. Then, configure settings of the indicator as needed :
1. Basic settings (Money Management tab):
Enter your account balance (e.g., $1000).
Select your risk percentage (e.g., 1%, 2%, 3%).
Choose your deposit currency (USD or EUR).
2. Trading levels (Levels tab):
Set your Entry price.
Define your Stop-Loss (SL).
Add up to two Take-Profit targets (TP1 / TP2).
3. Chart display:
Toggle levels on/off with Display TP & SL on chart.
Levels appear automatically with lot size and R:R ratio.
4. Dashboard (Dashboard tab):
Choose text size (Normal / Small).
Position the info panel anywhere (top/bottom/left/right).
🔹 Benefits
Time-saving: no more manual lot size calculations
Risk control: enforces consistent money management
Versatility: works across Forex, Gold, Indices, Crypto
Clarity: instant visualization of risk and potential reward
🔹 Limitations
Pip value may vary depending on your broker (CFDs, Futures, etc.). Double-check with your platform.
Educational purpose only: this script is not financial advice.
🔹 Author
Script developed and optimized by FunkyMax.

ST+ TP1-TP5 + CALL/PUT 1. The Indicator's General Concept
The indicator works by:
Using the Supertrend indicator to determine when a new trend (bullish or bearish) begins.
Once a new trend is detected:
It determines the entry price.
It calculates the stop-loss (SL).
It calculates five profit levels, TP1 to TP5.
It draws horizontal lines on the chart representing the entry, SL, TP1-TP5, with labels on the right side (as shown in the image).
It can also display a CALL or PUT symbol above the signal candle.
It tracks price movement to determine if a target has been reached or if the stop-loss has been hit.
2. The Inputs That Control the Indicator
You can modify these values according to your strategy:
ATR Length → The number of candles used to calculate volatility.
Supertrend Factor → Controls the sensitivity of the supertrend. (The higher the value, the fewer the signals.)
TP1 to TP5 → ATR multipliers to set targets.
SL → ATR multiplier to set stop loss.
Extend Bars → The distance the lines extend to the right before the bar.
Show CALL/PUT → Shows or hides the trend signal.
Show TP Flags → Enables or disables small TP flags above the candles.
3. Determining the Trend
The indicator uses Supertrend to determine:
Is the market in an uptrend or a downtrend?
If the trend changes from bearish to bullish, it registers a CALL signal.
If the trend changes from bullish to bearish, it registers a PUT signal.
The first candle at which this change occurs is called a reversal candle.
4. Calculating Levels
When a reversal candle occurs:
Entry price = closing price of the candle.
Stop Loss (SL):
For an uptrend = Price - ATR × Multiplier.
For a downtrend = Price + ATR × Multiplier.
Profit Levels (TP1, TP5):
If up → Price + ATR × (multipliers).
If down → Price - ATR × (multipliers).
5. Drawing Lines and Labels
Draws horizontal lines representing:
Entry (green)
SL (red)
TP1-TP5 (blue)
Places labels on the right side of the chart, as shown in the image:
Each label shows the price level.
The label reads: "TP1: 123.45" or "Entry: 120.00", etc.
The positions of the lines and labels are updated automatically with each new candle.
6. Showing CALL and PUT Signals
If the new trend is up, a green CALL label will appear above the reversal candle.
If the new trend is down, a red PUT label will appear above the reversal candle.
7. Target Tracking and Stop Loss
The indicator tracks each candle after the signal:
If the price touches one of the targets (TP1 to TP5):
It marks this target.
It stops tracking this target so that it does not repeat the signal.
If the price touches the Stop Loss (SL):
It closes the trade and stops tracking completely.
8. Blue Flags Option
There is an additional option:
If you enable it, a small blue flag will appear above or below the candle when any target is reached.
If you disable it, you won't see these flags; you'll just see the sidebars and labels.
9. Live and Dynamic Update
The indicator uses an automatic update every minute.
Ensures that all lines and labels remain fixed at the last candlestick of the analysis.
10. Trade Lifecycle
Wait for a reversal in a supertrend.
At the first reversal → set Entry/SL/TP1..TP5.
Draw lines and labels on the chart.
Monitor price action:
If any TP is met → mark it as met.
If the SL is reached → cancel the trade.
Wait for a new signal to begin a new cycle.
Conclusion
The indicator provides you with a complete visual trading system.
Defines entry points, stop-losses, and profit targets.
Everything is displayed on the chart with clear colored lines and labels.
Keeps targets organized and prevents duplicate signals.
Can be used on any timeframe or market.
