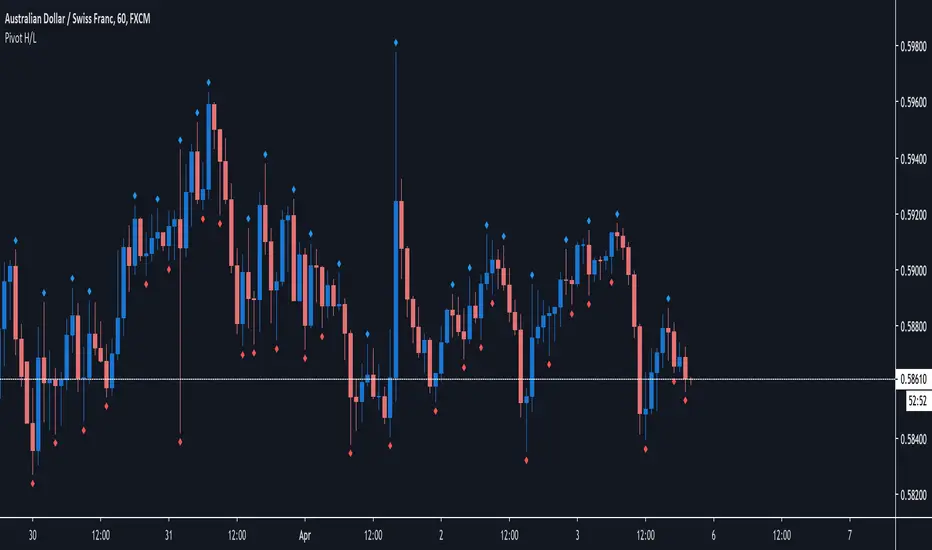
Pivot H/LPivot high low based on 3 candles. Pivot low= low->lower low->higher low. Pivot high = high->higher high> lower high.
That shows me referal points where i would like to setup stop loss.
It also shows me trend or rotation and supports and rezists.
"pivot" için komut dosyalarını ara
Pivot Data [QuantVue]The Pivot Data Indicator is designed to provide traders with valuable insights by identifying and analyzing pivot points on the price chart. It calculates both pivot highs and lows, then presents detailed statistics on the distance and time between these pivots.
a pivot point is defined as a specific point on the chart where the price either reaches a high or a low, with no bars higher or lower than it for a set number of bars on both sides (left and right). Essentially, it's a local high or low point, with the market moving in the opposite direction after the pivot forms.
For example:
A pivot high occurs when there are no bars with higher prices for a specified number of bars before and after that point.
A pivot low occurs when there are no bars with lower prices for the same number of bars on either side.
The number of bars to the left and right is adjustable via the Pivot Lookback Bars setting, allowing you to define how many bars are used to determine these pivot points.
Key features include:
Pivot Highs and Lows Identification: Automatically marks significant pivot highs and lows based on a user-defined lookback period, helping traders identify potential trend reversals or continuation points.
Prediction Labels: Provides forecasted pivot levels based on historical pivot price and time patterns, with options to show predictions for pivot highs, lows, or any pivot point.
Customizable Table Display: Displays a table summarizing important statistics, such as the average price percentage and the number of bars between pivots, along with the distance and time from the most recent pivot.
Traders can use this tool to map out potential levels of support and resistance based on historical data on pivot points.

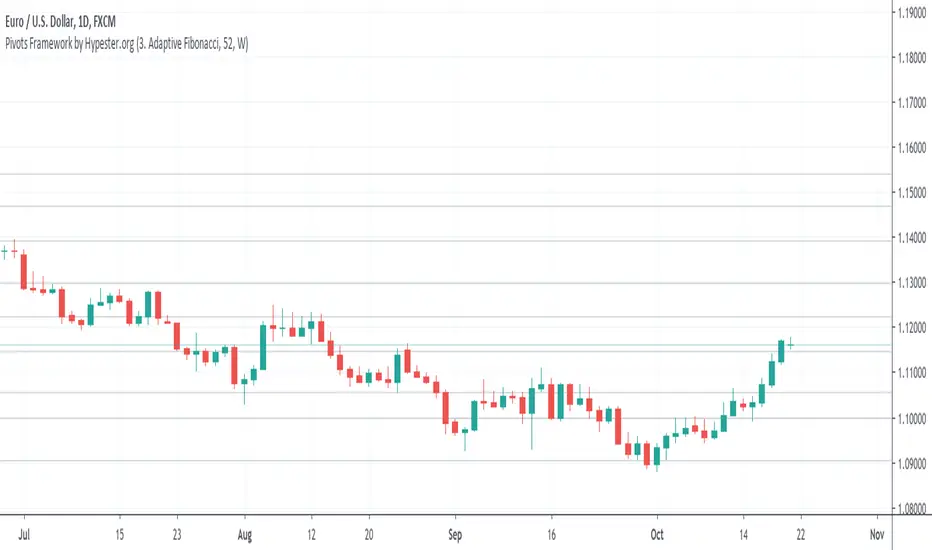
Pivots Framework by HypesterThis is the first release of the basic pivot framework with the three most used ones by our Alpha Community.
You can easily switch between modes, adjust the lookback period, and it works multi-resolution.
Right now, we have:
BB Fibo
Murrey's Channels
Adaptive Fibonacci
The next release will be ATR based pivot formula.
Pivot Point Profile [LuxAlgo]The Pivot Point Profile indicator groups and displays data accumulated from previous pivot points, providing a comprehensive method for prioritizing and displaying areas of interest directly given by swing highs and lows.
Users have access to common settings present in other profile-type indicators.
🔶 USAGE
The Pivot Point Profile is particularly helpful in identifying highly active reversal zones that have been visited multiple times by price. Because of this, we could generally expect these areas to serve as future points of interest, often acting as support or resistance when re-visited.
The profile displays data associated with both Pivot Highs and Pivot Lows. Each row consists of pivot high and pivot low counts side-by-side, forming the total width of the row.
By analyzing the row as a whole, we can gain a better understanding of WHERE to look for interactions.
By analyzing the pivot counts independently, we can gain a better understanding of WHAT to expect when returning to these areas.
For example:
If a row in the profile contains entirely Pivot Lows, this could be seen as an indication to look for buyers to hold that level for a continuation upwards. A break of this level could be interpreted as a lack of interest from previous buyers at this level, indicating a further move down.
🔹 Concentrated Areas
Each row in the profile displays the current count of high pivots and low pivots within the selected lookback. The largest count for each pivot direction is identified as a "Concentrated Area (CA)", these CAs are highlighted over the chart with a line displaying the average of all pivots within that CA. The CA Average is the average of all pivot points (in the majority direction) within the given row.
These can hold more importance as potential support/resistance areas.
Note: The CA Threshold can be manually adjusted to highlight all rows based on a user-selected value.
🔶 DETAILS
🔹 Calculation
The idea behind the Pivot Point Profile is a new analysis method for pivot points, taking the idea of a volume profile and adapting it to display pivot points instead of volume. By using this data, in theory, we should be able to better prioritize zones to anticipate reversals, as well as identify key levels to watch for buyer & seller interactions to use as confirmations in direction.
The (vertical) width of each row is the product of the script's "Row Size", this is the number of rows that the profile will consist of. With a max of 250, the profile can be decently granular. That being said, A more granular profile will have fewer overlapping pivot points. By decreasing the row size (Using fewer rows in the profile) you will increase the tolerance for grouping pivot points. Potentially leading to a more comprehensive Profile. Inversely, By reducing the tolerance for grouping, you will better visualize only similar highs and lows but may have noisier data to sift through.
The Profile is calculated based on a "Lookback" parameter, using only the lookback amount of previous high and low pivots to calculate the profile. Configuring this parameter alongside "Pivot Length", will allow for great control over the frame of reference of the profile.
Note: This indicator is capable of utilizing the full chart history of pivot points, this can be done by enabling the "Use Full Chart History" setting, this will cause the script will calculate from everything it has access to on your current chart.
🔹 Display
The Pivot Point Profile display can be customized to fit a various range of chart styles and visual needs. The specific settings to adjust these can be located in the "Profile Display" Section of the User Inputs.
Profile Width: Sets the Left to Right Width of the Profile. This is the maximum width that the profile will occupy and will scale to fit within this width.
Profile Offset: Sets the distance of the Profile's Axis from the current chart candle. This moves the entire profile left and right to enable to user to set the distance between the profile and the current candle.
Direction: Changes the display direction of the profile, allowing for "Left", "Right", or "Center" display styles.
🔶 SETTINGS
🔹 Pivot Point Parameters
Pivot Type: Choose between "Fractal Pivots" or "SMC Structure" to use as the basis for pivots.
Length: Sets the length for the pivot calculations.
🔹 Profile Calculations Parameters
Lookback: Sets the number of pivots to calculate within, in increments of high and low pairs. (Setting this to 1 = 1 Pivot High & 1 Pivot Low)
Use Full Chart History: Disregards the set lookback and instead uses all available chart data to calculate from.
Row Size: Sets the total number of rows to calculate the profile with.
🔹 Profile Display
Profile Width: Sets the max left & right width (in bars) that the profile will occupy.
Profile Offset: Sets the distance of the profile axis from the last chart bar.
Direction: Sets the display direction
🔹 Concentrated Areas
Highlight CAs: Extends the rows left from concentrated areas.
CA Threshold: Manually set the threshold for determining concentrated areas, when disabled, only the largest rows will be displayed.
CA Averages: Toggles the concentrated area averages for each pivot direction.
Note: CA Averages can be displayed independently without CA Highlights being displayed, and vice versa.

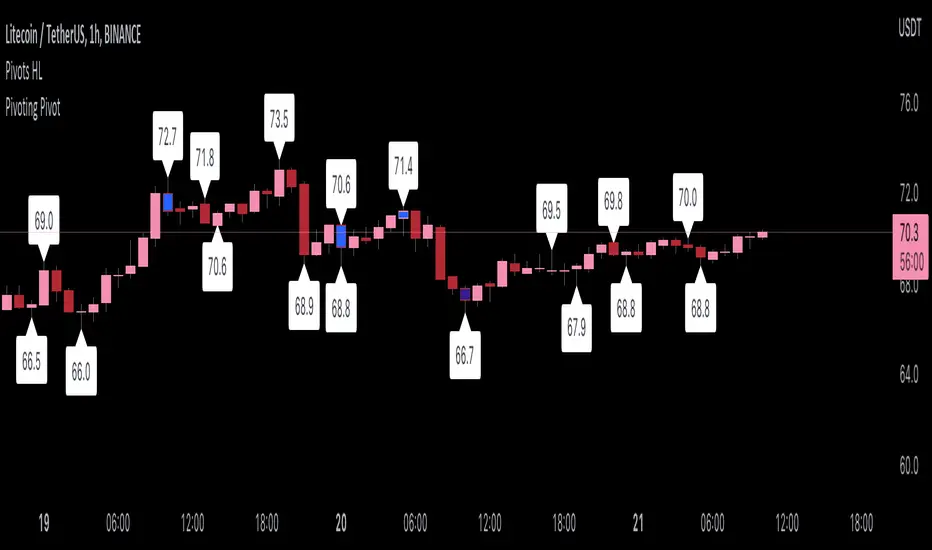
Pivoting PivotMany people use Pivots when conducting analysis, but I don't see many people using pivoting pivots. Pivoting pivots are pivots that don't have any other pivots around them. They can be useful when trying to separate pivot clusters from important pivot points.
The code is calculated by finding the distance between two candlesticks (left check), then calculating the distance between the last pivot and the current candlestick.
On the chart: labels are TradingView's official pivot high and pivot low script, and the blue candle color is my pivoting pivots (both with a look left and look right of 2).
Special thanks to @fikira for helping me with ideas for the calculations!
Pivot Average [Misu]█ This Indicator is based on Pivot Points.
It aggregates closed Pivot Points to determine a " Pivot Average " line.
Pivot Points here refer to highs and lows.
█ Usages:
Pivot Average can be used as resistance or breakout area.
It is also very usefull to find battle zones.
It can also be used as a trend indicator: when the price is below, trend is down, when price is above, trend is up.
Mixed with momentum/volatility indicator it is very powerfull.
█ Parameters:
Deviation: Parameter used to calculate pivots.
Depth: Parameter used to calculate pivots.
Length: History Lenght used to determine Pivot Average.
Smoothing MA Lenght: MA lenght used to smooth Pivot Average.
Close Range %: Define price percentage change required to determine close pivots.
Color: Color of the Pivot Average.

Pivot Points on SR lines DEMOAnalyzing price movements for a few years taught me one thing - markets always reverse bouncing off some horizontal Support/Resistance level. The only exception to this rule is when market pops new ATH (All Time High), which certainly happened in so-called "price discovery" run - this asset has never been in this space before, so no Support/Resistance could have been formed, while the rally had to stop at some point anyway.
In all other cases, analyzing past market movements, you will be able to find a place where the market reversed or gathered before. The difficulty is to understand (or guess?) from which S/R level market will reverse right now, because there are many of them. Even if this is probably not possible to make such guess correctly and always, it is good to know when potential reversal shown by whatever indicator you're using happened on SR line or in the middle of nowhere. That last case would turn out to be fake to your worst regrets. Ability to filter-out all those fake pivots is a value my indicator delivers.
Example? It is very often considered an entry signal when Stochastic %K and %D lines cross each other, especially in overbought/oversold area. It could work quite well in sideways markets, but when a trend begins, Stochastic would report CONSECUTIVE counter-trend signals, draining your trading balance to zero quickly. But this trend took place in price-discovery area (not necessarily when going for the new ATH ), so all those counter-trend signals happened not at S/R levels. Hence, they should be ignored.
Big triangles mark pivot point which happened on the S/R line. Small triangles - in the middle of nowhere.
How good is it? I compared it with one of my previous scripts, the "PivotPoints with Momentum confirmation" (), this new script confirms only 1/3 of pivots in the old script on 1m EURUSD chart. Filtering out 2/3 of potentially bad entries is a good result, I'd say :)
This script also fires alerts - alert is triggered as soon as PivotPoint is noticed, on a candle close.
I strongly recommend NOT using it not using this indicator as a standalone indicator. There is so much information you should take into consideration as well - market bias, volume , higher timeframe trend... To make it convenient to join PivotPoints information with other indicators, I have "exported" one plot so you can include it in your own - just use input.source in your own code to have it return 1 for PivotLow ( aka Long entry) and -1 for PivotHigh ( aka Short entry).

Pivot Points, by @juanmirocks# Advantages over TV's indicator "Pivot Points Standard"
1. Show pivot lines for all history, which lets you gauge trading strategies throughout time
2. More sensible Default/Auto time frame; e.g. on intradays only and always the market values of yesterday's Day are used
3. The halves between the key levels are also shown, which it's useful for some trading strategies
4. Arguably out-of-the-box nicer interface
Pivot Points as an indicator is a traditional strategy to draw resistance and support levels. It's best suited for intraday trading: the pivot points and resulting key levels are calculated from yesterday's market values (H, L, C). More details in the script's source.
Pivot Points trading is suitable for any market, and best for intraday (e.g. 3 min).

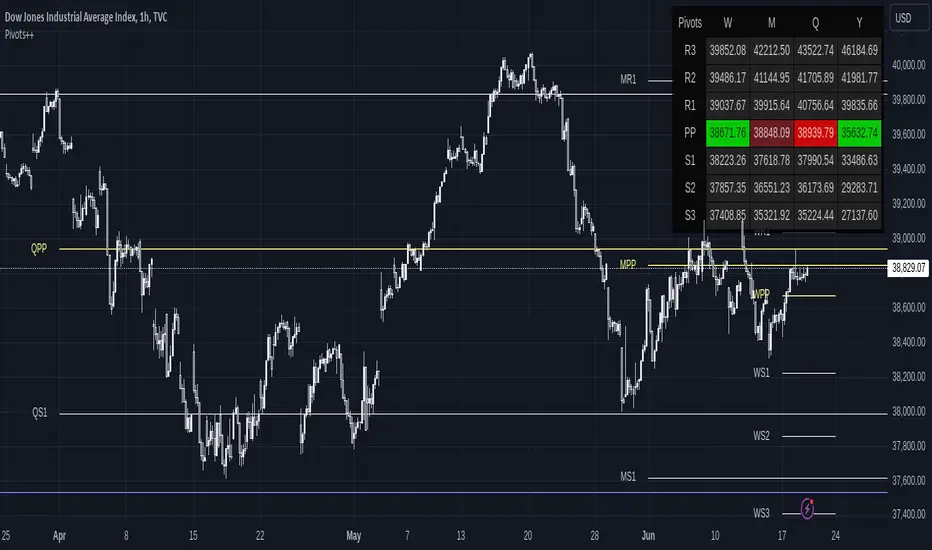
Pivot Points ++The Pivot Points is a classical indicator that aims to assess the Location in which a market is trading and infer hints about its directional movement. Its concept idea has been evolving along the XX century, tracing back to traders like Jesse Livermore, Nicholas Darvis, William O’Neil and Mark Minervini.
This is a Leading Indicator which computes a series of key levels that might act as Support and Resistance over the selected time frame period.
This version of the Pivot Points delivers a convenient way to visualize its information. It’s been designed for it to be useful to a variety of trading styles: from the ones that use it to detect reversal points, to the ones that gauge the market at a single glance.
HOW TO READ THE PIVOT POINTS
Pivot Points set a series of price levels which remain constant through the time period (which could be: daily, weekly, monthly, yearly or multi-yearly).
At the beginning of a new time period, it calculates the main Pivot Point Level (PP), and depending on the type, it can compute up to 5 Support Levels (S1 to S5) and 5 Resistance Levels (R1 to R5).
Being such a universal indicator, there exist many ways of reading the Pivot Levels. Now, let’s see some common uses of the indicator.
Warning: Please don’t rely on a single indicator to make your trading decisions, but rather integrate it into a coherent system combining it with complementary signals.
Support and Resistance : This is a straightforward approach. Each Pivot Level may act as Support or Resistance. For instance the level S1 initially behaves as Support. As price gets closer, one may observe that the level is being respected and price bounces around the level. Or in case it would get broken, then it would automatically shift its role into a Resistance Level.
Mood Gauge : One can quickly gauge the mood of the market by seeing where price stands in relation to the Main Pivot Point Level (PP). Above the Pivot point is generally interpreted as bullish, whilst standing below implies a bearish tone.
Stop Loss and Profit Levels : When entering on a trade, one can use the Pivot Levels to set the Stop Loss behind it, or set the Take Profit in an area surrounding it.
Agreement with Fibonacci Retracements or Expansions : One can combine the power of these 2 leading indicators in search for Agreement areas where to find both a significant Pivot Level and a Relevant Fibonacci Level.
Volume or Volatility Squeezes : Some traders focus on the Pivot Levels in combination with Volume or Volatility readings, in order to anticipate turning points or continuation legs.
WHY WOULD YOU BE INTERESTED IN THIS INDICATOR?
Pivot Points ++ has been designed to address the needs of dedicated traders. Let’s review its main features.
Display up to 9 sets of Pivot Points simultaneously
Long term view: As an analyst and as a trader, being able to display many sets of Pivot Points simultaneously is of great advantage when assessing long term views on the market.
Pivot Levels clearly Identified: Each set of Pivot Points get clearly identified with a prefaced letter indicating its time frame, i.e. Yearly Pivot Point appears as YPP and Monthly Pivot Resistance 1 appears as MR1 .
Minimalistic coloring: The Main Pivot Levels are highlighted in color to stand out, yet the intention of the indicator is to be as minimalistic and keep the chart as clean as possible.
Display Pivots as a Panel
Panel View: Display the Pivot Points’ information in the way that better suits your charting style. In addition to displaying the lines over the price chart, the indicator allows displaying the data on a Panel. The Panel view can be used together with the Line view, or it can be used in isolation.
Fully customizable: Its location, size and its design parameters can be customized through the Settings tab.
Common sense formatting: It displays a column for each of the selected time frames, and a row for each of the selected Pivot Levels. When a Pivot Level displays in colors, it means that price is currently trading above (green) or below (red) that level. Moreover, when the current price is trading just near the Pivot Level, the color shifts to Dark Red when it’s acting as a Resistance, and Dark Green when it acts as Support.
Keep your Chart Clean!
Disciplined traders keep their charts clean. One needs proper focus to trade in the zone.
Please check how the chart on the left looks compared to the one on the right. Both display exactly the same Pivot Points.
The chart on the left contributes to a more minimalistic display of information, as for when a trader wishes to quickly check where the price is trading in relation to the Pivot Points. Moreover, the chart on the right has the advantage to display clearly the Reversals and Price Reactions in relation to the Pivot Points. The decision is yours.
Show only Pivots Relevant to the Current Time Frame
The sets of Pivot Points belonging to time frames Below or Near the current Time Frame get hidden to prevent overcrowding the chart with lines. Nevertheless, this feature can be disabled through the Settings tab.
These are the preset Time Frames:
Intraday/Scalping: Those operating on time frames below 1H will be able to see the whole range of Pivot Levels.
1H: Traders operating on 1-Hour Charts display Pivots from Weekly and above. Daily Pivot Points get hidden.
4H: On 4-Hour Charts, Monthly Pivots and above get displayed. Weekly Pivot Points get hidden.
D: On Daily Charts, Quarterly Pivots and above get displayed. Monthly Pivot Points get hidden.
W: On Weekly Charts, Yearly Pivots and above get displayed. Quarterly Pivot Points get hidden.
M: On Monthly Charts, Tri-Yearly Pivots and above get displayed. Yearly and Bi-Yearly Pivot Points get hidden.
3M and 12M: Above Monthly Charts, only Decennial Pivots get displayed. All the rest get hidden.
Good Looking right off the box
It looks good: The indicator will look just fine on most of the charts. It displays well on dark themed charts and on light themed charts. No need to mess up with the coloring of the indicator for it to display properly.
Fully customizable: Nevertheless, you can easily override the defaults and customize the Colors and Line Styles for each Pivot Level.
Displays True on Heikin Ashi Charts
That’s good news for scalpers, because Pivot Points get computed correctly even when being displayed over Heiken Ashi charts.
SETTINGS
Now let’s dive into the settings of this indicator.
Display : It allows to enable/disable the display of the following:
Lines and Panel : Switch on/off the general view of the Lines over the chart or the Panel.
Pivot, R1 to R5, S1 to S5 : Select which Pivot Levels will be displayed.
Labels and Price : It applies only to Lines. Allows to select which information to display near the Pivot Level, and whether to place it right or left of the line.
Auto Hide Pivots from Near Time Frames : By default it hides the sets of Pivot Points from time frames near the current one. Disabling this one allows to display all the Pivot Points from higher time frames, regardless whether they are near.
Move Pivots to the Right : This selection moves all the current Pivot Points to the Right Hand Side of the Chart, in order to keep the main area of the chart clean of lines. This setting allows customizing the how far to the right from the last candle (Offset) and how wide to draw the levels (Width).
Pivots : It sets up the conditions for each of the 9 sets of Pivot Levels. It includes the following:
General checkmark : Allows displaying or hiding that set of Pivots.
Time Frame : Select the time frame for which the Pivot Point will be computed.
Type : Select the type of Pivot Point: Traditional, Fibonacci, Woodie, Classic, DM or Camarilla.
Lines : Enable/Disable the display of this Pivot as Lines over the chart.
Panel : Enable/Disable the display of this Pivot in the Panel.
Panel Display : It allows customizing the position of the Panel. It includes the following:
Vertical Position : Top, Middle or Bottom of the chart.
Horizontal Position : Left, Center or Right of the chart.
Size of the Panel : Auto, Huge, Large, Normal, Small or Tiny.
Parameters : It applies only to the Line View. It includes the following:
Pivots Back : By default the indicator only shows the current Pivot Levels, but it can display up to 10 past instances of each pivot.
Support and Resistance Price Reference : It allows to specify which price should it take into account to define a Pivot Level acting as Support or Resistance.
Support and Resistance % Area : It defines the size of the zone around each Pivot Level in which it acts as Support or Resistance.
Theming Panel : It applies only to the Panel View. It allows customizing every color used in the Panel.
Theming Pivot #1 to #9 : It applies only to the Line View. It includes the following:
Thickness : Customize the line thickness for all the lines within that set of Pivot Points.
Style : Customize the line style for all the lines within that set of Pivot Points. It can be drawn as a Solid, Dotted or Dashed line.
Colors : Customize the color for each Pivot Level.
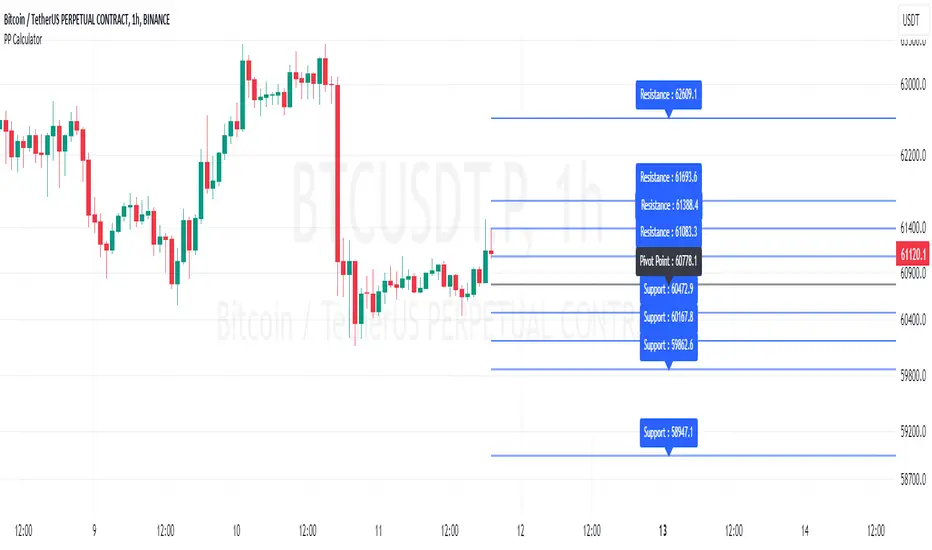
Pivot Point Calculator [JP&Dia]English User Guide
Script Name: Pivot Point Calculator
What Does This Script Do? This script calculates classic and Camarilla pivot points used in financial markets. Pivot points are used to identify key support and resistance levels, and this script helps traders better understand market movements.
How to Use It?
Add the script to your charts on TradingView.
Enter your desired time frame in the “Enter Time Frame” field (e.g., M, W, D).
Choose either or both “Classic Pivot” and “Camarilla Pivot” options to display them.
The script will automatically calculate the pivot points and display them on the chart.
Why Is This Script Unique? This script combines both classic and Camarilla pivot calculations, allowing users to easily utilize both pivot styles through a single script.
How Can People Benefit? Traders can use this script to identify potential buy-sell points and market trends. They can also conduct their market analyses more efficiently and effectively.
Script Adı: Pivot Noktası Hesaplayıcı
Script Ne İşe Yarar? Bu script, finansal piyasalarda kullanılan klasik ve Camarilla pivot noktalarını hesaplar. Pivot noktaları, önemli destek ve direnç seviyelerini belirlemek için kullanılır ve bu script, yatırımcıların piyasa hareketlerini daha iyi anlamalarına yardımcı olur.
Nasıl Kullanılır?
Scripti TradingView’deki grafiklerinize ekleyin.
“Zaman Dilimi Girin” alanına istediğiniz zaman dilimini girin (Örneğin: M, W, D).
“Classic Pivot” ve “Camarilla Pivot” seçeneklerinden birini veya her ikisini de seçerek gösterilmesini sağlayabilirsiniz.
Script otomatik olarak pivot noktalarını hesaplayacak ve grafik üzerinde gösterecektir.
Neden Özgü Bir Script? Bu script, hem klasik hem de Camarilla pivot hesaplamalarını birleştirir ve kullanıcıların her iki pivot stilini de tek bir script üzerinden kolayca kullanmalarını sağlar.
İnsanlar Nasıl Faydalanabilir? Yatırımcılar, bu scripti kullanarak potansiyel alım-satım noktalarını ve piyasa trendlerini belirleyebilirler. Ayrıca, piyasa analizlerini daha verimli ve etkili bir şekilde yapabilirler.
Pivot point moving averagesPivot Point Moving Averages builds moving averages from confirmed pivots, not from every bar.
Instead of averaging all highs and lows, this script:
Detects swing pivot highs and pivot lows using a configurable Pivot length (pivotLen).
Converts these sparse pivot prices into continuous series of:
last confirmed pivot low
last confirmed pivot high
Applies a user-selectable moving average (SMA / EMA / RMA / WMA / VWMA) to each of those pivot series.
Plots the two resulting lines and shades the area between them as a pivot value cloud.
Because the lines only move when a new pivot is confirmed, they represent structural acceptance rather than raw volatility. Short “noise” moves and stop hunts between pivots have much less impact on these averages.
You can also enable an optional second pivot MA cloud:
Uses the same Pivot length for structural detection.
Has its own MA length and type.
Can run on a different timeframe (e.g. D, 240, W).
Is projected back onto the current chart so you see local pivot value and higher-timeframe pivot value together.
Why it’s useful
Traditional MAs:
React to every bar.
Move on noise, wicks, and stop runs.
Don’t distinguish between “meaningful” structure and random fluctuation.
This tool uses confirmed pivots, so it is better suited to market structure and phase analysis:
Pivot MA low reflects how demand is stepping up (or down) as new swing lows form.
Pivot MA high reflects how supply is pressing down (or easing) as new swing highs form.
The cloud between them acts as a dynamic, structure-based value area.
Typical interpretations:
Price inside the pivot cloud → balance / fair value area.
Price above the pivot cloud → bullish value expansion.
Price below the pivot cloud → bearish value expansion.
Cloud compressing → possible energy build-up, transition between phases.
Cloud expanding → stronger directional conviction.
With the second cloud enabled on a higher timeframe, you can:
See whether lower-timeframe structure is building with or against the higher-timeframe pivot value.
Use the HTF cloud as a background bias and the LTF cloud for timing and fine-grained context.
Notes
All pivot-based tools have inherent delay: a pivot is only confirmed after pivotLen bars to the right.
On very low timeframes, long pivotLen + long MA lengths will make the lines slower to react.
This is intended as a context and structure tool, not a standalone entry signal.

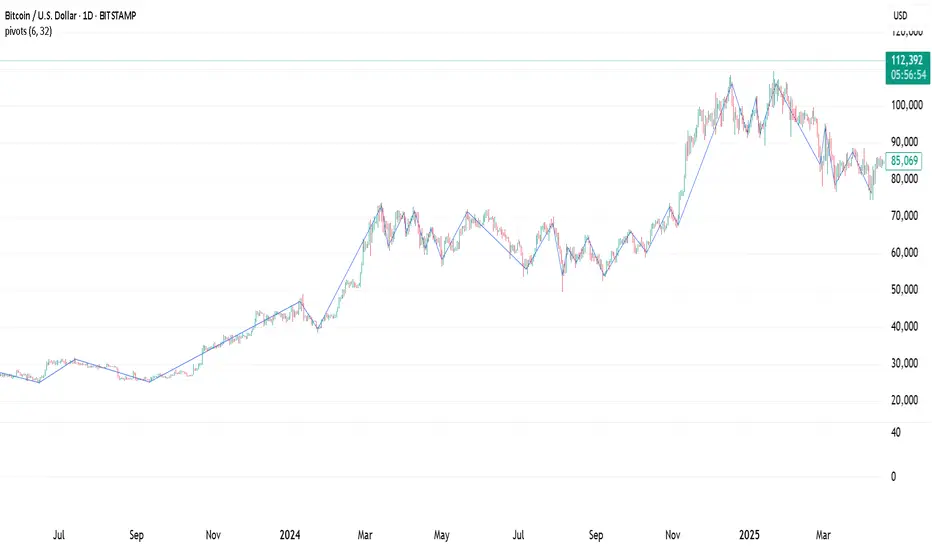
K's Pivot PointsPivot points are a popular technical analysis tool used by traders to identify potential levels of support and resistance in a given timeframe. Pivot points are derived from previous price action and are used to estimate potential price levels where an asset may experience a reversal, breakout, or significant price movement.
The calculation of pivot points involves a simple formula that takes into account the high, low, and close prices from the previous trading session or a specific period. The most commonly used pivot point calculation method is the "Standard" or "Classic" method. Here's the formula:
Pivot Point (P) = (High + Low + Close) / 3
In addition to the pivot point itself, several support and resistance levels are calculated based on the pivot point value.
K's Pivot Points try to enhance them by incorporating multiple elements and by applying a re-integration strategy to validate two events:
* Found_Support: This event represents a basing market that is bound to recover or at least shape a bounce.
* Found_Resistance: This event represents a toppish market that is bound to consolidate or at least shape a pause.
K's Pivot Points are calculated following these steps:
1. Calculate the highest of highs for the previous 24 periods (preferably hours).
2. Calculate the lowest of lows for the previous 24 periods (preferably hours).
3. Calculate a 24-period (preferably hours) moving average of the close price.
4. Calculate K's Pivot Point as the average between the three previous step.
5. To find the support, use this formula: Support = (Lowest K's pivot point of the last 12 periods * 2) - Step 1
6. To find the resistance, use this formula: Resistance = (Highest K's pivot point of the last 12 periods * 2) - Step 2
The re-integration strategy to find support and resistance areas is as follows:
* A support has been found if the market breaks the support and shapes a close above it afterwards.
* A resistance has been found if the market surpasses the resistance and shapes a close below it afterwards.
The lookback period (whether 24 and 12) can be modified but the default versions work well.

PivotBoss Pivots & Camarilla - H,D,W, M timeframe & OHLC LabelsThis is the new pivotboss pivots calculations and also has Camarilla Pivots . User can define which time frame pivots they want to see starting from Hourly, Daily, weekly and monthly. Added labels for each levels. So that user can calculate potential profit targets. This script also includes Hourly and Daily OHLC with labels. Added Developing mid point of the current day. The script can calculate midpoint as and when new highs and lows are made through out the day
Abbrevations used in this script
yHI - Yesterday's session High
dOP - Days open
yCL - yesterday's session Close
yLO - yesterday's session Low
MP -- Developing midpoint of the day
TC - Top channel
P - Pivot Point
BC - Bottom Channel
R1 - R4 -- Resistance levels
S1 - S4 -- Support Levels

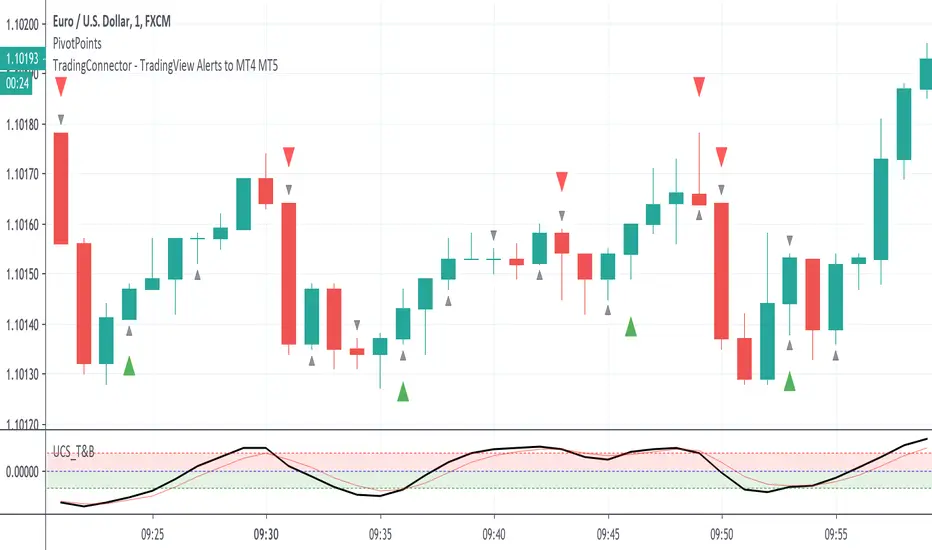
PivotPoints with Momentum confirmation by PeterOWho wouldn't like to be able to tell when the market actually reverses instead of just faking it? Every trader who has tried pivothigh/pivotlow functions for that, surely bumped into so many meaningless reversal signals, that probably got discouraged with this concept entirely.
Yet, pivot points are very important. Only they need to be confirmed at least a little bit (you'll never know for sure, you understand that right?)
This script enhances pivot-points mechanism with by confirming potential pivot point with actual reversal in momentum. If momentum reversal is also noticed in synch with the pivothigh/pivotlow, then you've got yourself a reversal - marked on the chart with red or green triangle. You can visually compare where those triangles are marked as compared to those small black ones, meaning the standard pivothigh(high,1,1)/pivotlow(low,1,1). Check yourself how many times this method would save us from pre-mature entry. On average 2/3 pivot points are filtered out.
This is a non-delayed confirmation - there is no waiting for another candle to close, just looking to another indicator for a match.Trader needs to take a decision immediately because if he hesitates, he will be late for sure. Also sometimes this script produces signal even before a full pivot-point is formed, as pin-bar analysis is also included here.
What this script IS NOT:
- a complete trading map. Don't take trade on each green or red triangle. You still need to do your homework on market direction, trend, phase, wave, etc. But at least you have the "trigger" part done.
- these pivot points are still not "guaranteed". You never know the future even as close as the very next candle, so the market can continue its trend right after it produces reversal signal. The aim of this indicator was only to filter out those potential pivot points, which didn't really look like reversals.
If you think this method could be improved somehow or would like to share your thoughts or approach, don't hesitate to reach out to me or write down in comments.
P.S. Credit goes to UCSGEARS for his Top&Bottom candle script. Amazing work. I used the momentum calculation from there.
Pivot Points [SMRT Algo]Pivot Points is a free, innovative indicator designed to automatically detect and highlight key turning points on your TradingView charts through advanced candlestick pattern analysis. This indicator is perfect for traders seeking clear visual signals for potential trend reversals.
How It Works:
Candlestick Pattern Analysis: The indicator continuously scans for specific candlestick formations. It identifies a potential high pivot when a bullish candle (where the close is higher than the open) is immediately followed by a bearish candle (where the close is lower than the open). Conversely, a potential low pivot is detected when a bearish candle is followed by a bullish candle.
Boxing the Price Range: Once a potential pivot is identified, the algorithm draws a box around the corresponding price range. This box captures the area where the price action is concentrated, serving as a zone of interest for the pivot.
Confirmation of Major Pivots: The initial detection marks what we call a "minor pivot" with a temporary yellow box. The indicator then waits for subsequent price action. If the price fails to break out of this box—meaning it remains confined within the defined boundaries—the pivot is confirmed as a major pivot. At this stage, the yellow box changes color to green (or red, depending on whether it’s a high or low pivot), clearly marking the confirmed turning point.
Pivot Sequence: The progression follows a clear sequence: Minor Pivot ➔ Yellow Box ➔ Major Pivot. This step-by-step visual guide helps traders quickly interpret the strength and significance of the pivot.
Inputs:
Show Labels: An input option allows you to toggle pivot labels on or off, so you can choose whether to display descriptive labels directly on your chart.
Adjustable Colors: The colors of the pivot points—including the green and red boxes—are fully customizable via the input settings. This ensures that you can tailor the visual appearance of the indicator to match your personal charting style or trading strategy.
Enhancing Entry and Exit Strategies
Entry Points: Look to enter a trade when the indicator confirms a pivot (after the box changes color). A confirmed pivot could indicate that a reversal is underway, giving you a potential entry signal.
Exit Points & Stop Losses: Use the boundaries of the pivot box to set stop losses. For example, if you’re in a long trade and the price approaches a confirmed resistance pivot, consider this a signal to tighten stops or exit, as the trend may reverse.
Confluence with Other Indicators: Combine the pivot point signals with other tools like RSI, MACD, or volume indicators. If multiple signals point to a reversal at the same pivot, it strengthens your confidence in the trade decision.
Trading Strategy Applications
Reversal Trading: Use confirmed pivot points as indicators for potential reversals. Enter trades when the price action validates the pivot point, anticipating that the market is turning.
Range Trading: When the price oscillates within a defined pivot box, you can use the top and bottom of the box as potential boundaries for a range-trading strategy.
Breakout Trading: Conversely, if the price breaks out of a pivot box, this may signal the start of a new trend. You can use this breakout as a trigger for entering a position in the direction of the breakout.
The indicator highlights potential reversal zones with clearly marked boxes and labels, making it easier to spot key turning points and manage trades effectively.
Pivot Points removes the guesswork by automatically scanning for and confirming pivot points based on rigorous candlestick analysis.
Whether you're a day trader or a swing trader, Pivot Points provides actionable insights into market dynamics, helping you to better time entries and exits.

Pivot Support and Resistance Finder [JV] V2Dear Traders,
This script is a follow-up to my previous Pivot Support and Resistance Finder.
After so many positive feedback, for which I thank you all, I started rebuilding it to implement some requested features.
The biggest change is that by default, the indicator now shows zones instead of lines.
Support Zone: from low to close
Resistance Zone: from close to high
I removed the 5 lines, instead showing the most recent levels and the forming (fast) levels.
However, if you change the occurrence in the options, you can still see previous levels:
0 = Current Level
1 = Previous Level
2 = Level before the Previous Level
...
More important configurable options:
Pivot Length
Pivot Quick Length (used to draw forming levels
Option to draw using bar closes, wicks or both (area)
Hide / Display to forming level
Show past levels.
I hope this is clear enough.
For any questions, remarks, suggestions, feel free to contact me.
Happy Trading!

Pivot Support and Resistance Finder [JV] V1Hi Traders.
This is my first attempt of writing an indicator.
Let me start by saying I could never have done this without lmatl and WMX_Q_System_Trading who were and are an incredible source of inspiration.
This indicator shows horizontal Pivot Support and Resistance . It draws up to 4 horizontal lines extending to the right from and adds labels to High and Low Pivot Candles . It also draws the Support / Resistance that is currently forming.
You can select the number of lines on the current timeframe.
There are some options in Settings:
Current timeframe pivot settings
Show and hide levels of the current timeframe
Change colors
Extend Lines
Any suggestions are more than welcome!
I also welcome donations, no matter how small ;-)
Pivot Points Standard w/ Future PivotsPivot Points Standard with Future Projections
This indicator displays traditional pivot point levels with an added feature to project future pivot levels based on the current period's price action.
Key Features:
Multiple Pivot Types: Choose from Traditional, Fibonacci, Woodie, Classic, DM, and Camarilla pivot calculations
Flexible Timeframes: Auto-detect or manually select Daily, Weekly, Monthly, Quarterly, Yearly, and multi-year periods
Future Pivot Projections: Visualize potential pivot levels for the next period based on current price movement
Custom Price Scenarios: Test "what-if" scenarios by entering a custom close price to see resulting pivot levels
Customizable Display: Adjust line styles, colors, opacity, and label positioning for both historical and future pivots
Historical Pivots: View up to 200 previous pivot periods for context
Future Pivot Options:
The unique future pivot feature calculates what the next period's support and resistance levels would be using the current period's High, Low, Open, and either the current price or a custom price you specify for the closing value. Future pivots are displayed with customizable line styles (solid, dashed, dotted) and opacity to distinguish them from historical levels.
Use Cases:
Plan entries and exits based on projected support/resistance
Scenario analysis with custom price targets
Identify key levels before the period closes
Multi-timeframe pivot analysis
Works on all timeframes and instruments.

Pivot Points. High & Lows By Reversal PercentageLibrary "Pivot Points. High & Lows By Reversal Percentage" by Jal9000
This Pine Script library provides a robust function for identifying and tracking pivot points (reversal points) in price data, suitable for integration into custom trading indicators and strategies.
🛠️ Main Features:
- ✅ Identifies pivot highs and lows based on configurable price movement thresholds.
- ✅ Lightweight. No candle backtracing used. Much less computation heavy.
- ✅ Supports multiple calls (with different values) within a single script.
- ✅ Compatible with request.security for multi-timeframe analysis.
- ✅ Returns both confirmed and temporary pivots for flexible integration.
- ✅ Pinescript V5 and V6 compliant code.
Purpose:
The pivots library enables Pine Script developers to easily add pivot point detection to their scripts. It identifies significant price reversals by evaluating price movements against a minimum range threshold ( min_range_pct ) and confirming reversals based on a percentage ( reversal_pct ) of the prior trend’s magnitude. The library supports multiple simultaneous calls with different settings, making it ideal for multi-timeframe strategies.
How It Works:
The library’s f_calculatePivot function tracks price movements to detect pivot points:
Minimum Range Threshold : A potential pivot is considered if the price moves beyond the min_range_pct percentage of the current high (for a high pivot) or low (for a low pivot), ensuring sufficient movement.
Reversal Confirmation : A pivot is confirmed if the price reverses from the potential pivot by at least the reversal_pct percentage of the distance between the last confirmed pivot and the current potential pivot, measuring the retracement relative to the prior trend’s magnitude.
The function alternates between tracking highs (in an uptrend) and lows (in a downtrend), updating the trend when a pivot is confirmed.
State management uses an array of pivot_state objects, allowing independent calculations for different timeframes and min_range_pct values within the same script.
## Technical Reference
Functions:
f_calculatePivot(series float _high, series float _low, float _min_range_pct, float _reversal_pct) →
- Parameters:
_high : The high price series (e.g., high or math.max(open, close) ).
_low : The low price series (e.g., low or math.min(open, close) ).
_min_range_pct : The minimum percentage price movement to consider a potential pivot.
_reversal_pct : The percentage of the prior trend’s distance required to confirm a pivot.
- Returns:
A tuple containing:
isNewPivot : Boolean indicating if a new pivot was confirmed.
last_confirmed_pivot : The most recent confirmed pivot (type pivot ).
temp_pivot : The current temporary pivot (type pivot ).
Pivot type:
idx (series int) : Bar index of the pivot.
typ (series int) : Type of pivot ( PIVOT_HIGH or PIVOT_LOW ).
prc (series float) : Price of the pivot.
tme (series int) : Timestamp of the pivot.
Constants (internal):
TREND_LONG , TREND_SHORT : Trend direction indicators (1, -1).
PIVOT_HIGH , PIVOT_LOW : Pivot type indicators (1, -1).
✨ Example of Use:
//@version=5
indicator("Pivot Example", overlay=true)
import jal9000/pivots/1 as pivots
// Inputs
min_range_pct = input.float(20.0, 'Min Range %')
reversal_pct = input.float(30.0, 'Reversal %')
ignore_wick = input.bool(true, 'Ignore wick')
h = ignore_wick ? math.max(open, close) : high
l = ignore_wick ? math.min(open, close) : low
// Call the function with high, low, and input parameters
= pivots.f_calculatePivot(h, l, min_range_pct, reversal_pct)
// Variable to store previous confirmed pivot outside the function
var pivots.pivot prev_confirmed_pivot = na
// Draw the line if a new pivot is confirmed and previous pivot exists
if is_new_pivot
if not na(prev_confirmed_pivot) and not na(new_confirmed_pivot)
line.new(x1 = prev_confirmed_pivot.idx, y1 = prev_confirmed_pivot.prc, x2 = new_confirmed_pivot.idx, y2 = new_confirmed_pivot.prc, color = color.blue, width = 1)
prev_confirmed_pivot := new_confirmed_pivot
## Release Notes
v1
- Initial release of the pivots library with f_calculatePivot function for detecting pivot points and supporting multiple configurations and timeframes.
v2
- Code is Pinescript V6 ready. Remains identified as V5, but changing the version number is the only thing that is required to be v6.
Pivot LevelsThis indicator automatically plots 3 important "Pivot Levels" to watch when day trading.
This simple but effective tool plots out important levels from the prior trading day, and updates every day. I noticed that significant levels such as the close, the high, and the low from the prior day often serve as important support/resistance levels in the future.
The previous day high is displayed as the green line, the close is displayed as the white line, and the low is plotted as the red line.
Enjoy!

Pivot High/Low ComparisonThis script will show you at a glance the following trends:
Higher Highs (Green line on top)
Lower Highs (Red line on top)
Higher Lows (Green line on bottom)
Lower Lows (Red line on bottom)
It utilizes the Pivot High and Pivot Low functions to determine if the previous pivot was higher or lower than the current pivot .
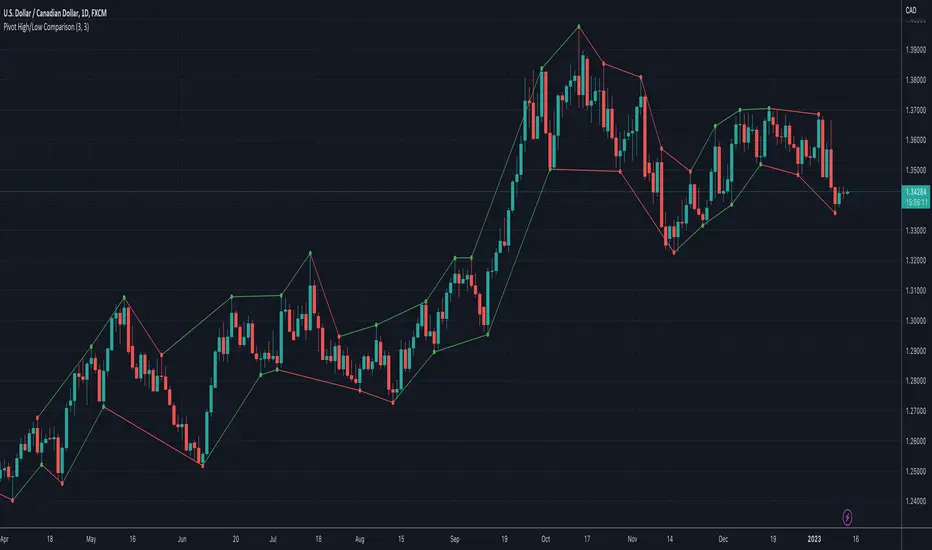
Pivot Regime Anchored VWAP [CHE] Pivot Regime Anchored VWAP — Detects body-based pivot regimes to classify swing highs and lows, anchoring volume-weighted average price lines directly at higher highs and lower lows for adaptive reference levels.
Summary
This indicator identifies shifts between top and bottom regimes through breakouts in candle body highs and lows, labeling swing points as higher highs, lower highs, lower lows, or higher lows. It then draws anchored volume-weighted average price lines starting from the most recent higher high and lower low, providing dynamic support and resistance that evolve with volume flow. These anchored lines differ from standard volume-weighted averages by resetting only at confirmed swing extremes, reducing noise in ranging markets while highlighting momentum shifts in trends.
Motivation: Why this design?
Traders often struggle with static reference lines that fail to adapt to changing market structures, leading to false breaks in volatile conditions or missed continuations in trends. By anchoring volume-weighted average price calculations to body pivot regimes—specifically at higher highs for resistance and lower lows for support—this design creates reference levels tied directly to price structure extremes. This approach addresses the problem of generic moving averages lagging behind swing confirmations, offering a more context-aware tool for intraday or swing trading.
What’s different vs. standard approaches?
- Baseline reference: Traditional volume-weighted average price indicators compute a running total from session start or fixed periods, often ignoring price structure.
- Architecture differences:
- Regime detection via body breakout logic switches between high and low focus dynamically.
- Anchoring limited to confirmed higher highs and lower lows, with historical recalculation for accurate line drawing.
- Polyline rendering rebuilds only on the last bar to manage performance.
- Practical effect: Charts show fewer, more meaningful lines that start at swing points, making it easier to spot confluences with structure breaks rather than cluttered overlays from continuous calculations.
How it works (technical)
The indicator first calculates the maximum and minimum of each candle's open and close to define body highs and lows. It then scans a lookback window for the highest body high and lowest body low. A top regime triggers when the body high from the lookback period exceeds the window's highest, and a bottom regime when the body low falls below the window's lowest. These regime shifts confirm pivots only when crossing from one state to the other.
For top pivots, it compares the new body high against the previous swing high: if greater, it marks a higher high and anchors a new line; otherwise, a lower high. The same logic applies inversely for bottom pivots. Anchored lines use cumulative price-volume products and volumes from the anchor bar onward, subtracting prior cumulatives to isolate the segment. On pivot confirmation, it loops backward from the current bar to the anchor, computing and storing points for the line. New points append as bars advance, ensuring the line reflects ongoing volume weighting.
Initialization uses persistent variables to track the last swing values and anchor bars, starting with neutral states. Data flows from regime detection to pivot classification, then to anchoring and point accumulation, with lines rendered globally on the final bar.
Parameter Guide
Pivot Length — Controls the lookback window for detecting body breakouts, influencing pivot frequency and sensitivity to recent action. Shorter values catch more pivots in choppy conditions; longer smooths for major swings. Default: 30 (bars). Trade-offs/Tips: Min 1; for intraday, try 10–20 to reduce lag but watch for noise; on daily, 50+ for stability.
Show Pivot Labels — Toggles display of text markers at swing points, aiding quick identification of higher highs, lower highs, lower lows, or higher lows. Default: true. Trade-offs/Tips: Disable in multi-indicator setups to declutter; useful for backtesting structure.
HH Color — Sets the line and label color for higher high anchored lines, distinguishing resistance levels. Default: Red (solid). Trade-offs/Tips: Choose contrasting hues for dark/light themes; pair with opacity for fills if added later.
LL Color — Sets the line and label color for lower low anchored lines, distinguishing support levels. Default: Lime (solid). Trade-offs/Tips: As above; green shades work well for bullish contexts without overpowering candles.
Reading & Interpretation
Higher high labels and red lines indicate potential resistance zones where volume weighting begins at a new swing top, suggesting sellers may defend prior highs. Lower low labels and lime lines mark support from a fresh swing bottom, with the line's slope reflecting buyer commitment via volume. Lower highs or higher lows appear as labels without new anchors, signaling possible range-bound action. Line proximity to price shows overextension; crosses may hint at regime shifts, but confirm with volume spikes.
Practical Workflows & Combinations
- Trend following: Enter longs above a rising lower low anchored line after higher low confirmation; filter with rising higher highs for uptrends. Use line breaks as trailing stops.
- Exits/Stops: In downtrends, exit shorts below a higher high line; set aggressive stops above it for scalps, conservative below for swings. Pair with momentum oscillators for divergence.
- Multi-asset/Multi-TF: Defaults suit forex/stocks on 1H–4H; on crypto 15M, shorten length to 15. Scale colors for dark themes; combine with higher timeframe anchors for confluence.
Behavior, Constraints & Performance
Closed-bar logic ensures pivots confirm after the lookback period, with no repainting on historical bars—live bars may adjust until regime shift. No higher timeframe calls, so minimal repaint risk beyond standard delays. Resources include a 2000-bar history limit, label/polyline caps at 200/50, and loops for historical point filling (up to current bar count from anchor, typically under 500 iterations). Known limits: In extreme gaps or low-volume periods, anchors may skew; lines absent until first pivots.
Sensible Defaults & Quick Tuning
Start with the 30-bar length for balanced pivot detection across most assets. For too-frequent pivots in ranges, increase to 50 for fewer signals. If lines lag in trends, reduce to 20 and enable labels for visual cues. In low-volatility assets, widen color contrasts; test on 100-bar history to verify stability.
What this indicator is—and isn’t
This is a structure-aware visualization layer for anchoring volume-weighted references at swing extremes, enhancing manual analysis of regimes and levels. It is not a standalone signal generator or predictive model—always integrate with broader context like order flow or news. Use alongside risk management and position sizing, not as isolated buy/sell triggers.
Many thanks to LuxAlgo for the original script "McDonald's Pattern ". The implementation for body pivots instead of wicks uses a = max(open, close), b = min(open, close) and then highest(a, length) / lowest(b, length). This filters noise from the wicks and detects breakouts over/under bodies. Unusual and targeted, super innovative.
Disclaimer
The content provided, including all code and materials, is strictly for educational and informational purposes only. It is not intended as, and should not be interpreted as, financial advice, a recommendation to buy or sell any financial instrument, or an offer of any financial product or service. All strategies, tools, and examples discussed are provided for illustrative purposes to demonstrate coding techniques and the functionality of Pine Script within a trading context.
Any results from strategies or tools provided are hypothetical, and past performance is not indicative of future results. Trading and investing involve high risk, including the potential loss of principal, and may not be suitable for all individuals. Before making any trading decisions, please consult with a qualified financial professional to understand the risks involved.
By using this script, you acknowledge and agree that any trading decisions are made solely at your discretion and risk.
Do not use this indicator on Heikin-Ashi, Renko, Kagi, Point-and-Figure, or Range charts, as these chart types can produce unrealistic results for signal markers and alerts.
Best regards and happy trading
Chervolino

Pivot and Wick Boxes with Break Signals█ OVERVIEW
This Pine Script® indicator draws support and resistance levels based on high and low pivot points and the wicks of pivot candles. When the price breaks these levels, breakout signals are generated, with an optional volume filter for greater precision. The indicator is fully customizable, allowing users to adjust box styles, pivot length, and signal settings.
█ CONCEPTS
The indicator relies on several key elements to identify and visualize important price levels and trading signals:
Pivot Identification
High and low pivots are detected using the ta.pivothigh and ta.pivotlow functions with a configurable pivot length. Boxes are drawn based on the pivot level and the wick of the pivot candle (top for high pivots, bottom for low pivots).
List of Features
1 — High and Low Pivot Boxes: The indicator draws boxes based on high pivot candles (red) and low pivot candles (green) and their wicks, with options to customize colors, border styles, and background gradient. Boxes are limited to 500 bars back, meaning support and resistance levels older than 500 candles are not displayed to maintain chart clarity.
2 — Breakout Signals: When the price closes above the upper edge of a high pivot box, a breakout signal is generated (green triangle below the bar). When the price closes below the lower edge of a low pivot box, a breakout signal is generated (red triangle above the bar).
Signals can be filtered using volume, requiring the volume at the breakout to exceed the average volume multiplied by a configurable multiplier.
3 — Box Management: The indicator limits the number of displayed boxes (default is 15 for high pivots and 15 for low pivots), removing the oldest boxes when the limit is reached. Boxes older than 500 bars are automatically removed.
Volume Filtering
An optional volume filter allows users to require breakout signals to be confirmed by volume exceeding the moving average of volume (calculated over a selected period, default is 20 days).
█ OTHER SECTIONS
FEATURES
• Show High/Low Pivot Boxes: Enables or disables the display of boxes for high and low pivots.
• Pivot Length: Specifies the number of bars back and forward for detecting pivots (default is 5).
• Max Boxes: Sets the maximum number of boxes for high and low pivots (default is 15).
• Volume Filter: Enables a volume filter for breakout signals, with a configurable multiplier and average period.
• Box Style: Allows customization of border color, background gradient, border width, and border style (solid, dashed, dotted).
HOW TO USE
1 — Add the indicator to your TradingView chart by selecting “Pivot and Wick Boxes with Break Signals” from the indicators list.
2 — Configure the settings in the indicator’s dialog window, adjusting pivot length, maximum number of boxes, colors, and style.
3 — Enable the volume filter if you want signals to be confirmed by high volume.
4 — Monitor breakout signals (green triangles below bars for upward breakouts, red triangles above bars for downward breakouts) on the chart.
LIMITATIONS
• New pivots are detected with a delay equal to the set pivot length. A lower pivot length value results in faster pivot detection but produces pivots with less significance as support or resistance levels compared to those generated with a longer value.
• Breakout signals may produce false signals in volatile market conditions, especially without the volume filter.
• Boxes are limited to 500 bars back, which may exclude older pivots on long-term charts.
