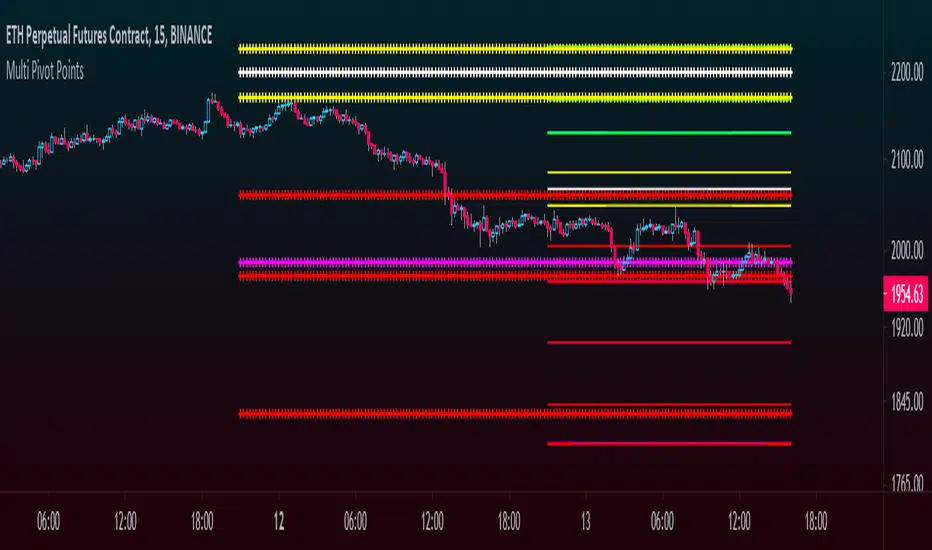
Multi Pivot Points - All in One IndicatorThis multi pivot indicator allows you to plot and overlay different types of pivot points:
-Fibonacci
-Floor Traders
-Camarilla
In addition to this, you can plot pivots from two different timeframes of your choice, for example the daily & weekly pivots, monthly & yearly, etc.
-You can select the linestyle, width and color of each pivot type for easy recognition of levels.
-You can choose to show only the current set of pivots or you can show the historical levels too.
This indicator allows traders to search for high probability targets or support and resistance zones via the confluence of both different pivot types and timeframes. These levels can work for either day traders or longer terms traders.
In the case of Fibonacci levels these can be chosen in the menu.
Enjoy!!
"pivot" için komut dosyalarını ara
Floor Pivots With CPR and Camarilla 3 LevelsThis script plots floor pivots with the central pivot range and camarilla R3/S3 pivots, to spot with ease the Golden Pivot Zone (GPZ). As described in the book *Secret of a pivot Boss* by Franklin Ochoa, the Golden Pivot Zone occurs when R3 or S3 pivot from the Camarilla Equation or from lies within the central pivot range. This combination can be simply profitable.
A bearish GPZ occurs when R3 of the Camarilla Equation is mixed within the central pivot range, therefore we should look for sells in that zone.
A bullish GPZ occurs when S3 of the Camarilla Equation is mixed within the central pivot range, therefore we should look for buys in that zone.
Here are some examples on Gold
Good luck !
Ps* i got part of the code from @cristian.d script

Heiken Ashi Pivot Breakout Trailing StopThis is a heiken ashi pivot based trailing stop for breakout entries and exits. It's possibly related to the Swing Index System by Welles Wilder or an alternative to it that I came up with, in case determining the swings on the Accumulative Swing Index is too much of a burden. It is believed that the ASI uses the calculation of heiken ashi in its formula. This does not use the ASI as a bottom indicator in the chart but instead uses the heiken ashi bars on the top of the chart to objectively find the swing pivots . These swings pivots act as support and resistance and can be used to confirm the start of a breakout or the end of one.
Suppose you find a chart pattern or setup, such as divergence or a pennant in the RSI , a pattern on the ASI, and/or on the chart, or the end of an elliot wave , etc and want to confirm a strong breakout and ride it to the end. Many trailing stops won't be able to confirm the beginning or would last too long or not long enough to exit out of one. On an uptrend, when the price breaks below the last swing low pivot , it can confirm the end of the breakout. On a downtrend, when the price breaks above the last swing high pivot , it can confirm the end of the breakout.
This trailing stop is not meant to replace trend following ones. The swing pivots can vary yet the price can still continue at an uptrend whereas this heiken ashi pivot based trailing stop exits as soon as it goes above or below the last resistance point. These swing points can end up being too close for trend following but can work well for breakout trading. The bigger the chart pattern or breakout, the more reliable the exit signal will be in my opinion. This is an experimental idea that I came up with from trying to interpret the ASI.
RVC-Trade-With-Pivot-LevelsHow to Use PIVOT Levels for Trading
Always remember ->: *Trade with trend*
About script:
1. Daily and Weekly close above Pivot Level.
-- Sentiment is highly positive. Pivot Level acts as strong support.
2. Daily Close above Pivot and Weekly Close Below Pivot
-- Sentiment is positive.Weekly Pivot Level may act as strong resistance.
3. Daily close below Pivot and weekly close above Pivot
-- Sentiment is negative but weekly Pivot Level can acts as strong support.
4. Daily and Weekly Close below Pivot Level
-- Sentiment is highly Negative. Pivot Level acts as strong resistance.
BUY/SELL -- ENTRY
BUY ABOVE 23.6% UPWARD
IF Trend is positive and price cross and sustains above 23.6%(R1) upside, then it will be entry from BUY perspective.
If R1 is entry, R2/R3/R4/R5 ... will be targets.
SELL Below 23.6% Downward
IF Trend is negative and price cross and sustains below 23.6%(S1) downside, then it will be entry from SELL perspective.
If S1 is Sell side entry, S2/S3/S4/S5 will be targets.
Before taking ENTRY on BUY or SELL Side, please know your risk levels, Stop Loss and trade EXECUTION process.
Finally:
My view is my view and remains with me only. Once you accept it and trade it, it becomes your view. So credit or blame all yours.:)

Pivot TrendHello Traders,
Another original idea is here with you. Actualy I can say that it's a breakout strategy that uses multiple Pivot Point's averages.
How it works?
- it finds the Pivot Points, you can set the length as you want
- it gets averages of Pivot Highs and Pivot Lows, you can set the number of Pivot Points to be included
- it compares the current closing price with averages of Pivot Highs and Pivot Lows
- if both are positive or negative then trend changes
You have two options:
- Pivot Point Period => is the length that is used to find Pivot Points. means it checks left/right bars if it's Pivot Point (4 by default)
- Number of PP to check => is the number of Pivot Points that the script finds and calculates the averages (3 by default)
An Example with the settings Pivot Point Period = 5 and Number of PP to check = 2
Play with settings as you wish. Comments are welcome, together we can improve it ;)
Enjoy!
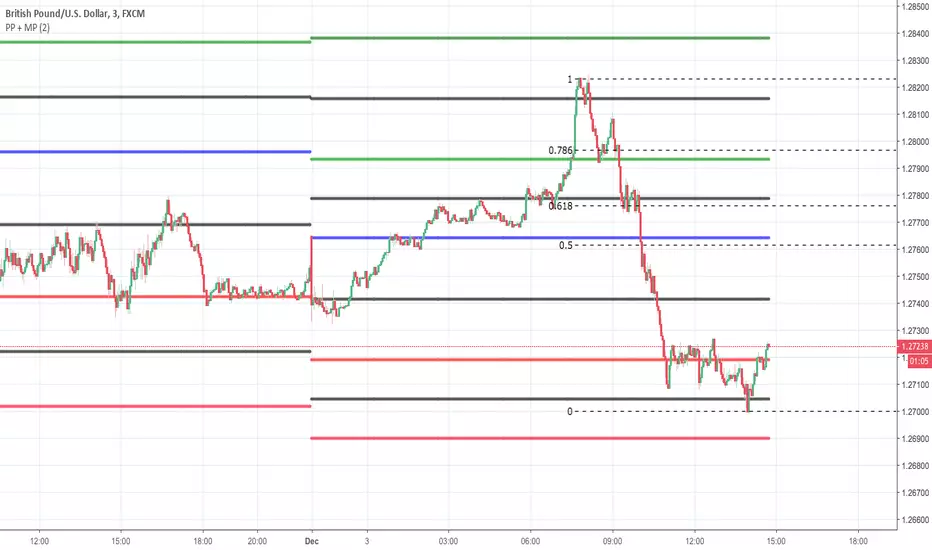
Pivot Point + MidPointsTraditional floor pivots with additional lines in between the s/r levels called Mid Points
If the Pivot Points are used as entering at s/r levels, you can use the Mid Points to scale out of a position or place Sl's behind
Pivot Triangles High/Low (anchored)“It is used to detect price action pivots. You can choose the number of candles before a pivot is marked. It is useful for identifying trends.”

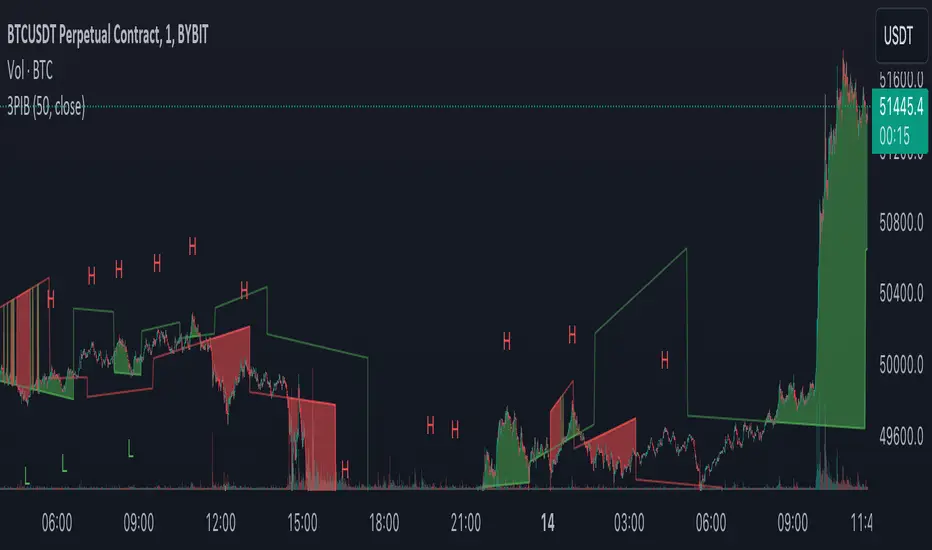
Pivot Highs/Lows with Bar CountsWhat does the indicator do?
This indicator adds labels to a chart at swing (a.k.a., "pivot") highs and lows. Each label may contain a date, the closing price at the swing, the number of bars since the last swing in the same direction, and the number of bars from the last swing in the opposite direction. A table is also added to the chart that shows the average, min, and max number of bars between swings.
OK, but how do I use it?
Many markets -- especially sideways-moving ones -- commonly cycle between swing highs and lows at regular time intervals. By measuring the number of bars between highs and lows -- both same-sided swings (i.e., H-H and L-L) and opposite-sided swings (i.e., H-L and L-H) -- you can then project the averages of those bar counts from the last high or low swing to make predictions about where the next swing high or low should occur. Note that this indicator does not make the projection for you. You have to determine which swing you want to project from and then use the bar counts from the indicator to draw a line, place a label, etc.
Example: Chart of BTC/USD
The indicator shows pivot highs and lows with bar counts, and it displays a table of stats on those pivots.
If you focus on the center section of the chart, you can see that prices were moving in a sideways channel with very regular highs and lows. This indicator counts the bars between these pivots, and you could have used those counts to predict when the next high or low may have occurred.
The bar counts do not work as well on the more recent section of the chart because there are no regularly time swings.

3 Pivots Interpolation BreakoutsI designed the '3 Pivots Interpolation Breakouts' indicator to intuitively identify breakout opportunities using pivot points. This tool stems from my need to anticipate market direction and capitalize on breakouts. It uses a line interpolated from three pivot highs or lows to forecast upcoming breakouts. This offers a straightforward way to visualize potential bullish and bearish breakouts with color-coded extrapolations. The aim is to simplify breakout detection, enhancing your trading strategy with precise, actionable insights.
Simple Pivot Points with dots, not lines(manual setup)1. Why Pivot Point is popular?
Because unlike most indicators, it's not lagging! It is forward-looking, it's real-time, it's just right there.
2. Why this script is created?
I don't like many indicator lines crossing my screen everywhere, just as some Pivot Point indicators did. So I wrote this script to keep my screen as clean/neat as possible.
3. MUST READ before you add this “manual setup” version to your chart
I'm a E-mini S&P500 future trader, and I found the close prices on Daily chart is different from the ones on lower timeframe occasionally.
So I asked some TradingView staff and the reply was:
The closing price of a daily bar on TradingView is based on a Settle price from the exchange. The exchanges, at times, send this value before the close of the trading day, which leads to the situation when the price for daily-based resolutions does not change after receiving this Settle value, while the price changes still occur at smaller resolutions, since the construction of intraday bars is based on the actual trades produced.
So, in order to use the most accurate price,
I replace the D(representing the Daily timeframe) with 1440(representing 1440 minutes) in the script, making the daily Pivot Points more accurate.
The default Pivot Points are from daly timeframe.
You have to set the "last week/month close" in the "script settings" MANUALLY to ensure the weekly/monthly Pivot Point is the most accurate.
4. What if you don't want to go through the hassle of setting it up manually?
If the tickers you trade doesn't have the occasional problems as mentioned before, you can search the "Simple Pivot Points with dots, not lines(automatic setup)" version which uses the default close prices on each timeframe.
--------
If you want the dots stay a little further from your bars, you can adjust the "offset" parameter in the code. The larger the number is, the further the dot stays.
Daily Pivot (Traditional)Hello all
-
This code is for daily pivot points, support and resistance with pivot labels and value.
simple code with no bugs.
this code use previous day values on online chat and current day values on offline chat.
pivot values are placed on right side, so no overlapping with other values.
.
.
Thank you Trading View for other educational script to make this possible.


Standard Deviation W/Q/M PivotsThis is a re-iteration of the standard deviation of daily pivots with the pivots applied on weekly, monthly, quarterly and yearly levels. For intraday traders the weekly pivot points will act as a major support resistance levels. Quarterly and monthly pivot points are useful for short-term positions while the yearly pivot determines the stock's long term support-resistance levels and useful in determining if the stock is in a bullish/bearish leg.
Alto Basso Swing Pivots + Barry Support Resistance Levels2 indicators, 1 script: swing pivots and Barry support resistance levels
Alto
high swing pivot
Basso
low swing pivot
Dal Segno
lookback period length for swing pivots
Barry Length
length for support resistance calculation
--------------------------------------------------------------------------------------------------------------------------------------------------------------------------------------------
Use swing pivots for confirmation of new structure levels on short term
Barry support resistance levels in proximity to standard pivots or Fibonacci levels may indicate greater strength
credit to BacktestRookies and likebike
stay ♯
Example: Dal Segno 13, Barry Length 21

Rounded Weekly Pivot (by ChartArt)Trade with the trend. This is an overlay indicator which shows the weekly pivot (rounded) either as line or circle drawing, select-able by the user. The width of the pivot line (or circle) overlay is also adjustable.
In addition the bars can be colored by the trend, depending if the close price is above or below both the weekly and monthly pivots. If the close price is neither above or below both the weekly and monthly pivot prices the trend color is neutral blue.
The weekly pivot indicator with the optional setting that the pivot price is drawn as circles instead of a line:
And here with the pivot drawing disabled, showing only the pivot bar trend color

Structure Pivot (LL-HL / HH-LH)Structure Pivot (LL-HL / HH-LH) - Indicator Guide
This indicator scans for market structure pivot patterns—specifically the bullish Higher Low (LL–HL) and the bearish Lower High (HH–LH) —across multiple lengths simultaneously.
It automatically selects the most optimal pattern based on a "Priority Mode" and plots the structure and breakout/breakdown levels on the chart.
1. Basic Calculation Method
The indicator builds upon TradingView’s ta.pivotlow and ta.pivothigh functions to identify structural points.
Bullish Structure (LL–HL)
1.LL (Lowest Low): A standard Pivot Low is identified.
2.HL (Higher Low): A subsequent Pivot Low forms higher than the previous LL. This completes the setup.
3.Pivot Line (Resistance): The indicator finds the highest price (High) that occurred between the LL and the HL. This level becomes the breakout trigger.
Bearish Structure (HH–LH)
1.HH (Highest High): A standard Pivot High is identified.
2.LH (Lower High): A subsequent Pivot High forms lower than the previous HH. This completes the setup.
3.Pivot Line (Support): The indicator finds the lowest price (Low) that occurred between the HH and the LH. This level becomes the breakdown trigger.
2. Multi-Length Scanning
Unlike standard indicators that use a single fixed length (e.g., Length = 5), this indicator scans a range of lengths simultaneously.
・Settings: Defined by Min Length and Max Length.
・Mechanism: If set to Min=2 and Max=10, the indicator internally runs 9 separate calculations (Length 2 through 10) in parallel.
This allows it to capture everything from small, short-term pullbacks to larger, significant structural pivots without manual adjustment.
3. Priority Mode System
Since multiple lengths are scanned, multiple valid patterns may appear at the same time. The Priority Mode determines which single pattern is the "winner" and gets displayed.
A. Tightest Structure (Default)
・For Bullish (Long): Selects the pattern with the lowest Pivot Line (Resistance).
・For Bearish (Short): Selects the pattern with the highest Pivot Line (Support).
・Advantage: It finds the "tightest" contraction (like a VCP). This offers the entry point closest to the stop-loss level, providing the best Risk/Reward ratio.
B. Longest Length
・Selects the pattern detected by the longest length setting.
・Advantage: Focuses on major structural points, filtering out short-term noise. Best for trend confirmation.
C. Shortest Length
・Selects the pattern detected by the shortest length setting.
・Advantage: Extremely sensitive. Best for scalping or catching immediate micro-pullbacks.
4. Real-Time Logic & Features
Structure Invalidation (Failure)
・Bullish: If the current price drops below the HL (the support of the structure), the setup is considered failed.
・Bearish: If the current price rises above the LH (the resistance of the structure), the setup is considered failed.
・Result: All lines and labels for that structure are immediately deleted to keep the chart clean.
Pivot Line Extension
・As long as the structure remains valid (price hasn't violated the HL or LH), the Pivot Line extends to the right, acting as a live reference for breakouts or breakdowns.
Alerts
・Bullish Breakout: Triggered when the Close price crosses over the Pivot Line.
・Bearish Breakdown: Triggered when the Close price crosses under the Pivot Line.

VWAP From Pivots Lows and Highs
This script starts automatically VWAP from pivot lows and highs.
Parameter allows you to enable up to 3 VWAP (default).
If you use 3, the VWAP from the last three pivots point will be drawn.
If you use 1, just the last pivot point will be used.
You can also just enable VWAPs starting from pivot lows or highs.
Let me know if there are any problems.

Bardhi's ICT Killzone & PivotsThis indicator is a complete ICT-style session and liquidity toolkit designed for precision trading. It automatically marks the most important trading windows (“Killzones”) and provides powerful tools for tracking price action around them.
Key Features:
Killzones: Automatically plots Asia, London, and New York (AM, Lunch, PM) sessions with customizable colors, transparency, and labels.
Session Highs, Lows & Midpoints: Dynamic lines for killzone highs/lows, optional midpoints, and alerts when levels are broken.
Range Statistics: Displays the real-time range of each session plus rolling averages in a customizable table.
Day / Week / Month Levels: Plots opens, highs, lows, and separators for higher-timeframe reference points with optional alerts.
Custom Opening Prices: Define up to 8 custom open lines (e.g., True Day Open, 06:00, 10:00) with cutoff times.
Vertical Timestamp Lines: Highlight important intraday times such as news events or personal strategy triggers.
Day-of-Week Labels: Clean labels for each day, with the option to hide weekends.
Full Customization: Adjustable label sizes, colors, line styles, transparency, and drawing limits.
Why Use It?
This tool combines killzone sessions, pivots, higher-timeframe opens/highs/lows, and range statistics into one clean, automated package. It saves time drawing manually, keeps charts organized, and helps traders apply ICT concepts consistently.

[DarkTrader] Pivot Point HeatmapThe indicator calculates pivot points using price data from different timeframes such as 12M, 1M, 1W, 3D, and 1D. For each timeframe, it retrieves the high, low, open, and close prices of the previous bar. The pivot point is calculated as the average of the high, low, and close prices, which provides a central level where market sentiment may shift. This calculation is repeated for each timeframe, ensuring a multi-dimensional view of potential interest zones.
Importance of Pivot Points :
Pivot points are essential tools in technical analysis, providing traders with levels that act as potential support and resistance zones. These zones help identify price levels where reversals or breakouts are more likely to occur.
Visual Representation :
The core feature of this indicator is its ability to visualize pivot points as a heatmap on the chart. Instead of showing just the latest pivot points, it tracks the historical pivot swipe, providing a dynamic view of how price interacts with these key levels. Each pivot point is represented by a line, color-coded based on its position relative to other points, creating a gradient effect that highlights the most critical price areas.
Customization Options :
Traders can customize various aspects of the heatmap to suit their preferences. The indicator offers options to toggle pivot swipe history, enabling traders to either focus on the most recent price interactions or consider how price has behaved over time. The background color and pivot line colors are fully customizable, making it easy to match the heatmap with your chart's theme or emphasize certain price levels.
Detecting Sweeps and Price Interaction :
Another important feature is the detection of price interactions with pivot levels. If the current bar's high and low cross a pivot point, it signals that the pivot level has been "swept" by price action, potentially indicating a change in market sentiment. The indicator either extends the line if the pivot point remains relevant or deletes it if price has broken through. This dynamic adjustment helps traders stay updated on which pivot levels are still valid.

Pivot Points with MID LevelsThis indicator shows the Standard Pivot Points level based on daily values that can act as support and resistance. It is used by a variety of traders around the world. You can select which time frame Pivot Point Levels you'd like. Daily, weekly etc... Perfect for swing trading or day trading.
Pivot Points- Shows 3 levels of resistance, the Pivot Point and 3 levels of support
(R3, R2, R1, PIVOT POINT, S1, S2, S3
MID Levels- The MID levels are 50% retracement from the pivot point level above it and below
Example- R3, MID, R2, MID, R1, MID, PIVOT POINT, MID, S1, MID, S2, MID, S3
With this indicator you will also have the option to show the Previous days High and Low that are also important levels. On gap up/down days it is always interesting to see if price will close the gap, hence the important level to note.
PDH= Previous Days High
PDL= Previous Days Low
I have added a feature that you can now select specific color to each level and the line style for each level to help understand which levels are being show by personal needs.
Happy Trading

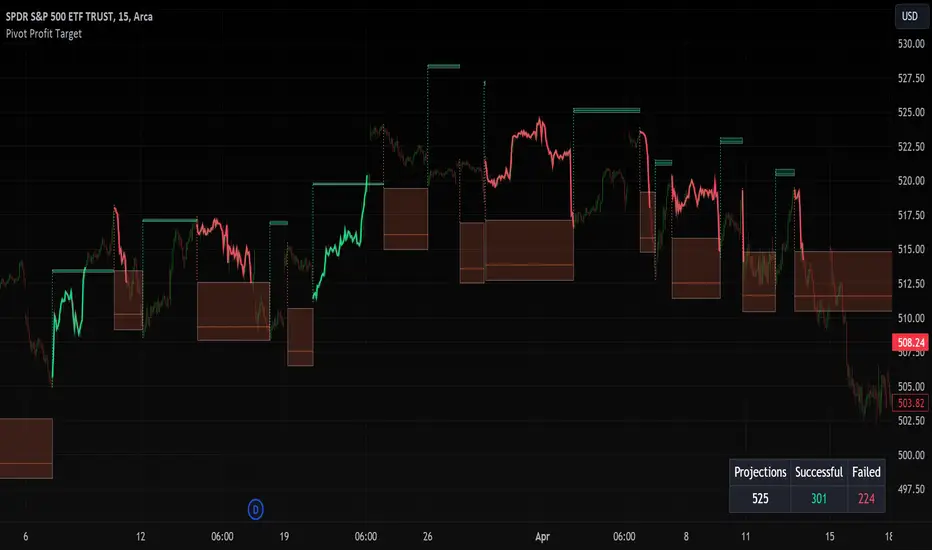
Pivot Profit Target [Mxwll]Introducing the Pivot Profit Target!
This script identifies recent pivot highs/lows and calculates the expected minimum distance for the next pivot, which acts as an approximate profit target.
The image above details the indicator's output.
The image above shows a table consisting of projection statistics.
How to use
The Pivot Profit Targets can be used to approximate a profit target for your trade.
Identify where your entry is relative to the most recent pivot, and assess whether the minimum expected distance for the most recent pivot has been exceeded. Treat the zones as an approximation.
If your trade aligns with the most recent pivot - treat the minimum expected distance zone as a potential profit target area. Of course, price might stop short or continue beyond the projection area!
That's it! Just a short and sweet script; thank you!
Three-Day Rolling PivotThe three-day rolling pivot is another pivot concept,
which may be used by intermediate positions, for several days or even weeks.
It can be utilized in many ways, such as to determine an entry point or trailing stop.
As the name suggests, this pivot is based on the last three days.
I learned this concept of the book "The logical Trader" by Mark Fisher.
Kudos go to him!
My version of the Three-Day Rolling Pivot uses actual data!
And all similar scripts I have found so far calculate future data and don't take into account the original data.
I hope this script will help some people to do some better decisions.
And I am pleased to get some advice to make this script even better!
Future data vs original data
Pine Script v5 Reference Manual:
Merge strategy for the requested data position... This merge strategy can lead to undesirable effect of getting data from "future" on calculation on history. This is unacceptable in backtesting strategies, but can be useful in indicators.
e2e4 on Stack Overflow said:
Pine v1-v2's security() function is using the lookahead parameter by default, which could be modified in v3-v5...
stackoverflow.com
I haven't found a script which put this into account jet.
I leave this option available for people that wanna more speculated data. But it's disabled by default.
Long/Short Example
You can enter Long when the market cross over the upper line (default color is green) and you should put your trailing stop 1-5 ticks below the lower line (default color is red).
The opposite when Shorting, then the market has to cross down the lower line and your trailing stop should be 1-5 ticks above the upper line.
How does this script work:
First it fetches the highest high of ...
yesterday,
the day before yesterday,
and the day before that.
After that the script looks for the highest high of all three.
Next it does the same for previous lowest low.
Last but not least, it fetches the closing price of the last day.
After that it adds all three prices together and divide them by three.
This result in a three day pivot price.
Then it adds the highest high and lowest low of the three last days and divide it by two.
This gives us the second number we need to calculate the differential.
The differential is the gap between the three day pivot price and the second number.
Sometimes the second number is bigger than the three day pivot price so I took that into account too. Other wise the colors plotted would be on the wrong site.
Finally, the script is rounding the numbers to the nearest minimum tick of that security.

[JL] Supertrend Zone Pivot Point with zigzag fibThis is an open-source Pine script that generates a Supertrend Zone Pivot Point with Zigzag Fib indicator for TradingView. The indicator displays the Supertrend Zone, pivot points, and Fibonacci levels on the chart.
One of the unique features of this indicator is that it uses a Zigzag that does not repaint, ensuring accurate high and low points for the pivot points.
Another feature is that when the Supertrend is in an uptrend, only the highest points are taken as pivot points, and when it's in a downtrend, only the lowest points are taken as pivot points.
The Fibonacci levels are calculated based on the previous high and low pivot points, with labels displaying the corresponding levels on the chart.
The indicator also includes options to show/hide the Zigzag and Fibonacci levels.
Overall, this indicator is useful for identifying key pivot points and Fibonacci levels in the Supertrend Zone, providing valuable information for traders to make informed decisions.
