DT Dual-Lookback DLBThis script is based on the concept of Robert Miner Book "High Probabilities Strategies"
This script shows at the same time two timeframes and the overlapping area.
The green and red area shows the higher time frame period just as Robert Miner did this in his videos.
Because Robert Miner just says: 8.. 13.. 21.. i used this also as type for the setup.
This is not a complete trading strategy, but if fibonacci retracement/extensions in price and time and
elliot waves position and DT Dual-Lookback comed together there is a perhaps a signal.
Please read his book and look at his website and his DT reports to learn more about his strategy.
"momentum" için komut dosyalarını ara


Pay Attention CandleThis is an attempt to detect the so called Pay Attention Candles from RexDog Trading System (RDTS). (They are not clearly defined by any specific set in stone rule, so this is just my interpretation)
You can turn on and off the bar highlight/triangles if chart gets too busy and you want only one of the indication types.
The way this is defined as evident in the code is - it looks at the candle size (without the wicks!!! only open to close) to decide whether it is larger than ATR mutlipied by a multiplier (1.5 by default here - you can adjust)
ATR period can also be adjusted but it's set to 9 by default.
Enjoy.

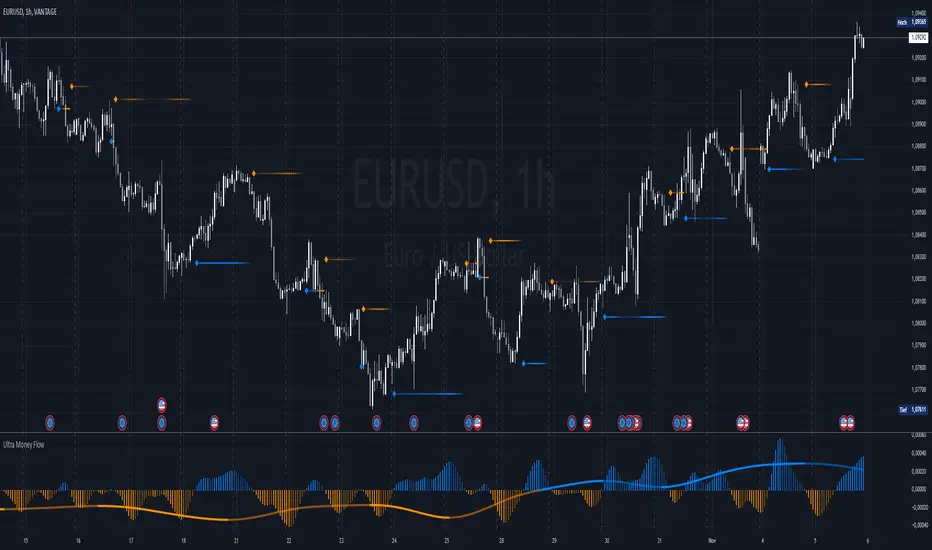
Ultra Money FlowIntroduction
The Ultra Money Flow script is a technical indicator for analyzing stock trends. It highlights buying and selling power, helping you identify bullish (rising) or bearish (falling) market trends.
Detailed Description
The Ultra Money Flow script calculates and visually displays two main components: Fast and Slow money flow. These components represent short-term and long-term trends, respectively.
Here's how it works:
.........
Inputs
You can adjust the speed of analysis (Fast Length and Slow Length) and the type of smoothing applied (e.g., Simple Moving Average, Exponential Moving Average).
Choose colors for visualizing the trends, with blue for bullish (positive) and orange for bearish (negative) movements.
.....
Money Flow Calculation
The script analyzes price changes (delta) over specified periods.
It separates upward price movements (buying power) from downward ones (selling power).
It then calculates the difference between these powers for both Fast and Slow components.
The types of smoothing methods range from traditional ones like the Simple Moving Average (SMA) to advanced ones like the Double Expotential Moving Average (DEMA) or the Triple Exponential Moving Average (TEMA) or the Recursive Moving Average (RMA) or the Weigthend Moving Average (WMA) or the Volume Weigthend Moving Average (VWMA) or Hull Moving Average (HMA).
Very Special ones are the Triple Weigthend Moving Average (TWMA) wich created RedKTrader .
I created the Multi Weigthend Moving Average (MWMA) wich is a simple signal line to the TWMA.
.....
Divergence
This indicator can show divergence by comparing the direction of price movements with the indicator value.
If the price and the indicator move in opposite directions, you can use these signals to help decide when to buy or sell.
.....
Auto Scaling
The script adjusts its calculations based on the time frame you are viewing, whether it's minutes, hours, or days, ensuring accurate representation across different time scales.
.....
Plotting
The script plots the Fast component as a histogram and the Slow component as a line, using the chosen colors to indicate bullish or bearish trends.
The thickness and transparency of these plots give additional clues about the strength of the trend.
.........
By using this indicator, traders can easily spot shifts in buying and selling power, allowing for better-informed decisions in the market.
Special Thanks
I use the TWMA-Function created from RedKTrader to smooth the values.
Special thanks to him for creating and sharing this function!
PPO Divergence AlertsThis is a pretty straightforward script that adds alerts to Pekipek's excellent PPO Divergence indicator and changes the visuals a bit. You can have the alerts fire on these events:
Purple Circle (bullish signal)
Orange Circle (bearish signal)
Green Dot (High Point)
Red Dot (Low Point)
I use this on daily Forex charts to get alerts when purple or orange dots show. As you can see, it catches a lot of big moves, some of which can give insane returns if you're 200x leveraged on the likes of 1Broker.com. In regards to reducing false signals, I'm getting good results with a Williams %R but would love to hear any suggestions.
Edit: Oops. Box #6 in the example should be yellow, not purple.

Koalafied RSI Decision PointsMomentum conditions as detailed in RSI : The Complete Guide by John Hayden
Decision points are conditions based on changes of these rsi values. Pauses in an uptrend, exiting high momentum values, breakouts and failures.
Touch up to an old script and so I thought I'd release. Although most people treat RSI as a reversion tool it is really a momentum indicator. Hopefully this script sparks thoughts about use-cases.
2:1 momentum is associated with RSI values of 66.67 and 33.33 respectfully. In an Uptrend an RSI value of 40 should not be broken and in a downtrend
a RSI value of 60 should not be exceeded. If so, then there is buying/selling pressure in the opposite direction (but not necessarily enough for a trend reversal).
Alternatively it may show the presence of HTF traders.
4:1 momentum (RSI values of 80/20) can be associated with extreme market conditions, typically thought of as being Overbought or Oversold.

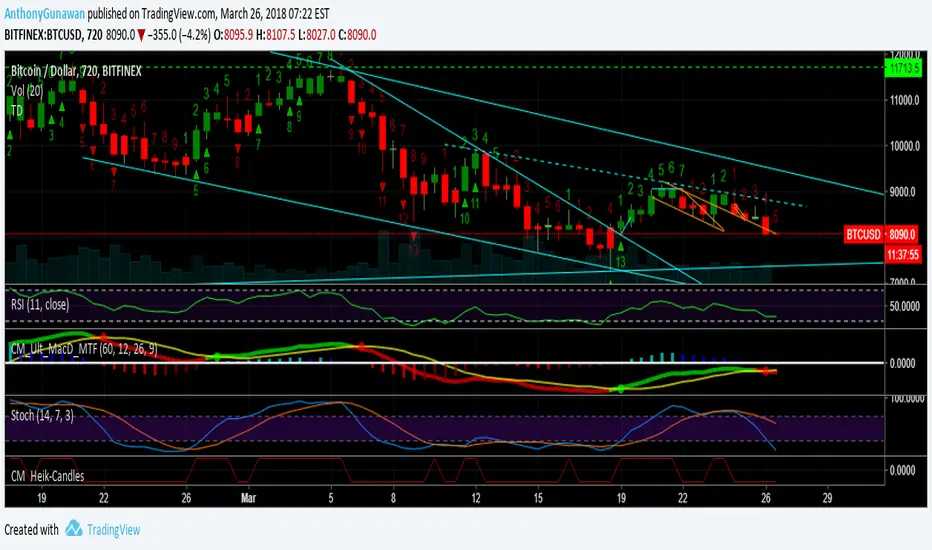
Traders Dynamic Index(RSI) w/ Bull&Bear Control ZonesMomentum (RSI) is one of the most commonly used indicators for trading, but the vast majority of traders who use it, simply apply it as an oscillator to measure overbought and oversold conditions. However, momentum is much more complex than that and using a basic RSI fails to highlight these complexities.
What this highlights are some of the areas/zones that many people may not even know about or are unaware what the RSI can actually reveal about a particular trend.
What this indicator is showing:
Fast moving RSI (Green) - 1 period
Slow moving RSI (Red) - 9 period
Bollinger Bands
Relative Strength: 1 - 100
Bearish Control Zone: 30(Below) - 45
Bullish Control Zone: 60 - 70 (Above)
How this identifies trends:
Bear Market(Bearish Control Zone):
-Support: 20(Below) - 30
-Resistance: 55 - 65
-Momentum will test resistance but will fail to hold support at 50
Bull Market(Bullish Control Zone):
-Support: 45 - 50
-Resistance: 80 - 90(Above)
-Momentum will test support but will not continue past the 45 support
How this identifies reversals:
If a market is bullish, but loses support at 45 and tests 30, it has begun reversal. If a market is bearish, but breaks 60 and tests 70, it has begun reversal.
-A bull market reversal is confirmed if it finds resistance at 60 after testing bearish support
-A bear market reversal is confirmed if it finds support at 50 after testing bullish resistance
Slow & Fast RSI w/ Boll Bands:
-The Slow and Fast RSI crossovers will act as Intermediate trends within the Macro trend - Fast crosses slow, bullish. Slow cross fast, bearish.
-Use in confluence with the Macro trend.
-While under Bearish Control, the Slow RSI will act as resistance for the Fast RSI.
-While under Bullish Control, the Slow RSI will act as support for the Fast RSI.
-The two will have an impulsive crossover when the Macro trend reverses.
-The Bollinger Bands will act as a volatility gauge for potential approaching tests of Support & Resistances. (Expansions & Contractions)
This is an analog of TDIGM (GoldMinds)
-Added Bullish/Bearish Control Zones.
-Changed Fast RSI to Green and Slow RSI to Red.

Kurtosis with Skew Crossover Focused OscillatorDescription:
This indicator highlights Skewness/Kurtosis crossovers for short-term trading:
Green upward arrows: Skew crosses above Kurtosis → potential long signal.
Red downward arrows: Skew crosses below Kurtosis → potential short signal.
Yellow upward arrows: Extreme negative skew (skew ≤ -1.7) → potential oversold/reversal opportunity.
Oscillator Pane:
Orange = Skewness (smoothed)
Blue = Kurtosis (adjusted, smoothed)
Zero line = visual reference
Usage:
Primarily for 2–5 minute charts, highlighting statistical anomalies and potential short-term reversals that can be used in conjunction with OBV and/or CVD
Arrows signal potential entries based on skew/kurt dynamics.
Potential ideas???????
---------------------------------------
Add Supporting Market Context
---------------------------------------
Currently, signals are purely based on skew/kurt crossovers. Adding supporting indicators could improve reliability:
Volume / CVD: Identify when crossovers occur with real buying/selling pressure.
Wick Imbalance: Detect forced moves in price structure.
Volatility Regime (Parkinson / ATR): Filter signals during high volatility spikes or compressions.
Experimentation: Try weighting these supporting signals to dynamically confirm or filter skew/kurt crossovers and see if false signals decrease on 2–5 minute charts.
--------------------------------------
Dynamic Thresholds & Scaling
--------------------------------------
Right now, the extreme skew signal is triggered at a fixed level (skew ≤ -1.7). Future improvements could include:
Adaptive thresholds: Scale extreme skew levels based on recent standard deviation or intraday volatility.
Kurtosis thresholds: Introduce a cutoff for kurtosis to identify “fat-tail” events.
Experimentation: Backtest different adaptive thresholds for both skew and kurt, and see how it affects the precision vs. frequency of signals.
--------------------------------------------------
Multi-Timeframe or Combined Oscillator
--------------------------------------------------
Skew/kurt signals could be combined across multiple intraday timeframes (e.g., 1-min, 3-min, 5-min) to improve confirmation.
Create a composite oscillator that blends short-term and slightly longer-term skew/kurt values to reduce noise.
Experimentation: Compare a single timeframe approach vs multi-timeframe composite, and measure signal reliability and lag.
I'm leaving this open so anyone can experiment with it as this project may be on the backburner, but these are my thoughts so far

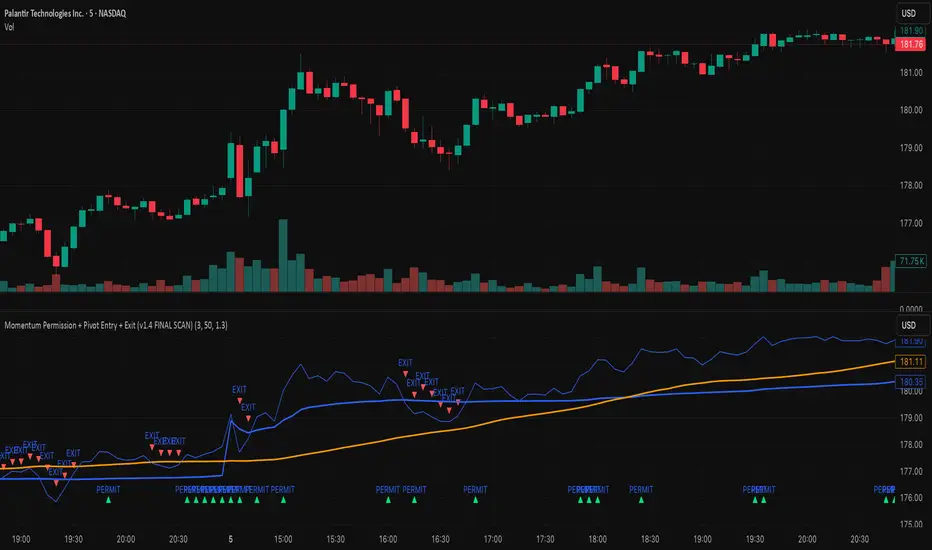
Momentum Permission + Pivot Entry + Exit (v1.4 FINAL SCAN)plot(permitOut, "PERMIT", display=display.none)
plot(entryOut, "ENTRY", display=display.none)
plot(exitOut, "EXIT", display=display.none)
Bullish/Bearish Divergence DetectorUsuable on all time-frames
Indicates multiple divergences (up to 3) with the same start point/date of the divergence

Vicky IndicatorMomentum indicator used for day trading only. Focus on the line. If it crosses below midline then sell options and square off when it crosses midline on the up. Color changes added for better understanding. This is more refined than other indicators and gives better entry and exits

Overnight Z/VolRatio SignalThis indicator highlights overnight setups where both volatility expansion and prior-day range deviation suggest directional opportunity at the RTH open.
It calculates:
• Overnight Z-Score (Z_long): how far the overnight session’s range tilts from the 20-day overnight mean, standardized by its standard deviation.
• VolRatio: ratio of the current RTH session volume to the 20-day average, a proxy for participation and conviction.
Signal Logic (LONG bias)
A long-bias condition triggers when:
• Z_long ≥ 0.40 (overnight tilt strongly positive)
• VolRatio ≥ 1.30 (above-average RTH volume)
• Optional filters: R1/R4 region alignment, YDH/YDL proximity, and other context flags.
Visuals mark qualifying days with colored labels and session highlights.
It is intended as a context signal — not an auto-trading system — for SPY/SPX/ES or correlated large-cap indices.
Usage Notes
• Works best when applied to daily or intraday 5m chart with extended hours enabled.
• Typical exit: ~150 minutes after 09:30 ET.
• Fridays are optionally excluded to avoid expiration-related distortions.

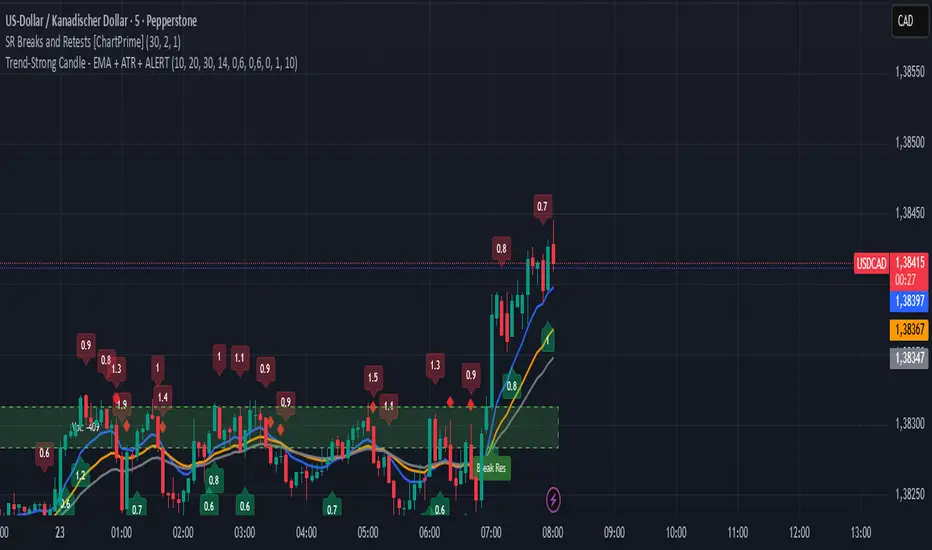
Trend-Strong Candle - Pro Multi Assetighlights:
Major Assets Mode (optional): EURUSD, GBPUSD, USDJPY, AUDUSD, USDCAD, NZDUSD, EURGBP, EURJPY
One‑per‑bar alerts, 24/7 toggle, no session limits
Default EMAs 20/40/60, improved stability and EMA-close filters
Lightweight performance, warning-free calculations, and clearer arrows/plots