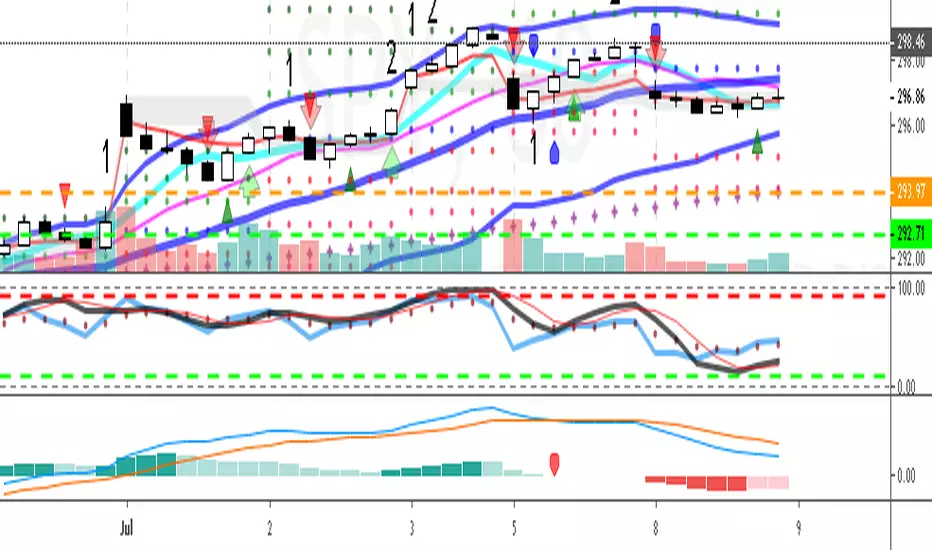
Market Smith IndicatorsMarket Smith has a collection of tools that are useful for identifying stocks. On their charts they have a 21/50/200 day moving averages, high and low pivot points, a relative strength line, and a relative strength rating. This script contains indicators for the following:
21/50/200 Day Moving Averages
High and Low pivot points
A Relative Strength line
A Relative Strength rating
21/50/200 Day Moving Averages
The 21/50/200 Day moving averages are simple moving averages. They are visible in any chart increment but to use them properly you need to set you charts to be by day. Labels will appear on the right of the lines to show that they are representative of 21/50/200 day moving averages.
High and Low pivot points
The High and Low pivot points are green for high pivot points and red for low points. They are show in the Market Smith style with the numbers simply above the pivot points.
Relative Strength line
The Relative Strength line is a line that shows the strength of the stock compared to the S&P 500. In this case we utilize the SPX ticker to compare the stock to. This line is almost identical to the Market Smith tool and is an excellent tool to determine how a stock is doing compared to the market. When movements in the stock and shown with sideways trending of the RS line that means that the stock is following the market. When a stock is outperforming the market the RS line will follow.
Relative Strength rating
Thank you to ©Fred6724 for the RS Rating inspiration. They wrote excellent open source code for a RS Rating comparable to Market Smith. As the RS Rating in Market Smith is not open source it is difficult to know exactly how it is being calculated. After simplifying Fred's code and building upon a few ideas I had I compared the RS Rating to multiple Market Smith Ratings. The rating is close but often off by multiple points. If there is anyone who has a better idea on how to get this rating or how to improve on the code please send me a PM or fork this project. This rating is a good indicator to see how a certain stock compares to other stocks in the market. In Market Smith they are able to utilize their database to compare it to all other stocks. Since we do not have access to the same tools we are only able to compare it to the percentage of stocks above the 200, 150, 100, 50, and 20 day moving average.
Using these tools together are a small fraction what make people like Bill O'neill and Jim Roppel so successful. I plan on updating the RS Rating as I continue to work on this project so if there is anyone who has ideas then please send me a PM. Ultimately the goal of this project is to have a solution that is identical to Market Smith.
"indicators" için komut dosyalarını ara

RSI MTF [Market Yogi]The Multi-Time Frame RSI with Money Flow Index and Average is a powerful trading indicator designed to help traders identify overbought and oversold conditions across multiple time frames. It combines the Relative Strength Index (RSI) with the Money Flow Index (MFI) and provides an average value for better accuracy.
The Relative Strength Index (RSI) is a popular momentum oscillator that measures the speed and change of price movements. It oscillates between 0 and 100 and is used to identify overbought and oversold conditions in an asset. By incorporating the RSI across multiple time frames, this indicator offers a broader perspective on market sentiment.
In addition to the RSI, this indicator also includes the Money Flow Index (MFI). The MFI is a volume-based oscillator that measures the inflow and outflow of money into an asset. It takes into account both price and volume, providing insights into the strength and direction of buying and selling pressure.
By combining the RSI and MFI across multiple time frames, traders gain a comprehensive understanding of market dynamics. The indicator allows for comparing the RSI and MFI values across different time frames, enabling traders to identify divergences and potential trend reversals.
Furthermore, this indicator provides an average value of the multi-time frame RSI, offering a consolidated signal that helps filter out noise and enhance the accuracy of trading decisions.
Key Features:
1. Multi-Time Frame RSI: Combines the RSI across different time frames to provide a comprehensive view of market sentiment.
2. Money Flow Index (MFI): Incorporates the MFI to gauge buying and selling pressure based on both price and volume.
3. Average Calculation: Computes the average value of the multi-time frame RSI to generate a consolidated trading signal.
4. Divergence Detection: Enables traders to spot divergences between the RSI and MFI values, indicating potential trend reversals.
5. Overbought and Oversold Levels: Highlights overbought and oversold levels on the RSI, aiding in timing entry and exit points.
The Multi-Time Frame RSI with Money Flow Index and Average is a versatile tool that can be applied to various trading strategies, including trend following, swing trading, and mean reversion. Traders can adjust the time frame settings to suit their preferences and trading style.
Note: It's important to use this indicator in conjunction with other technical analysis tools and indicators to validate signals and make informed trading decisions.

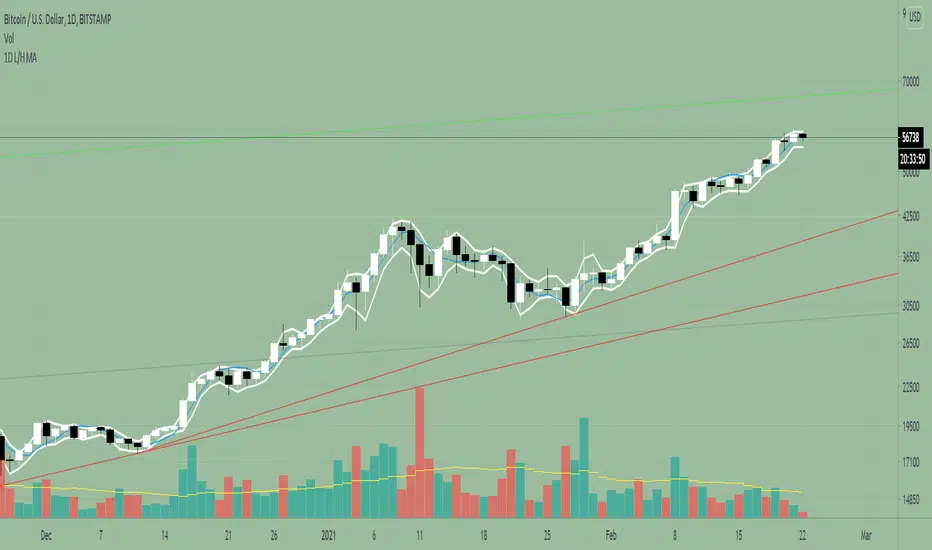
Fierytrading: Volatility DepthDear Tradingview community,
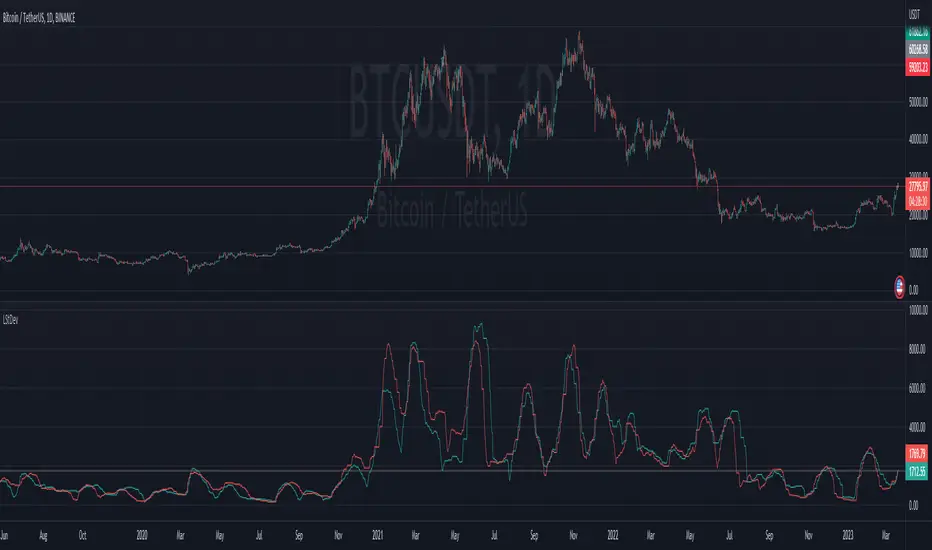
I'd like to share one of my staple indicators with you. The volatility depth indicator calculates the volatility over a 7-day period and plots it on your chart.
This indicator only works for the DAILY chart on BTC/USD.
Colors
I've color coded the indicator as follows:
- Red: Extreme Volatility
- Orange: High Volatility
- Yellow: Normal Volatility
- Green: Low Volatility
Red: extreme changes in price. Often during local tops and bottoms.
Orange: higher than average moves in price. Often before or after a "red" period. Often seen in the middle of bear or bull markets.
Yellow: normal price action. Often seen during early stage bull-markets and late stage bear-markets.
Green: very low price movement. Often during times of indecision. Once this indicator becomes green, you can expect a big move in either direction. Low volatility is always followed by high volatility.
In a long-term uptrend, a green period often signals a bullish break out. In a long-term downtrend it often signals a bearish break out.
How to use
Save the indicator and apply it to your chart. You can change the length in the settings, but it's optimized for 7 days, so no need to change it.
I've build in alerts for all 4 different volatility periods. In most cases, the low volatility alert is enough.
Good luck!

Ladder StDevThis indicator shows the upwards (green) and downward (red) volatility of the market. It is a standard deviation of the price but with a twist! For the upwards volatility , only the green candles are taken into account, and for the downwards only the red candles are.
Compared to my previous "Ladder ATR" indicator this a different approach to measure the the upwards and downwards volatility of the market by utilizing the standard deviation instead of the ATR. When both measure the volatility they have different "dynamics". Standard deviation increases the weight of larger values over smaller values. The ATR indicator is based on the average of absolute changes. So, if we apply the indicators on a daily chart , ATR considers intraday and between-day data, while the standard deviation calculation includes only daily returns (source price).
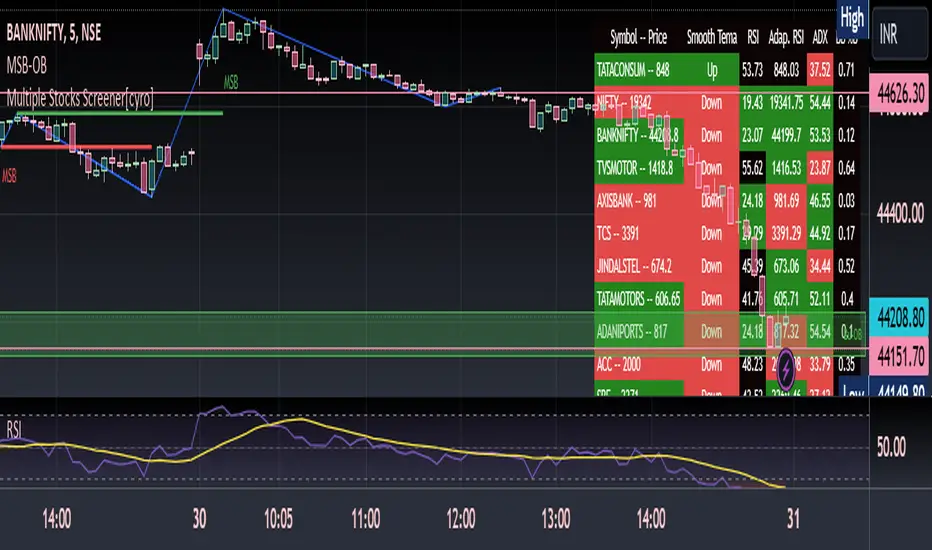
Multiple Indicators ScreenerThis is a stock screener that incorporates open source code by QuantNomad, with the addition of slow and fast EMA pullback and crossover functions. It is designed for intraday scalping and quick trades, using 1, 3, and 5 minute candles. The RSI, Supertrend, and ADX indicators help to confirm trade setups, and the use of discount, premium, and equilibrium zones can improve results. With the ability to screen 40 stocks, the screener ensures that no quick action is missed. ]
Disclaimer
It is important to note that any trade initiated using this screener should be well researched, as the creator is not responsible for any profit or loss incurred.
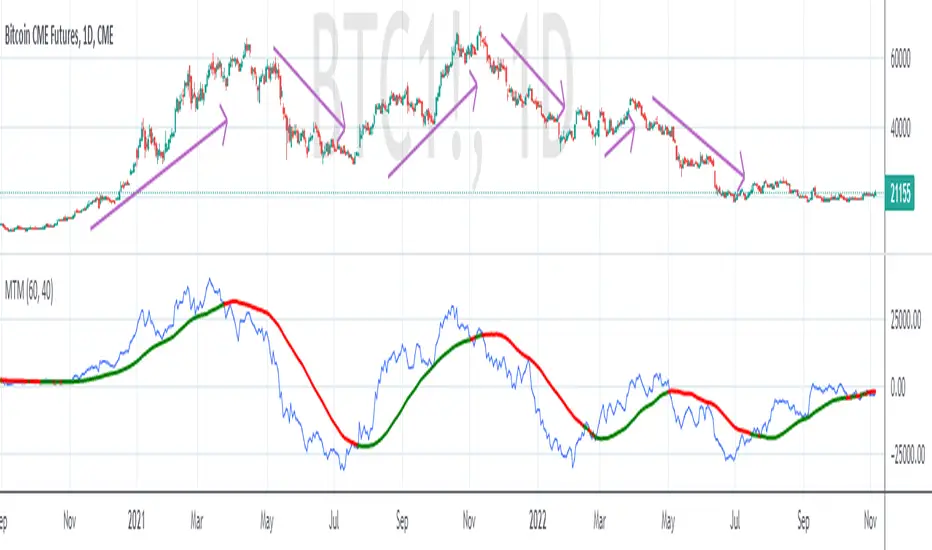
MTM - Momentum IndicatorMTM - Momentum
Description
The Momentum indicator is a speed of movement indicator that is designed to identify the speed (or strength) of price movement. This indicator compares the current close price to the close price N bars ago and also displays a moving average of this difference.
Category
Momentum Indicators
Parameters
N ( Default: 6 Min: 1 Max: 100 )
N1 ( Default: 6 Min: 1 Max: 100 )
Chart Script
MTM : CLOSE-REF(CLOSE,N);
MTMMA : MA(MTM,N1)
www.edgerater.com
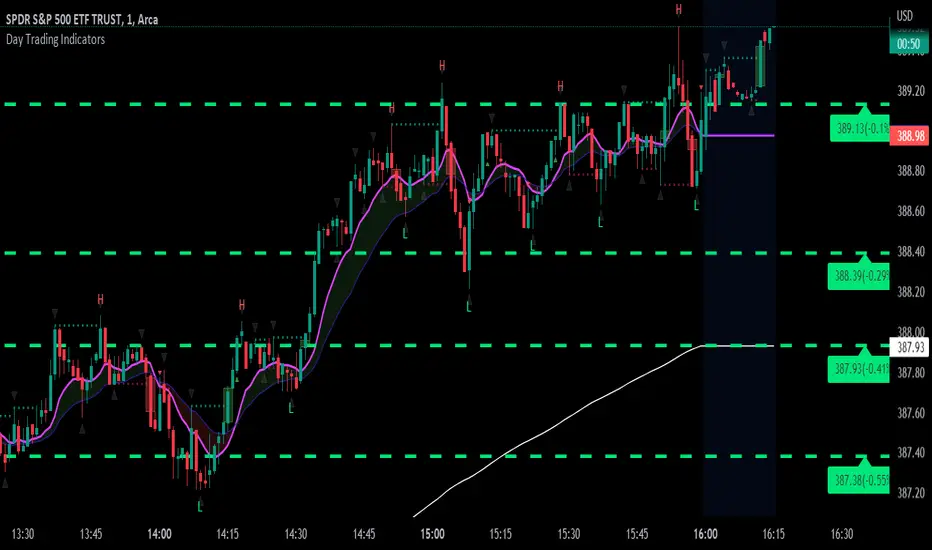
Best Indicators for Day TradingThis is the best indicator for Day Traders. It is great for traders who don't want to pay for more indicators
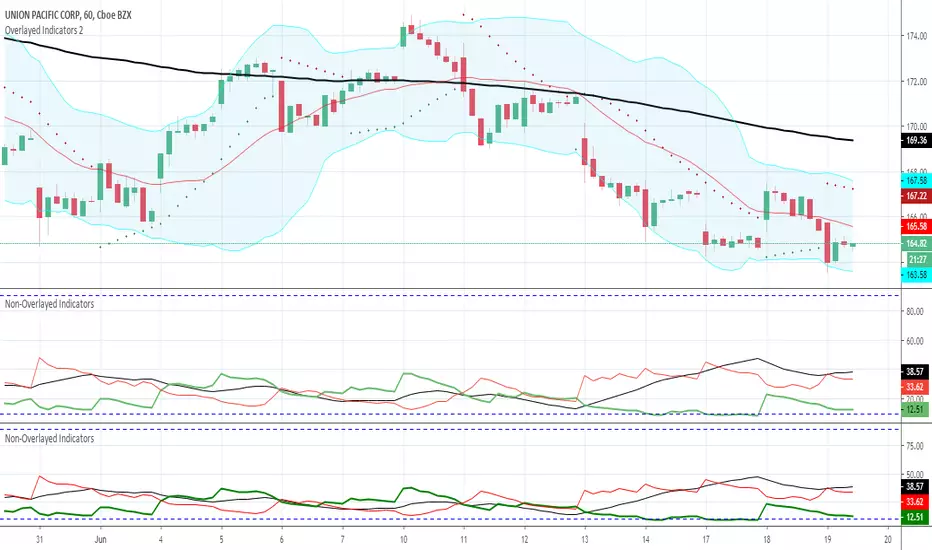
CA - Indicators ColorsThe following indicator help to have an idea of the current state of the MACD and FullStochastic in 1 hour and 1 day. If you are a trader that is regularly using stochastics and macd indicator and don't have enough space in you screen this might help to increase the space in your screen.
Parameters used on MACD: 12, 26,9
Parameters used on Stochastics: 14,5,5
The whole idea of the indicator is if you see an entry for a long position, you can confirm that a higher timeframe its aligned by both indicators and if you are seeing an entry for a short position you can confirm with a higher timeframe.
This indicator doesn't provide an entry or exit signal, but lets you verify where is the trend going in those timeframes so it helps you decide to make the trade.
Stochastic
Green: going up
Red: going down
Macd
Green: going up
Light Green: previous was green and going down.
Red: going down
Light Red: previous was red and going up
Keep in mind, the colors are going to get updated as long as the market is active.
Any feedback its appreciated.

Divergence for Many Indicators v4 STHello Traders.
This is the Strategy version of Divergence for Many Indicators v4, an easy and comfortable indicator.
- - - -
*It's been modified a little bit from the original.
*I got permission from the original author.
*I'm not good at English, I'm sorry.
- - - -
< 4 things to check >
1. Since repainting is not performed, the first imprinted signal can be accurately seen.
2. It does not respond to continuous diversions.
3. If the opposite diversity is not imprinted, caution is required as it is designed not to indicate liquidation. Be careful when reading the figures shown in the strategy tester.
4. Added stop loss and take propirane.
< What changed? >
1. pivot period 5 - > 9
2. Money Flow index and Chaikin Money Flow are released.
- - - -
KOR SUB
< 4가지 확인 사항 >
1. 리페인팅이 없으므로 첫 번째로 각인된 신호를 정확히 볼 수 있습니다.
2. 연속된 다이버젼스에 대해서는 반응하지 않습니다.
3. 반대의 다이버젼스가 각인되지 않으면 청산 표시를 하지 않도록 설계되어 있으므로 주의를 요합니다.
4. 스탑 로스와 테이크 프로핏 항목을 추가하였습니다.
< 무엇이 변경되었나? >
1. 피봇 페리어드 값이 조금 수정되었습니다.
2. MFI & CMF 가 체크 해제된 상태입니다.
THANK YOU ^^

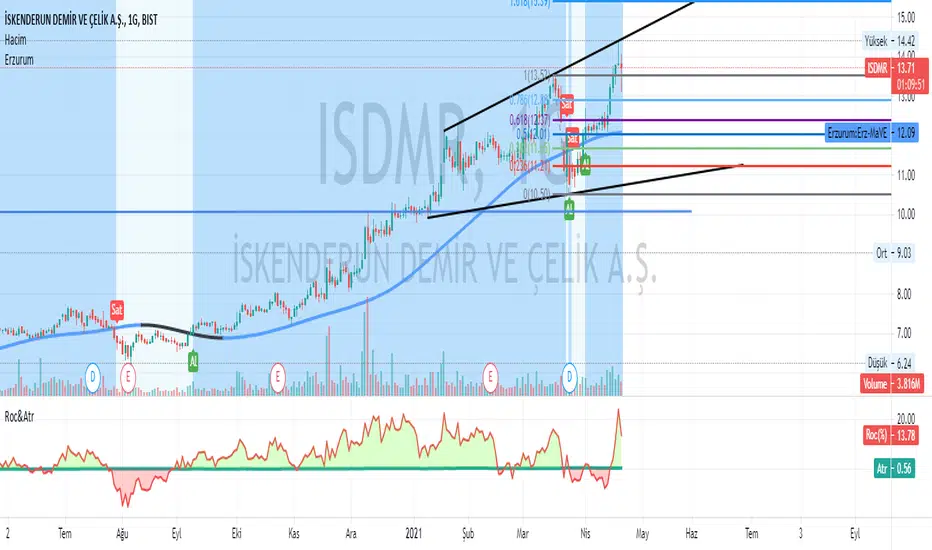
Erzurum Indicators (By DadashKadir)Erzurum Indicators (By DadashKadir)
An indicator in which you will keep track of the buying and selling movements by adding the movements of the three moving averages together. The parameters were determined as Moving Average (SMA), Exponential Moving Average (EMA), Weighted Moving Average (WMA) and Volume Weighted Moving Average (VWMA). Its constant value was taken as WMA. It is used to calculate the averages of 3 - 5 and 7. You can include the standard deviation (STDEV) in these moving averages.
The name of the indicator is taken from our city of Erzurum, the pearl of Eastern Anatolia.
ELIA MULTI INDICATORS STRATEGYExperimental multi indicators strategy, to catch right entry and avoid noise.
Each indicator included in the strategy, assume a value based on its status and because is a trend-follow strategy, some indicator value are higher then the other
Backtested on ETHUSDTPERP
BINANCE:ETHUSDTPERP

1D Low/High MA + Least Square Mean (3 indicators in 1)This indicator is a combination of 3 public indicators being:
* a standard Simple Moving Average with the source as the candle low & length of 2
* a standard Simple Moving Average with the source as the candle high & length of 2
* the Least Square Mean with a source of high + low /2 and length of 9
This combo was inspired by Tyler Coates who crafted EMASAR.
He regularly uses the a SMA with source of Low / High and length of 2 for defining trading daily ranges as well as the Least Square Mean for calculations in the his trading which he teaches via youtube.
I hope this indicator will reduce time spent on setting up charts.
Trend Indicators CollectionAnalyses MACD crosses with Ichimoku cloud direction and state
General idea:
- MACD crosses usually point to a change in trend direction and Kumo state and direction often act as a confirmation as well as a trend strength indicator. Using this, the script points out where there were was or can be a point where the trend change may have the strength to carry on.
Buy warnings:
- This warning will be triggered in two ways, both of them only if MACD is above EMA and the current close price is over Kumo:
- Senku span A crosses over Senku B (Kumo turns positive) when MACD is already positive
- MACD turns positive when Kumo is already positive
Sell warnings
- Triggered in two ways:
- Kumo turns negative when the current close price is bellow EMA
- The inverse of the above, the current close price falls bellow EMA when the Kumo is already negative
Trend Indicators Collection (TIC) contains:
- MACD, EMA, ADX, Mass index, Ichimoku Cloud, and Pivot points
- Best suited for monthly charts with 30m bars

Large caps indicatorsThis script contains the main indicators I use while trading large caps
These are:
1) daily EMA20 to intraday chart (green solid)
2) daily SMA100 to intraday chart (orange solid)
3) daily SMA200 to intraday chart (purple solid)
4) previous day close price (orange dotted)
5) high of day (green dotted)
6) low of day (red dotted)

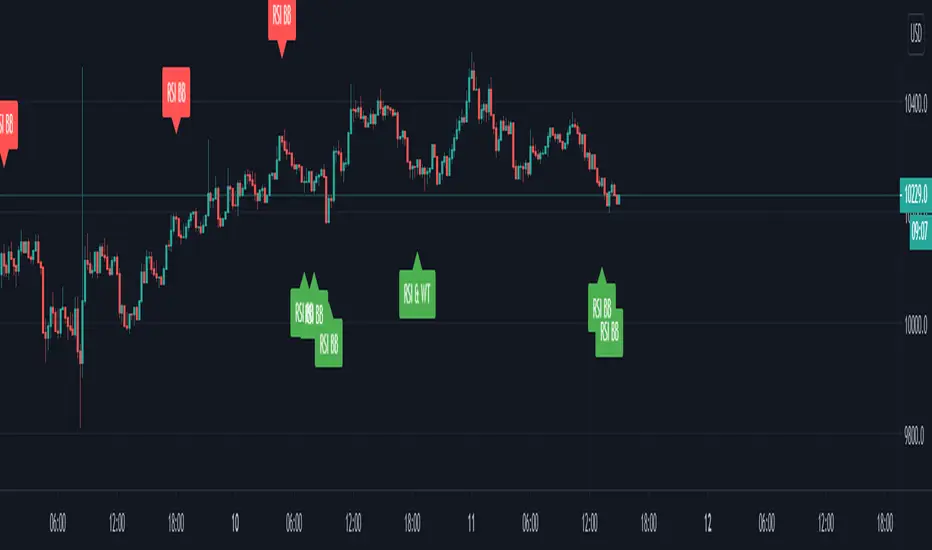
RSI combined with 3 different indicatorsThis is RSI combined with 3 different indicators that prints signals as a overlay
1. RSI cross Bollinger Band indicator that paints bgcolor short and long signals when the RSI cross's up through the lower bollinger band ( Long ) or cross's down through the upper bollinger band ( Short )
2. RSI and Wave Trend Dot combination
3. RSI and Directional Index Indicator combinations
You can turn on and off any of the signals, and have alerts for all 3, or individually
Please note the Range Filter code in the script is not part of the final signals as i have set the bars back 100, so thatis always that condition meet
Also please note there is still noise with this, you need to use with something else like MFI or VFI
Pivot Points Percentage Differences (W/ High & Low Indicators)This script is really handy for day trading. This works best on low time frames like the 1 minute or the 5 minute .
To understand what pivot points are you can add other pivot point indicators or just look at the color differences below since every-time that changes it's a new pivot point (which represents a known low or known high with high certainty)
The script shows the most recent percentage move up or down for the last known pivot point based on the pivot point setting data.
Pivot points are generated after 20 bars go by default, but you can set this to whatever you wish in the settings . Just click the gear icon for the script to set these.
You can also set how many bars back to look for what was the last highest percentage move (down or up). This will be important for your day trading strategy.
The idea to trading with this is pretty simple.
You look at the highest percentage moves that were made on pivots up or down and if you notice a current move that has trended down or up to the highest percentage, that makes that a safer bet for shorting or longing.
Of course, sometimes, things move greater or less than normal, so you would set stop losses accordingly.
Hope this helps with your day trading for finding good entry and exit points!
EXAMPLE TRADE SCENARIO
You notice the last high for the last 100 bars was 3% . The price recently rose 3% from a known pivot low. You can put a short on this. You noticed that the average price down was 2% , so if the price drops 2% or close to it you can exit your short and go LONG . You set a stop loss above what you put by an extra percentage to be safe.
I will do an experimental strategy version of this idea if people are interested.

4 in 1 Stoch Indicators as used by HG (Stoch, SRSIx2, DMIStoch)By using this indicator you can better view the Stoch indicators used by this strategy which are:
- Stochastic (14,3,3)
- Stochastic RSI (14,14,3,3)
- Stochastic RSI (6,6,3,3)
- DMI Stochastic
This is best used alongside:
- Evan Cabral binary strategy 2
- Binary with Temito
The analisis is:
- When all lines in the indicator are above or below the overbough/oversold lines
- When the bollinger bands are broken
- A support or resistance is reached
That means a change of Trend.

Dr_All indicators V1.0Free users have many restrictions on their use in TradingView.
I put together a lot of indicators I use often.
5 moving average
1 parabolic SAR
1 bollinger band
1 ichimoku cloud
(but it's only cloud)
as always
It's open source.
enjoy!

Bundle of various indicators, All-in-oneThis scripts compiles many indicators into one. It comes from many sources and i added all sources i used. If i forgot one, don't hesitate to message me.
This is useful if you need to setup your chart layout fast. The menu makes it easy to configure it.
You can configure and display:
- Various types of moving averages: RMA, SMA , EMA , WMA , VWMA , SMMA , HullMA, LSMA , DEMA , TEMA
- Stochastic RSI crosses from multi-timeframes directly on candle's close (1h, 4h, D, W)
- Bollinger bands with primary and secondary deviation
- SAR
- Color background using difference between Stochastic RSI K and D
- Support and resistance
- Open high low close from higher timeframes (D, W, M)
- Auto fibonacci levels (still a work in progress, i will add logarithmic fibonacci levels too later)
- "Alt season" for crypto users: if BTC dominance cross his SMA , display a pictogram on every chart
Stil working on:
- Auto fibonacci levels: i will add logarithmic fibonacci levels
- Stochastic crosses
- Alt season: use others types of moving averages
If you have any suggestions / improvements, feel free to message me or write it in the comments below.

Easy indicatorsSo lets make life easy
all indicators in info panel+ recomonation of buy (if green) at the top of the info
just for fun

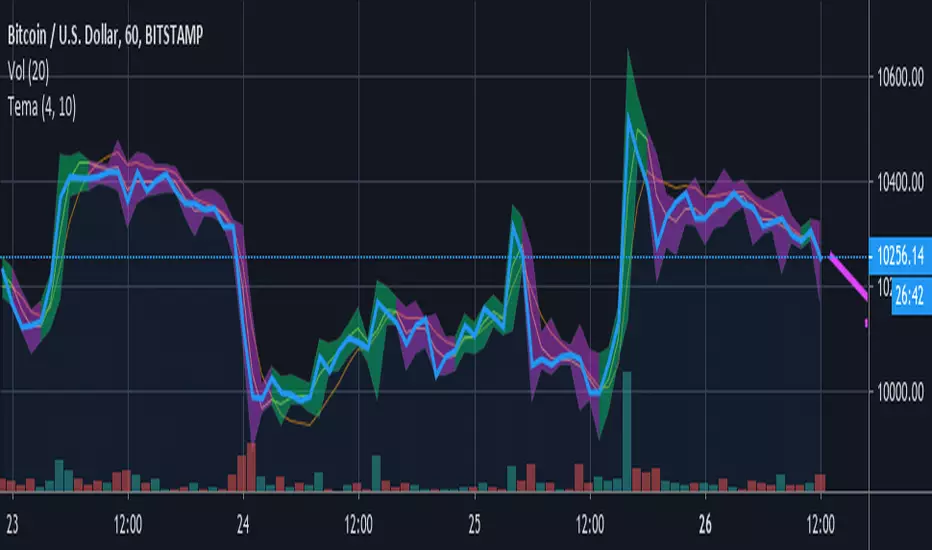
Team TemaTema highlights bars based on the triple ema ( tema ) with two different length qualifiers.
The tema is believed to react quicker to price fluctuations than the simple moving average ( sma ), the exponential moving average ( ema ), and the double ema ( dema ). The shorter length tema crossing over the longer one is believed to indicate a bullish trend ahead, highlighted in green. The shorter length crossing below the longer one may indicate a bearish trend is on the way.
Benefits.
It has been found that most traders lose money because they panic early, and don't let profits run. Tema helps me to filter out trading noise , reduce stress and stay in profitable trades longer . Highlighting the candle wicks reveals trends in highs and lows that may be difficult to see otherwise. I like being able to adjust the settings and look back to see how much noise would have been good to filter out.
Things to watch out for.
Like other moving averages, the tema is a lagging indicator , vulnerable to false signals, especially during a large move up or down . Use with other indicators that are better designed for detecting tops and bottoms. Adjust the lengths to filter out what you think may be wrong signals. The settings are subjective , and it depends on the security and the time period. Manually create a note or reminder with your favorite settings for each. You may choose how much price fluctuation to filter out by going into settings, marked with the gear icon.
Unconfirmed sentiment arrow.
Tema draws an arrow of current sentiment , based on the unconfirmed price action of the faster tema. It shows where it thinks prices are presently going, barring other factors. Its main purpose is to extend a line from the end of the tema, so it is not difficult to see. Remember, it is probably wrong until the last bar closes. And even then, buyers or sellers could come along at any moment and change the outlook.
Opening range plus essential indicators all in oneThese are some essential indicators I use which do not clog up too much of the window.