ICT POIs By DSIndicator to identify POI's like OB/FVG and SCOB. It also have a different ATR based filters and inside bar logic for OB detection
"ict" için komut dosyalarını ara


ICT Quant-Core: Liquidity Intelligence [Dual-Engine]🔥 THE ULTIMATE LIQUIDITY FILTERING ENGINE
Most SMC traders lose money because they "catch falling knives" on every local wick. This algorithm solves this problem by using DUAL-CORE logic and a signal quality scoring system.
This is no ordinary pivot indicator.
⚙️ HOW DOES IT WORK? (DUAL-CORE LOGIC)
The algorithm analyzes the market on two levels simultaneously:
1️⃣ MACRO CORE (Lookback 50 - "WHALE 🐋")
Tracks key levels from recent weeks/months.
This is where institutions build their positions.
Signals from this core have the highest priority (Score 10/10).
2️⃣ LOCAL CORE (Lookback 20 - "ROACH 🐟")
Tracks internal market structure and noise.
Signals are filtered by the Main Trend. If the trend is down, Local Longs are marked as "TRAP."
🧠 SMART FILTERS (QUANT LAYERS)
Instead of entering on every line touch, the script requires confirmation:
✅ RECLAIM LOGIC: Price must close back above/below the liquidity level (Swing Failure Pattern).
✅ RVOL FILTER: Requires relative volume > 1.2x the average (institutional track).
✅ SCORING SYSTEM (0-10): Each signal receives a score.
- 10/10: Macro Grab in line with the trend + high volume.
- 3/10: Local Grab against the trend (risky).
📊 ANALYTICAL DASHBOARD
In the lower right corner, you'll find the "Command Center":
- Trend Status (Distribution/Accumulation)
- Whale's Last Move (Price and Direction)
- Current Tactics (e.g., "Ignore Longs, Search for Shorts")
- Filter Status (RSI, Volume, Reclaim)
🚀 HOW TO USE IT?
1. Set the H4 timeframe.
2. Wait for a signal with a rating > 7/10.
3. Ignore "Fish/Local" signals (small icons) if they contradict the Dashboard color.
4. Entry occurs only after the candle closes (Reclaim).


ICT/SMC Holy GrailThe Holy Grail, with its backtesting feature to check win rates, is all you need to do when placing orders!

ICT NWOG/NDOG + Key Time and Price LevelsShows new day opening gaps and new week opening gaps, with custom settings to show past gaps
Shows time and price levels of midnight, 7:30am, and 1:30pm

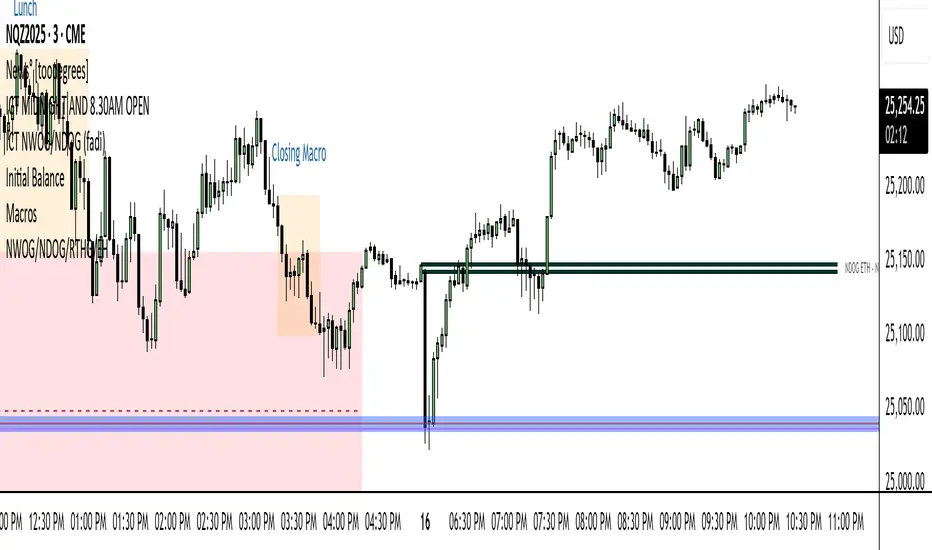
ICT Macro Slot Algo Event📊 Overview
A powerful multi-timeframe trading indicator that combines Institutional Macro Session Tracking identify optimal trading windows throughout the day. This tool helps traders align with institutional flow patterns and algorithmic activity across major sessions.
🎯 Key Features
1. Macro Algo Event Sessions
Tracks 6 key institutional time windows during NY Session:
NY Sweep (08:50-09:10) - Opening balance flows
Silver Bullet #1 (09:50-10:10) - First major macro move
Silver Bullet #2 (10:50-11:10) - Second chance/retest opportunity
Lunch Macro (11:50-12:10) - Mid-day repositioning
Post-Lunch Rebalance (13:10-13:40) - Post-lunch adjustments
NY Closing Macros (15:15-15:45) - End-of-day flows

ICT Macro Slot Algo Event📊 Overview
A powerful multi-timeframe trading indicator that combines Institutional Macro Session Tracking to identify optimal trading windows throughout the day. This tool helps traders align with institutional flow patterns and algorithmic activity across major sessions.
🎯 Key Features
1. Macro Algo Event Sessions
Tracks 6 key institutional time windows during NY Session:
NY Sweep (08:50-09:10) - Opening balance flows
Silver Bullet #1 (09:50-10:10) - First major macro move
Silver Bullet #2 (10:50-11:10) - Second chance/retest opportunity
Lunch Macro (11:50-12:10) - Mid-day repositioning
Post-Lunch Rebalance (13:10-13:40) - Post-lunch adjustments
NY Closing Macros (15:15-15:45) - End-of-day flows

ICT FVG Signal
During the silver bullet window, it clearly highlights when and in which direction to look for FVGs. When a signal appears, nearby FVGs or iFVGs often provide excellent entry opportunities. Feel free to share your thoughts and experiences.

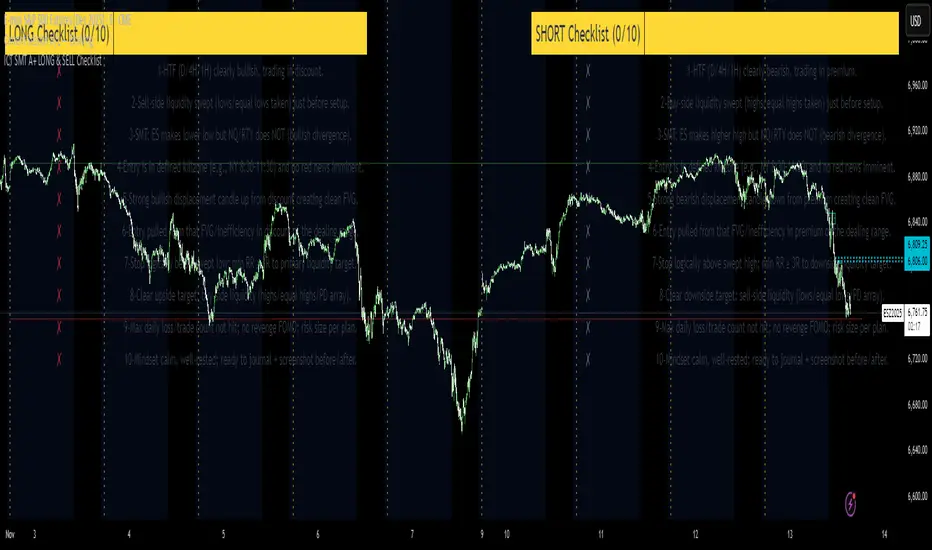
ICT SMT A+ LONG & SELL ChecklistTrade Checklist. Once all items checked color changes from yellow to green.
[ICT V5 HOD/LOD]Adaptive Cutoff Logic:
Automatically adjusts HOD/LOD calculation cutoff based on the instrument type (Forex or Indices).
Gap Correction (1m Base):
Detects and corrects overnight gaps for accurate HOD/LOD levels.
Session Band (Optional):
Visual 09/10:00–12:00 range highlighting, customizable by symbol type.
Smart Reset System:
Automatically resets all drawings and session markers at the start of each new trading day.
Customizable Appearance:
Choose colors, line thickness, transparency, and how many past sessions to keep.
Hide After Noon (Optional):
Clean chart mode that hides daily HOD/LOD lines after 12:00 local time.

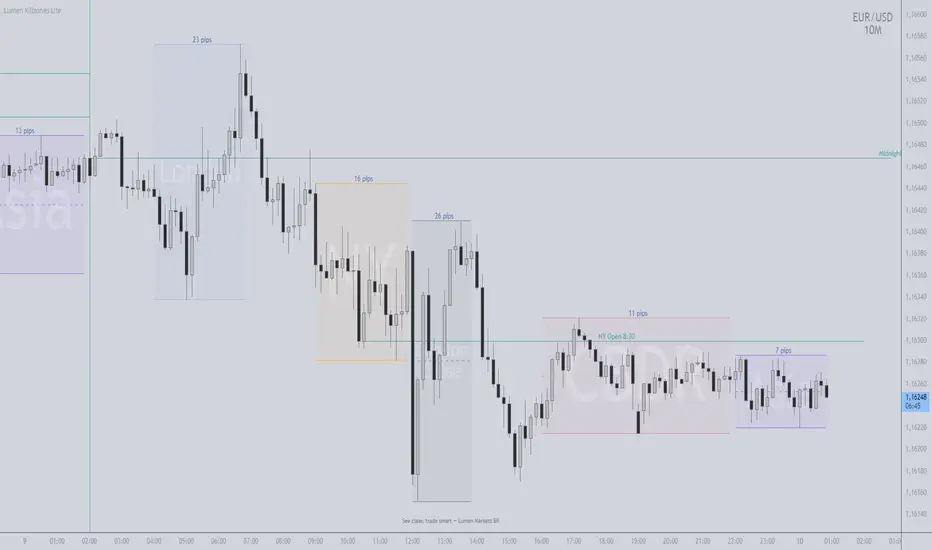
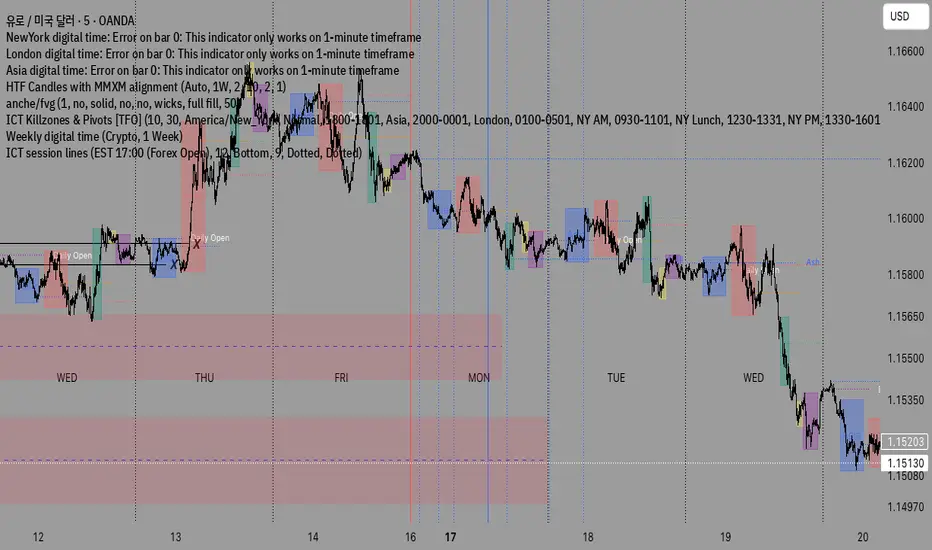
ICT killzones Magic Makers
TIMEZONE (ESSENTIAL)
- Use Exchange Timezone (symbol):
- ON = uses the asset's native timezone (auto DST)
- OFF = uses the fixed timezone set in "Fixed Timezone" (e.g., America/New_York)
- This realigns Midnight, NY 8:30, and Sessions on the chart.
MIDNIGHT & NY 8:30
- Midnight: anchors the day's price (above = buyer bias; below = seller bias, in context).
- NY 8:30: institutional flow/volatility window; often sets the session's pace.
- Optional: enable "History" and "Past-day Labels" to compare days.
SESSIONS
- Enable only what you use (Asia, CBDR, London, NY, LC) and adjust times.
- If the chart gets heavy, temporarily turn "Show Boxes" OFF.
MAKERS LEVELS (VALUE/DECISION REGIONS)
- Turn on "Project Makers Levels (±) " and select per session.
- Projects: key levels x the session's range (both directions).
- Uses: targets, partials, breather/reversal. Note: CBDR-based projections are often well respected.
DEVIATIONS (± MULTIPLES OF THE SESSION RANGE)
How to configure:
- Turn "Show Deviations" ON.
- Set "Number of Deviations" (how many multiples to project).
- Choose which sessions get deviations (Asia, CBDR, London, NY, LC).
Practical read:
- Targets for continuation (range expansion) or breather/fade zones when price is extended.
- Combine with structure (HH/HL/LH/LL), Midnight/NY 8:30, FVGs, OBs, and visible liquidity (equal highs/lows).
Pro tip:
- The more impulsive the break of the session range, the higher the chance of reaching ±1x; ±2x and beyond need flow confirmation.
ROUND NUMBERS & WATERMARK (OPTIONAL)
- Round Numbers: price-step lines (e.g., every 500 ticks).
- Watermark: custom text and/or Ticker+Timeframe.
PERFORMANCE
- If heavy: disable unused sessions, Text/Pips in boxes, or "Show Boxes".
ICT Largest Midnight–00:30 FVG (NY, 1 per day) — FIXEDmarks out the first and largest fvg on the 1 min chart from midnight open until 12:30 am est

HTF Candle Mean ThresholdICT Mean Threshold concept. Any time frame find the center of any Higher Time Frame candle. I made this because I couldn't find one under this name.

ICT Killzones_SAIFKill Zones Shading with High and Low levels highlight for required market sessions

Shaan_ICT_KZ_IMB_BPRICT KillZones , Imbalance , BPR available in one indicator .
Time zone is UTC-4 , During Day light saving will be UTC-5

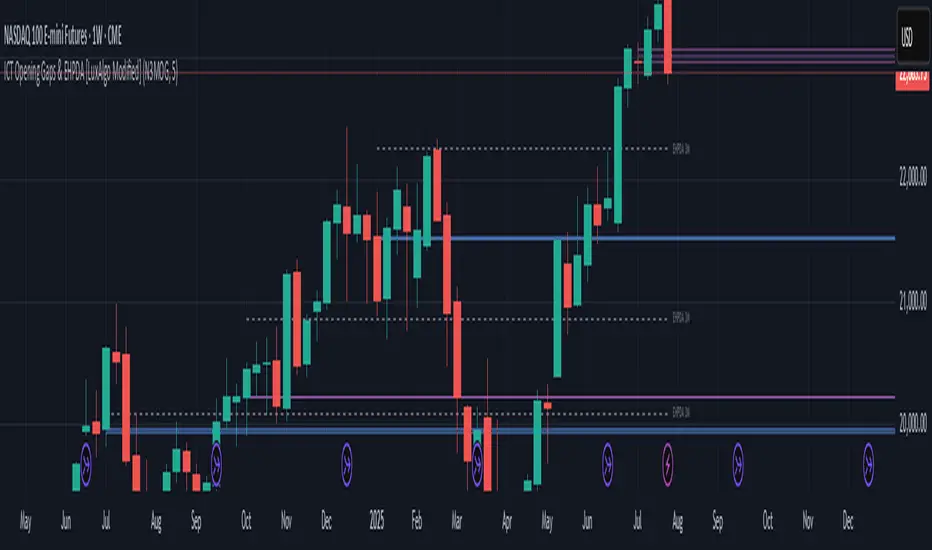
ICT Opening Gaps & EHPDA [LuxAlgo Modified]Modified version of LuxAlgo's original opening gap indicator to include NMOGs and NYOGs

ICT Macro Tracker° (Open-Source) by PesSpecific time indicator for order effectiveness when US market opens

ICT x Vihapa 4 in 1Indicator Description:
This indicator is designed to provide comprehensive market structure and session-based insights. It includes:
NWoG / NDoG Levels: Displays New Week Opening Gap (NWoG) and New Day Opening Gap (NDoG) for market context.
Key Opening Price Levels: Highlights significant time-based price levels, including 00:00, 08:30, 09:30, and 13:00.
Previous Key Levels: Marks critical historical levels such as the previous week's high and low, previous day’s high and low, and 4-hour highs and lows.
Trading Sessions: Clearly distinguishes major market sessions including the Asian, London, and New York sessions.
This indicator serves as a valuable tool for traders seeking to align their strategies with institutional price behavior and time-based market dynamics.

ICT SMT Divergence Lines - EnhancedThis indicator identifies and highlights Smart Money Technique (SMT) divergence between two user-selected symbols across any timeframe. It compares the last two completed candles of both symbols and marks potential SMT signals only when market context aligns with smart money principles.
⚡ Key Features
✅ SMT Bullish Signal
Symbol 1 forms a lower low compared to its prior candle.
Symbol 2 forms a higher low compared to its prior candle.
The previous candle on the chart was bearish (close < open).
✅ SMT Bearish Signal
Symbol 1 forms a higher high compared to its prior candle.
Symbol 2 forms a lower high compared to its prior candle.
The previous candle on the chart was bullish (close > open).
✅ Visual Representation
Draws a clean, subtle line between the two SMT candles — green for bullish SMT and red for bearish SMT — making divergence easy to spot.
Optional small triangle markers above or below the bar where SMT is detected.
Old lines are automatically removed to keep the chart uncluttered.
✅ Multi-timeframe compatible
Works on any chart timeframe.
Compares the last two completed candles in the current chart timeframe, or can be adapted for a fixed higher timeframe.
