Gann Single SwingGann Single Swing Indicator
The Gann Single Swing indicator is a sophisticated tool rooted in the geometric and cyclical market analysis principles pioneered by William Delbert Gann. Designed for traders who value deep market structure analysis, this indicator leverages the interplay of price and time to identify key support and resistance zones, potential reversal points, and critical price-time synchronization areas. Its unique approach makes it an invaluable instrument for those employing Gann-based methodologies or seeking a systematic way to decode complex market dynamics.
What It Does
The Gann Single Swing indicator is built to pinpoint high-probability zones for price action, such as support and resistance levels, where traders can logically initiate long or short positions. By analyzing a user-defined price swing (a move between two selected points, such as a local high and low), the indicator constructs a geometric framework that reveals hidden patterns in market movements. It identifies:
Support and Resistance Zones: Key price levels where the market is likely to reverse or consolidate.
Temporal Reversal Zones: Specific time periods where price reversals are more probable due to time-price resonance.
Price-Time Synchronization Points: Areas where price and time align to signal potential market turning points.
How It Works
The indicator’s algorithm is grounded in Gann’s geometric principles, focusing on the relationship between price movements and time cycles. Here’s a high-level overview of its process:
Swing Selection: Traders select two key points on the chart (e.g., a local minimum and maximum) to define a price swing.
Channel Construction: The swing is encapsulated within a dynamic channel, forming the foundation of the geometric model.
Gann Fan Application: A Gann Fan is applied to the channel to calculate critical angles, representing the balance between price and time. These angles help identify resonant points that align with the channel’s central axis.
Squared Channel Analysis: The algorithm creates “squared” channels, geometrically derived sub-structures, analyzed for intersections and alignments to project external support and resistance zones beyond the base swing.
Internal Zone Mapping: Within the base swing, a reverse Gann Fan maps internal zones, highlighting areas of price-time convergence that may act as dynamic support or resistance.
Zone Projection: The indicator synthesizes these calculations to plot precise zones of support, resistance, and potential reversals, both spatially (price levels) and temporally (time-based zones).
While the exact mathematical formulations remain proprietary, the indicator relies on time-tested Gann techniques, such as angle-based analysis and cyclical resonance, to deliver actionable insights.
How to Use It
Select the Swing: Identify two significant points on the chart (e.g., a recent high and low) to define the swing. These points serve as the anchor for the indicator’s calculations.
Interpret the Zones: The indicator plots support and resistance zones (both price-based and time-based). Look for price action near these zones to identify potential entry or exit points.
Combine with Other Tools: For best results, use alongside other Gann-based tools (e.g., Gann Squares or Time Cycles) or traditional technical analysis (e.g., trendlines, Fibonacci levels) to confirm signals.
Monitor Temporal Zones: Pay attention to time-based reversal zones, as they may indicate when a price move is likely to occur, enhancing trade timing.
Why It’s Unique
Unlike conventional indicators that rely on moving averages, RSI, or other common metrics, the Gann Single Swing indicator offers a proprietary blend of Gann’s geometric and cyclical principles. Its ability to integrate price and time into a cohesive model sets it apart, providing traders with a deeper understanding of market structure. The indicator does not use public domain code or standard technical indicators, ensuring originality and value for traders seeking advanced tools.
Who It’s For
This indicator is ideal for:
Traders familiar with Gann’s methodologies who want to automate and enhance their geometric analysis.
Advanced traders looking to uncover hidden market patterns through price-time relationships.
Those seeking a robust, non-traditional tool for identifying high-probability trade setups.
The Gann Single Swing indicator is not a black-box forecasting tool but a powerful framework for dissecting market behavior. By combining user-defined inputs with sophisticated geometric calculations, it empowers traders to make informed decisions based on the timeless principles of Gann’s market philosophy.
"gann" için komut dosyalarını ara

Gann Angles EnterpriseThe Gann Angles indicator is a tool based on the methods developed by William Delbert Gann. It is designed to analyze and forecast price movements in financial markets. The indicator automatically calculates the angle scale using Gann, Herzhik, Heliker, and Borovski methods. Additionally, users have the option to manually input their own angle scale.
The Gann methods and those of his followers are based on representing price movements as geometric shapes such as triangles, squares, and circles. Gann believed that price movements adhere to certain patterns and that future changes can be predicted based on these geometric forms.
The Gann Angle indicator allows users to identify the angles of trend and their strength. It plots template lines with different angles of inclination on the price chart, representing support and resistance levels. These levels can be used to determine entry and exit points in the market, as well as to set stop-loss and profit levels.
When automatically calculating the angle scale, the indicator takes into account various factors such as the current trend, market volatility, and the period of analyzed data. It applies relevant formulas and algorithms to determine optimal angles of inclination and create a fan-like pattern of angles.
However, the indicator also provides the option for users to manually input their own angle scale. This allows analysts or traders to customize the indicator according to their own preferences and strategies.
Overall, the Gann Angle indicator is a powerful tool for technical analysis in financial markets. It helps identify key support and resistance levels and provides information about the trend and its strength. Combining the automatic calculation of the angle scale with the option to input a manual scale gives users flexibility and adaptability in using the indicator. They can consider their own preferences, experience, and unique market conditions when determining angles of inclination and support/resistance levels.
It is important to note that the effectiveness of the Gann Angle indicator, whether using an automatic or manual scale, depends on proper analysis and interpretation of the results. Users should have knowledge and understanding of Gann's methods to make informed decisions based on the data provided by the indicator.
In conclusion, the Gann Angle indicator with automatic and manual angle scale calculation provides users with a powerful tool for analyzing and forecasting price movements in financial markets. It combines the fundamental principles of William Delbert Gann's methods with flexibility and customization to meet the needs of various traders and analysts.
The different methods of calculating the scale give traders the flexibility to choose the follower's school they prefer.
The features of the indicator include:
Mandatory knowledge of Gann's methods.
Use as a template for drawing angles and fan patterns.
Selection of scale calculation options:
Heliker
Herzhik
Gann
Borovski
Manual input of the scale
Working principle:
The indicator is used as a template.
After installing the indicator and configuring it, the trader needs to draw a trend line (or a pre-drawn fan) along the desired angle(s).
Without changing the inclination, the trader simply moves this line to the desired extreme for further analysis.
Advanced Gann S/R LevelsThis powerful Pine Script indicator brings the legendary forecasting methods of W.D. Gann directly onto your TradingView chart. It's designed to provide traders with a complete, automated framework for identifying high-probability intraday support and resistance levels.
By combining the principles of Gann Pivot Points with the harmonic relationships of the Gann Square of 9, this tool calculates and plots the most critical price levels for the current trading day, helping you anticipate market turning points with greater clarity.
Key Features
Dynamic Gann Pivots: Automatically calculates and displays the central Pivot Point along with three levels of support (S1, S2, S3) and resistance (R1, R2, R3) based on the previous day's data.
Gann Square of 9 Levels: Implements Gann's esoteric mathematical formula to find natural harmonic price levels, plotting the most significant static support and resistance zones for the day.
Fully Customizable Display: You have complete control over the indicator's appearance. From the settings menu, you can:
Toggle each set of levels on or off (e.g., show only the Pivot and S1/R1).
Change the line style (Solid, Dashed, Dotted).
Adjust the position of the price labels (Left or Right).
Set the line extension length.
On-Chart Information Table: A clean, non-intrusive table on the top-right of your chart displays the exact values of all key levels for quick reference.
Built-in Alerts: Set alerts for when the price crosses the main Pivot, R1, or S1 levels, so you never miss a potential trading opportunity.
Core Concepts Explained
Gann Pivot Point: Calculated as (High + Low + Close) / 3 from the previous day, this level represents the intraday "balance point." Trading above the pivot is generally considered bullish for the session, while trading below it is bearish.
Gann Square of 9: This is a more advanced Gann method based on the principle that prices move in a predictable way related to their square roots. This indicator calculates the most powerful "cardinal cross" levels, which often act as major reversal points.
How to Use This Indicator
Identify the Intraday Trend: Use the main Pivot Point as your guide. If the price is consistently holding above the pivot, look for buying opportunities. If it's holding below, look for shorting opportunities.
Look for Confluence: The most powerful signals occur when a Gann Pivot level lines up closely with a Square of 9 level. This "confluence" creates an extremely strong support or resistance zone.
Breakout Trading: When the price breaks decisively through a key level (e.g., R1), the next level above it (R2) becomes the logical price target.
Range Trading: In a sideways market, you can use the support and resistance levels as boundaries to trade between. Consider entering a long trade near a strong support level and taking profit near resistance.
Disclaimer: This indicator is for educational and informational purposes only. It does not constitute financial advice. Trading involves significant risk, and you should always conduct your own research and risk management before entering any trade.

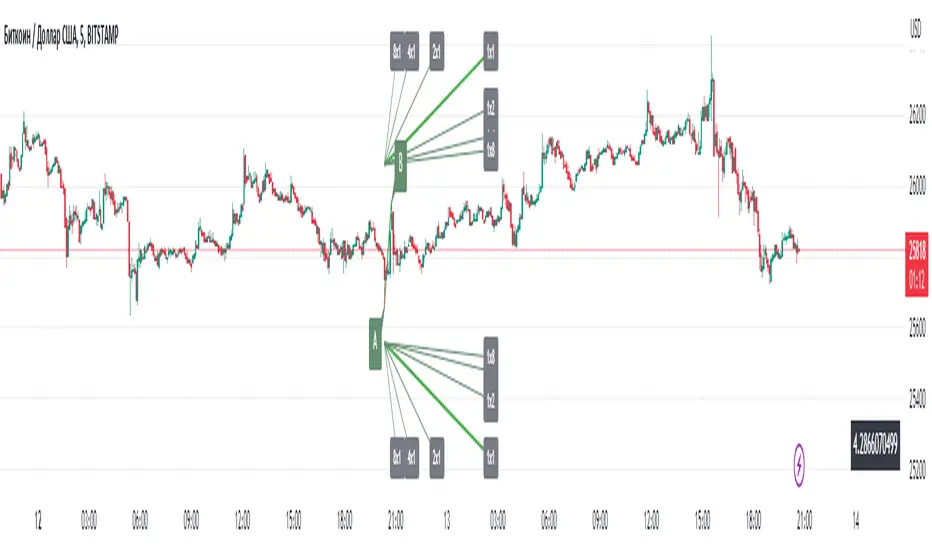
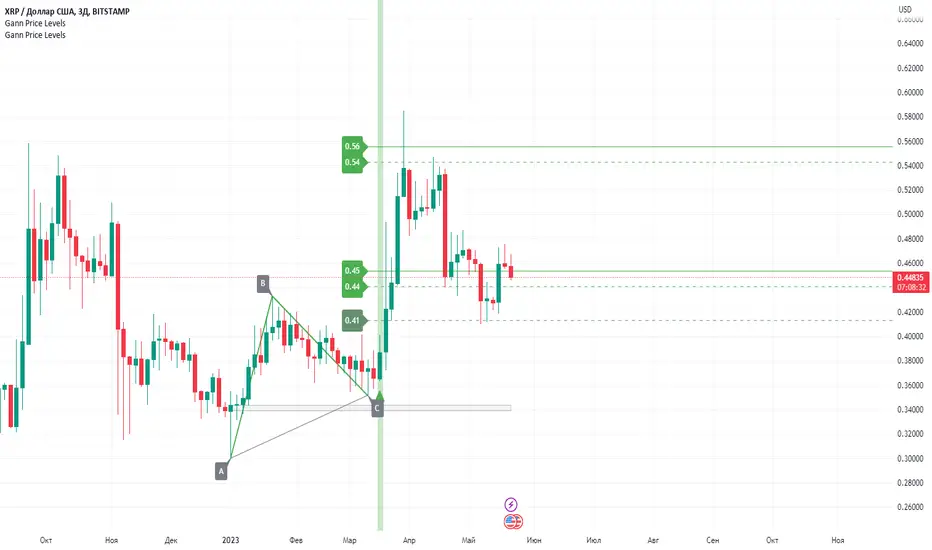
Gann Price LevelsGann Price Level is a powerful indicator based on the methods of the legendary trader William D. Gann. It provides traders with the ability to forecast future targets, both trending and retracement, based on just three anchor points and generates clear entry signals in the form of arrows. This indicator offers broad capabilities that assist traders in making informed decisions and optimizing their trading strategies. Here are a few key features of this indicator:
Calculation of future targets: Gann Price Level allows traders to determine potential price levels that may be reached in the future. It is based on the concept of geometric levels and numerical relationships, making it an effective tool for forecasting future price movements. Its algorithm incorporates geometry, mathematics, and Gann's angular relationships.
Three-point approach: One of the main advantages of Gann Price Level is its ability to work with only three anchor points. Traders need to specify three (ABC) points forming a triangle, and the indicator automatically calculates the target price levels. This simplifies the analysis process and makes it more intuitive.
Entry signals: In addition to forecasting target levels, Gann Price Level provides clear entry signals in the form of arrows. This helps traders identify optimal moments to enter positions, improving the accuracy of their trades.
Timeframes: Gann Price Level can be applied to various time intervals, including both short-term and long-term charts. This allows traders to adapt the indicator to their trading strategies and trade across different markets.
Versatility: Gann Price Level can be used to analyze various financial instruments, including stocks, forex, commodities, cryptocurrencies, and more. This makes it a versatile tool for traders operating in different market segments.
Another key feature of this indicator is the additional level calculation algorithm, which, when working with a trend, forms an optimal gray zone for forming point C, while when calculating retracement levels, it adds an additional magnetic target in the form of a gray zone.
Additionally, traders can combine this indicator with other indicators or chart patterns to obtain more accurate signals and confirmations. Moreover, Gann Price Level works effectively in both upward and downward trends, making it a flexible tool for traders of different trading styles. It can be used to determine potential support and resistance levels, as well as entry and exit points for positions.
Working with this indicator is straightforward. The user needs to select three (ABC) points forming a triangle, and the indicator will automatically calculate the future price targets. An entry arrow will also appear, enabling the user to enter the trade in a timely manner. The stop loss is placed slightly below point C (at the spread distance) for buy trades and above point C (at the spread distance) for sell trades. The first target is represented by a dashed line. Once this target is reached, a portion of the position (usually 50%) is closed, and the stop loss is moved to breakeven. The remaining part of the position is held until subsequent price levels based on personal preferences.
Construction rules:
When calculating targets in an upward trend, point A is below points BC, and point C is always between points AB.
When calculating targets in a downward trend, point A is above points BC, and point C is always between points AB.
When calculating retracement targets in an upward trend, point B is above points AC, point A is always between points BC, and point C is below AB.
When calculating retracement targets in a downward trend, point B is below points AC, point A is always between points BC, and point C is above AB.
This indicator relies entirely on the manual construction of the ABC points by the user.
Gann Swing Chart [One-Bar]"Gann used three types of swings chart.
One-Bar Swing Chart (1-Bar Swing Chart): The One-Bar Swing Chart, or Minor Trend Chart, follows the one-bar movements of the market. From a low price, each time the market makes a higher-high than the previous bar, a One-Bar trend line moves up from the recent low to the new high. This action makes the previous low price a One-Bar bottom. From a high price each time the market makes a lower-low than the previous bar, a One-Bar swing line moves down from the recent high to the new low. This action makes the previous high price a One-Bar top.
The combination of One-Bar tops and bottoms forms the One-Bar trend indicator chart. The crossing of a One-Bar swing top changes the One-Bar trend to up. The penetration of a One-Bar swing bottom changes the One-Bar trend to down."
This Indicator only show Gann Swing Chart use One-Bar type.

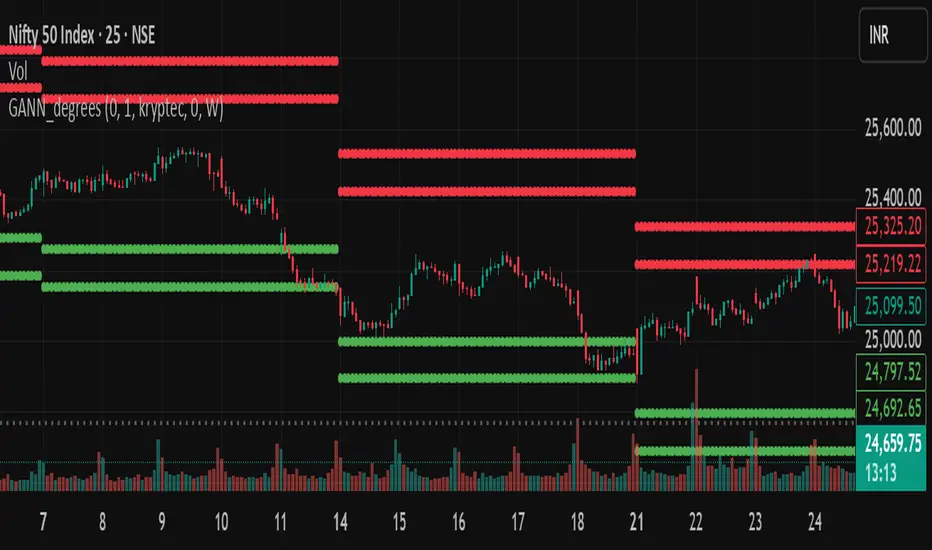
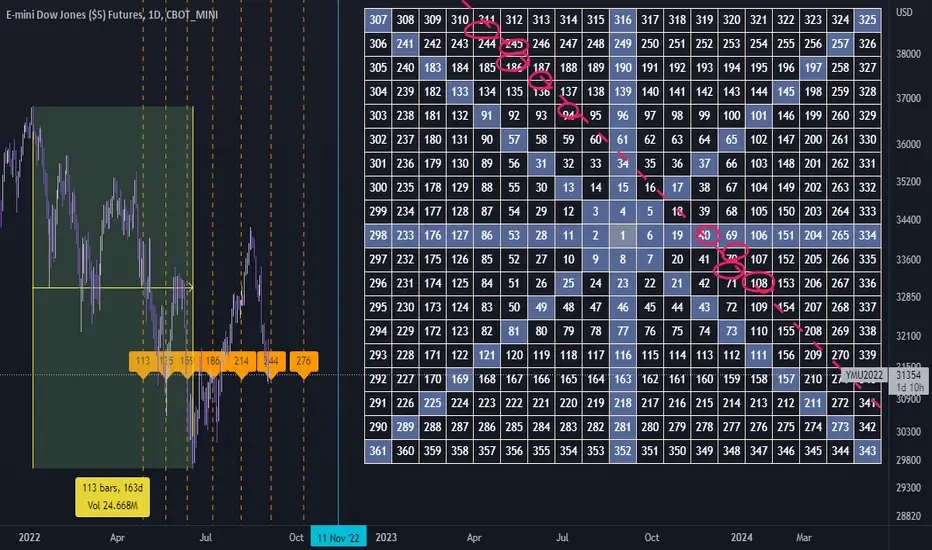
Gann Square of 9 cardinal cross and trinesGann Square of 9
This indicator is a powerful tool for traders who use W.D. Gann's methodologies to forecast potential support and resistance levels. It visualizes key price levels derived from the Gann Square of 9, a classic tool in technical analysis that relates price and time through geometric angles and rotations.
How It Works
The Gann Square of 9 is a spiral number chart where price moves in a clockwise spiral. Key angles on this square (such as 90°, 180°, 270°, and 360°) are used to identify price levels that act as magnets for future price action. This indicator automates that process by calculating these levels dynamically from a chosen pivot point.
Key Features
This script provides comprehensive and customizable functionality, including several unique enhancements:
Customizable Pivot Point: Choose your pivot price source from various options, including open, high, low, close, hl2, hlc3, ohlc4, and kryptec.
Dynamic Pivot Updates: The indicator can automatically reset its pivot price at the beginning of a new period (e.g., a new day, week, or month), allowing the levels to adapt to recent market changes.
Fixed Pivot Option: To prevent the indicator from changing when you scroll through historical data, you can choose to use a fixed pivot price. This anchors the levels to a specific value, ensuring they remain constant regardless of the visible chart range.
Extended Gann Angles: In addition to the traditional 90°, 180°, and 270° levels, this script also includes the 120° and 240° angles for more granular analysis of potential turning points.
Multiplier and Rotations: Fine-tune the distance between the Gann levels with the multiplier input. The rotations parameter allows you to raise or lower the entire set of levels by one or more 360° rotations, adapting the indicator to different price ranges.
How to Use
Choose Your Pivot: The indicator's levels are all based on a single pivot price.
For a static analysis, enable "Use Fixed Pivot Price?" and enter a specific price you want to anchor your analysis to.
For a dynamic analysis, select your desired "Resolution" (e.g., 'W' for weekly) and the pivot price will be set based on the previous period's data.
Adjust Rotations: Use the rotations input to shift the entire set of levels up or down until they align with a significant support or resistance area on your chart.
Analyze Levels: The plotted lines represent potential support and resistance zones. A price move through one level may target the next one in the sequence.
Disclaimer: This indicator is a tool for technical analysis and should not be considered financial advice. Past performance of these levels does not guarantee future results. Always use proper risk management and conduct your own research before making any trading decisions.
Gann Octave 8 - Professional V 1.0Gann Octave 8 Indicator:
Core Concept: This indicator divides the price range between highest high and lowest low into 8 equal parts (octaves), creating support/resistance levels based on W.D. Gann's trading principles.
Key Components:
1. Price Range Calculation:
o Finds highest high and lowest low over a lookback period (default 50 bars)
o Divides this range into 8 equal segments (12.5% each)
2. 8 Octave Levels:
o 0% (Low Support) - Strongest support
o 12.5%, 25%, 37.5% - Minor levels
o 50% (CRITICAL) - Most important level
o 62.5%, 75%, 87.5% - Minor levels
o 100% (High Resistance) - Strongest resistance
3. Gann Angles: Projects trend lines from high/low points at various angles (1x1, 2x1, 1x2, etc.)
4. Visual Features:
o Color-coded levels
o Information table showing current position
o Background highlighting when near critical levels
o Trend analysis (bullish/bearish zones)
Trading Strategy
Entry Signals:
BULLISH TRADES:
• Price crosses above 50% level → Strong buy signal
• Price bounces from 25% or 37.5% levels → Support bounce
• Price in upper zone (above 50%) → Bullish bias
BEARISH TRADES:
• Price crosses below 50% level → Strong sell signal
• Price rejects at 75% or 87.5% levels → Resistance rejection
• Price in lower zone (below 50%) → Bearish bias
Key Trading Rules:
1. 50% Level is Critical: Most important for trend direction
2. Zone Trading:
o Above 50% = Bullish zone (look for longs)
o Below 50% = Bearish zone (look for shorts)
3. Strength Levels:
o Above 75% or below 25% = Strong moves
o Near 100% (high) or 0% (low) = Extreme levels
Risk Management:
• Stop Loss: Place below previous octave level
• Take Profit: Target next octave level
• Position Size: Reduce size near extreme levels (0%, 100%)
Example Trade:
If price breaks above 50% level:
• Entry: Long position
• Stop: Below 37.5% level
• Target: 75% level
• Risk: Monitor for rejection at resistance levels
The indicator works best in trending markets and helps identify high-probability reversal zones.
Works for both Stocks & Derivatives. Experiment with code and share your feedback in comments..

Gann Price Angles & Star | Lawerence 2020 @cryptobandy.v2.0This indicator is basically intended for traders who is looking for building trading setup based on Gann theories and price angles.
By given the start price, either top or bottom, It shows:
- Several price cycles based on the chosen spacing.
- All possible values for spacing to facilitate the process and pick up values as needed.
- Provide the time angle levels based on the given price and spacing.
- Draw Gann Star based on the entered price either is top or bottom.
- All lines' color are customizable you can choose what works best for your layout.
- All features are customizable, you can show or hide any options as prefer.
- Ability to deal with decimal prices and values in satoshis by choosing the multiplier option to reverse the spacing.
- The indicator works on any market, just need to adjust the available options such as spacing, breaking level, and pullback price angle.
Good luck!
All next updates and future releases will be published here as well.


Gann Levels 360
This indicator plots a series of horizontal lines on a chart based on pre-defined levels and the current market price. These levels are believed to be significant for potential support and resistance zones according to the Gann trading methodology.
This code defines a custom indicator that plots a set of Gann levels and dynamically adjusts them based on the current market price. Users can change the line color through the input option.

GANN Square Of 9 PivotsGANN Square Of 9 Pivots
How to use for Intraday ?
Method 01 (From 9:05 am to 9:15 am or pre-open market)
Take the Weighted Average Price or Volume Weighted Average Price (VWAP) or Time Weighted Average Price (TWAP) of any stock or index.
You can use TWAP for Index as volume is not available.
Method 02 (From 9:05 am to 9:15 am or pre-open market)
Take the Last Traded Price (LTP) of index or stock
Method 03 (After 9:30 am or after 1st 15 min)
Only take Last Traded Price (LTP) of stock or index
Ideal Time
15min to 1hr after market opens
Indicator Features
Lines
Gray Dashed Line: Calculation Price
Teal Solid Line: Long Above
Red Solid Line: Short Below
3 Teal Dotted Lines: Bullish Targets 1, 2 & 3
3 Red Dotted Lines: Bearish Targets 1, 2 & 3
Labels
1st Numbers: Price
2nd Numbers in (): % change from LTP to that Level
For Index
As VWAP is not available for Index, TWAP (Time Weighted Average Price) values can be used for Index.
Custom Price Inputs
Price of your choice can be given manually by selecting:
Source > Custom
Enter Price > (type the price)
Timeframe
Higher timeframes like Weekly, Monthly can be changed using Timeframe Option
For More Reading
Reading: traderji.com/community/threads/intraday-trading-using-gann-calculator.39185/#post-419677
Calculator: stockmaniacs.net/freebies/free-tools/gann-square-of-9-calculator/

Gann Intraday Retracement Levels, by PVSharmaOne of the greatest technical analyst the world has seen, was The Legendary William Delbert Gann. He had simple, creative principles based on astronomical computations. Although he wasn't an intraday trader, his theories produced outcomes that are just as impressive as delivery trading.
On the basis of his approach, I have created an indicator based on intraday trades that offers high profits at extremely brief stop-losses.
This indicator has been well evaluated, and I can declare with confidence that its excellent performance are based on "buy at dip and sell on peak" principle. Although this indicator has been tested, it does not perform well enough in some instruments, such as Forex, some cryptocurrencies, and a few international commodities.
Please take note that this indicator is excellent for speculating on NSE indexes and is applicable to practically all NSE instruments (apart from Forex). I'm also working on several errors, that I plan to remedy and present to you in the near future

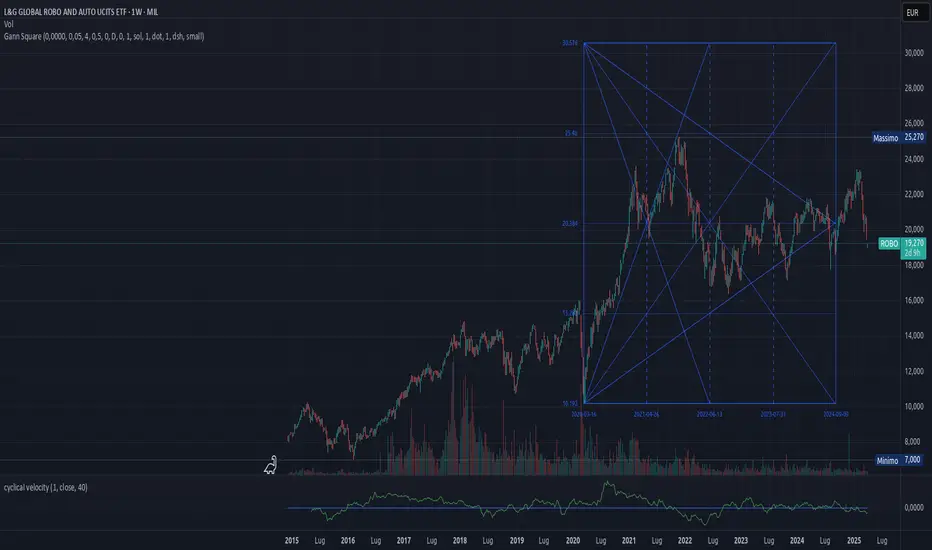
Gann Box (Zeiierman)█ Overview
The Gann Box (Zeiierman) is an indicator that provides visual insights using the principles of W.D. Gann's trading methods. Gann's techniques are based on geometry, astronomy, and astrology, and are used to predict important price levels and market trends. This indicator helps traders identify potential support and resistance levels, and forecast future price movements.
Gann used angles and various geometric constructions to divide time and price into proportionate parts. Gann indicators are often used to predict areas of support and resistance, key tops and bottoms, and future price moves.
█ How It Works
The indicator operates by identifying high and low points within a visible range on the chart and drawing a Gann Box between these points. The box is divided into segments based on selected percentages, which represent key levels for observing market reactions. It includes options to display labels, a Gann fan, and Gann angles for analysis. Advanced features allow extending the box into the future for predictive analysis and reversing its orientation for alternative viewpoints.
High and Low Points Identification: It starts by locating the highest and lowest price points visible on the chart.
Gann Box Construction: Draws a box from these points and divides it according to specified percentages, highlighting potential support and resistance levels.
█ How to Use
Support and Resistance Levels
Using a Gann angle to forecast support and resistance is probably the most popular way they are used. This technique frames the market, allowing the analyst to read the movement of the market inside this framework.
The lines within the Gann Box, drawn at the key percentages, create a grid of potential support and resistance levels. As prices fluctuate, these lines can act as barriers to price movement, with the price often pausing or reversing at these intervals.
Forecasting with the 'Extend' Feature: The indicator's ability to extend lines and boxes into the future provides traders with a forward-looking tool to anticipate potential market movements and prepare for them.
Gann Fan: This feature draws lines at a significant price angle, helping traders identify potential support and resistance levels based on the theory that prices move in predictable patterns.
Gann Curves: Gann Curves display dynamic support and resistance levels, aiding in the analysis of momentum and trend strength.
█ Settings
The indicator includes several settings that allow customization of its appearance and functionality:
⚪ General Settings
Reverse: This setting changes the orientation of labels and calculations within the Gann Box, providing alternative analytical perspectives. It essentially flips the Gann Box's direction, which can be useful in different market conditions or analysis scenarios.
Extend: Extends the drawing of Gann lines or boxes into the future beyond the current last bar. This feature is essential for forecasting future price movements and identifying potential support or resistance levels that lie outside the current price action.
⚪ Gann Box
Show Box: Toggles the visibility of the Gann Box on the chart. The Gann Box is a fundamental tool in Gann analysis, highlighting key levels based on selected high and low points to identify potential support and resistance areas.
Show Fibonacci Labels: Controls the display of Fibonacci labels within the Gann Box. These labels mark specific Fibonacci retracement levels, aiding traders in recognizing significant levels for potential reversals.
Box Visibility: Allows users to enable or disable individual boxes within the Gann Box, providing flexibility in focusing on specific levels of interest.
Percentage Levels: Defines the Fibonacci levels within the Gann Box. Traders can adjust these levels to customize the Gann Box according to their specific analysis needs.
Coloring: Customizes the color of each level within the Gann Box, enhancing visual clarity and differentiation between levels.
⚪ Gann Fan
Show Fan: Enables the Gann Fan, which draws lines at significant Gann angles from a particular point on the chart, helping identify potential support and resistance levels.
Fan Percentages and Coloring: Similar to the Gann Box, these settings allow traders to customize which Gann angles are displayed and how they are colored.
⚪ Gann Curves
Show Curves: When enabled, this setting draws Gann Curves on the chart. These curves are based on Gann percentages and provide a dynamic view of support and resistance levels as they adapt to changing market conditions.
Curve Percentages and Coloring: Define which curves are displayed and their colors, allowing for a tailored analysis experience.
⚪ Gann Angles
Show Angles: Toggles the display of Gann Angles, which are crucial for understanding the market's price and time dynamics, offering insights into future support and resistance levels.
Coloring: Customizes the color of the Gann Angles, making it easier to differentiate between various angles on the chart.
█ Alerts
The indicator includes several alert conditions for price breakouts from the Gann Box and specific levels, enabling traders to be notified of significant market movements.
-----------------
Disclaimer
The information contained in my Scripts/Indicators/Ideas/Algos/Systems does not constitute financial advice or a solicitation to buy or sell any securities of any type. I will not accept liability for any loss or damage, including without limitation any loss of profit, which may arise directly or indirectly from the use of or reliance on such information.
All investments involve risk, and the past performance of a security, industry, sector, market, financial product, trading strategy, backtest, or individual's trading does not guarantee future results or returns. Investors are fully responsible for any investment decisions they make. Such decisions should be based solely on an evaluation of their financial circumstances, investment objectives, risk tolerance, and liquidity needs.
My Scripts/Indicators/Ideas/Algos/Systems are only for educational purposes!

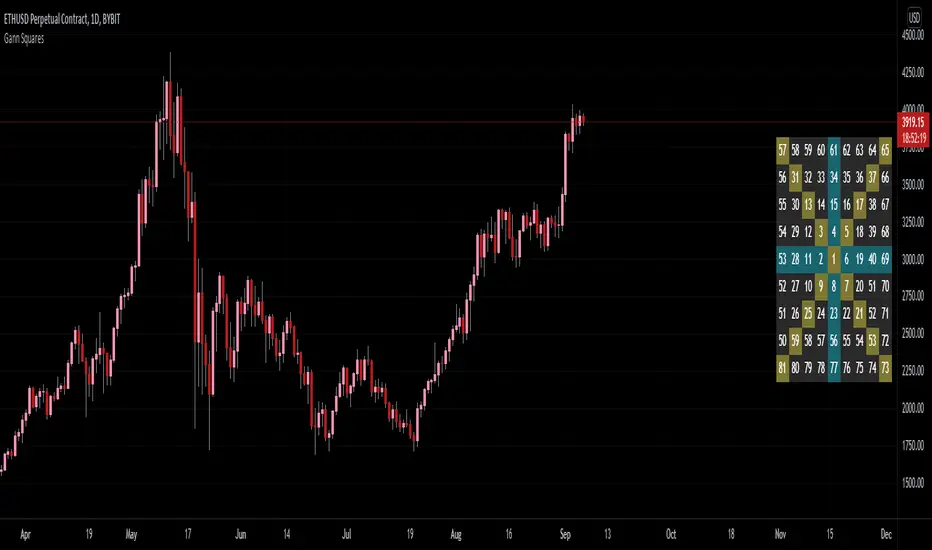
Gann Square of 9Gann's Square's are some of the best known tools created by Gann. His most well known square was his Square of 9.
The reason for this was because of the symmetry 9 had with itself. Gann was able to balance both price and time with this symmetry.
- 9 is the last single-digit and largest number
- You can add anything to 9 and it will give you a natural number
- (9 + 3 = 12); 1 + 2 = 3... (9 + 9 = 18); 1 + 8 = 9... etc.
- Multiplying any number by 9 will have the natural number be 9
- (9 * 6 = 54); 5 + 4 = 9... (9 * 3 = 27); 2 + 7 = 9... etc.
For these reason, Gann claimed that 9 has everything within itself.
Here I have created an on-chart square of 9 including the cardinal and ordinal cross points colored. In the settings you are able to customize the starting value of the table as well as the period movement. In most cases, 81 is not high enough to be useful in charting cases, so I'd recommend printing out your own Gann Square of 9 that goes as high as you need it to go.
THIS IS NOT TRADING ADVICE ; please use your own technical analysis before making any decisions based off of public indicators. Learn more about Gann's Squares before attempting to use them as this script was not meant to give you answers, only the table.
Gann Seasonal Dates V1.1Gann Seasonal Dates
// ========================================================================//
This script helps you spot important events in the market using Gann seasonal dates and cycles
This script inludes 4 major seasonal dates and 6 minor seasonal dates. All of which are very powerful if you are a time trader.
This script also complements the Gann ToolBox that I have on my tradingview page giving you good measurement of the market and some of its volatility dates.
// ========================================================================//
To get access to this add-on or for the full package including the toolbox you can see my information below.

gannoddsquare levels from DAY high lowGann Square of 9
Odd square to odd square
Start is auto chosen based upon :
day_close greater than day_open
then start equals day_low
or
day_close less than day_open
then start equals to day_high
Gap == 4 then distance is odd to odd square, Example = 121 -169 , 169-225,...
If Gap is increased to 8 then distance will be double the odd square, Example = 121 -225, 225-289,...,
- 1 odd square distance has been filled with purple background
- total 16 targets
-Any doubt feel free to ask.

Gann Square This indicator build by Gann Square of 19.
you select start and end of big trend in daily timeframe and calculate date range.
by draw trend line in Gann square and enter the numbers cross by line in settings input you could recognize future pivot points
remember : first) this tool worked only in daily timeframe. second) better using this in dark theme :)
chart example :
Gann Spiral / Square of 9The Gann Spiral, more commonly known as the Square of 9 is one of the most well known tools that Gann used. Today, it is most commonly used to find possible support and resistance levels, and possible reversals in time.
This indicator is a more flexible version of the traditional Gann Spiral / Square. This is achieved by allowing you to change:
Price and Time direction
The timeframe
How often to draw lines based on degrees
Toggles for Price and Time
Price and Time line customization
How to use:
1 - Select your desired starting value of Price and Time.
2 - Choose the direction of Price and Time.
3 - Choose the amount of lines to display.
4 - Choose how often for lines to be drawn (Rotation Degree Value).
==================================================================
Side Note:
This uses a more proper and more accurate formula to "navigate the square". (Sqr x + 2)^2 is not the formula used, but rather (Sqr x + 1)^2.
If you wish to use the formula you're used to, change Full Revolution Value to 180.
The reasoning behind this formula change is because I re-created the square in the form of an actual spiral. The issue with such a conversion is that the formula used to construct it uses one Pi. If you understand circles, you should know that we're off by 180 degrees. A full rotation is 360, not 180.
Correcting for this error requires a slight but important change in the formula, that being +1 instead of +2. This not only corrects it to fit for a proper spiral, but also makes it easier to use fractions. 1/360 results in 1 degree. This slight formula change makes it incompatible when used on the actual Square of 9, however it is technically the more accurate formula.

Gann SquareIntroduction
Legendary trader W.D. Gann illuminated the cyclical nature of financial markets, revealing their adherence to predictable patterns rooted in geometry, astronomy, and numerology. With his own trading results as evidence, Gweaklann showcased the efficacy of these principles in uncovering market dynamics, including breakouts, reversals, and crucial price levels acting as support and resistance.
Introducing Gann Square
Gann Square, also known as the Gann Box, stands as a cornerstone of technical analysis, offering traders a powerful tool to decipher market movements and anticipate future price action. Built upon primary angles, notably the 45-degree (1x1 angle) ascending from the origin to the top-right corner and its corresponding negative angle descending from the top-right to the bottom-left corner, Gann Square epitomizes precision and foresight in chart analysis.
Unveiling Points of Setup
Central to Gann Square's functionality is the identification of points of setup. These critical junctures mark significant highs or lows in price movements, serving as pivotal reference points for traders seeking to navigate market shifts and capitalize on emerging opportunities.
Time scale: Calendar or Trading days
A lot of effort was spent to realize a precise relationship between time and price, as angles of price arise with time or with chart bars. The best of these two options is related to the type of instrument used, and is usually could be determines empirically.
For example, consider a ticker that is at market five days per week. By using TradingDays we have a match between candles on the chart and days as time, so the angle arises in a linear way. Instead of using Calendar option, from Monday to Monday we have 7 days, and the algorithm takes care of this and the angle arise faster. Look at the pictures below, with Calendar option there's a little step every time there is day's jump between consecutive candles.
Same square on TradingDays and Calendar
Timeframe independence
In Gann analysis, the correlation between angles and time periods is inherently cyclical, where each degree corresponds to approximately one day, and a full circle of 360 degrees symbolizes a year. This timeless relationship allows Gann indicators to transcend individual timeframes, ensuring consistency while preserving the critical balance between time and price dynamics.
Gann indicators operate seamlessly across multiple timeframes, yet they remain steadfastly anchored to the daily timeframe as the primary reference point. This deliberate choice maintains the integrity of the time-price relationship, essential for accurate analysis and interpretation.
Preserving Proportion Amidst Time Shifts
When an angle intersects a pivot point during a timeframe transition, the Gann indicator upholds its proportional integrity without compromise. Whether examining daily, weekly, or monthly intervals, the indicator seamlessly aligns with pivotal price levels, ensuring continuity and precision in analysis.
Illustrating Consistency in Practice
Visualize the power of timeframe independence through a single Gann fan spanning both daily and weekly intervals. Witness how each angle touches the same pivotal point, meticulously maintaining proportionality across varying timeframes, as depicted in the accompanying illustration.
Same square on daily and weekly
Intraday daily and hourly
Handle TradingView bounds
By placing a square at the limits of the chart you risk going beyond the limits of the TradingView drawable area which is 500 bars in the future. In this case the indicator manages this eventuality by truncating the drawing and trying to calculate the theoretical measurement anyway to draw the angles inside it. This leads to having a square with some geometric errors but still allows you to proceed with the analysis.
Summary of features
Automatic price placement: the indicator look at the trend and decide autonomously if angle starts from candle low or high;
Manual price placement: it's possible to disable automatic placement and specify a start price;
Angle extension to present: draw angle until last available bar;
Extension to future: draw angle and square in the future after the latest available bar ( actual TradingView limit is 500 bars in the future );
Multiple timeframe are supported ( more details below);
Trading days: time is considered in number of bars, for example the ticker AAPL usually has 5 daily bars per week;
Calendar: time is considered in number of days, for example the ticker AAPL usually has 7 days per week;
Future bars: It's possible to draw until 500 bars after the latest ( TradingView bound);
Square over bound handling (explained above);
Operating Instructions
Placing the Gann Square on the chart
When positioning the Gann Square, ensure that the positive square is placed on an important pivot low, while the negative angle should be positioned on a pivot high. By default, the script automatically selects the pivot price based on the trend of the previous candle. However, it's important to note that automatic price selection may not always be accurate, especially in certain market conditions. In such cases, users have the option to manually specify the pivot price.
Exercise caution when using automatic price selection in conjunction with changing timeframes. For instance, the pivot low of a monthly candle may not align perfectly with a daily candle. In such scenarios, it is advisable to either opt for manual price selection or initially place the indicator using the daily timeframe before switching to a wider timeframe, such as monthly.
In intraday trading, transitioning to a daily or wider timeframe while maintaining angle proportionality between timeframes may pose challenges with automatic price selection. In this particular scenario, it is recommended to utilize manual price selection for accuracy.
Furthermore, it's beneficial to differentiate between intraday operations and daily or longer-term operations when utilizing the Gann Square, as each may require distinct considerations and approaches for optimal effectiveness.
Price unit, Factor and divisor
The size of the Gann Square can be customized using the following settings:
Price Unit (Scale) : The Price Unit, also known as the scale, determines the increment along the main angle (45°) of the Gann Square. Adjusting the Price Unit allows you to fine-tune the relationship between price and time, enabling the adaptation of the square to suit the characteristics of any financial instrument.
Factor : The Factor setting provides additional flexibility in adjusting the scale of the Gann Square. By modifying the Factor, you can further refine the proportions of the square to align with specific trading strategies or market conditions.
Divisor : The Divisor setting enables you to divide the square size by a specified factor (e.g., 2, 4, etc.). This feature offers a convenient way to adjust the size of the square while maintaining proportionality and symmetry, enhancing the versatility of the Gann Square tool.
By utilizing these settings in combination, traders can effectively tailor the Gann Square to their preferences and requirements, empowering them to conduct detailed technical analysis and make informed trading decisions across various financial instruments and market environments.
Point of setup
The Gann Square provides settings to divide the square by vertical lines, allowing for enhanced analysis and identification of key points of setup. Users can choose to divide the square by four, by three, or both, providing flexibility in their analysis approach.
Utilizing Vertical Lines
These vertical lines play a crucial role in identifying important candles, price levels, and time intervals where trend reversals or significant market movements may occur. By dividing the square into smaller sections, traders can pinpoint potential areas of interest with greater precision.
Intersection of Angles
The points of setup identified by the vertical lines also correspond to the intersection of various angles drawn on the square. These intersections serve as focal points for analysis, indicating potential shifts in market dynamics and offering valuable insights into future price movements.
By leveraging the point of setup settings and paying attention to the intersection of angles, traders can enhance their understanding of market trends and make more informed trading decisions.
Setting examples
NQ1! (D, W):
price unit: 4, 8
Factor: 1
Square Division: 1
CL1! (D, W):
price unit: 0.5
Factor: 8
Square Division: 0.25
BTCUSD (4h):
price unit: 512
Factor: 1
Square Division: 4
WARNING
This indicator is for educational purpose only. I am in no way responsible for bad setups, strategies and possible losses or gains of money as a result!
Gann Single Square Swing Trading System with Gann AnglesGann Single Square Swing Trading System
This script automatically detects "squares" - geometric patterns where price movement equals time movement. When price moves the same distance as the number of bars (time), it creates powerful support/resistance levels based on Gann theory.
Key Visual Elements
• Box: The detected square pattern
• Dark Blue Line (50%): Most important trading level
• Green Lines: Profit target levels (125%, 150%)
• Red Lines: Stop loss levels (-25%, -50%)
• Colored Angle Lines: Gann angles for trend direction
• Quality Score: Blue label showing setup strength (aim for 70%+)
Simple Trading Rules
LONG Trades (Green 🟢 Square)
1. Entry: Buy when price touches the dark blue 50% line from above
2. Stop Loss: Place below the red -25% line
3. Take Profit: Exit at green 125% line (first target) or 150% line (second target)
SHORT Trades (Red 🔴 Square)
1. Entry: Sell when price touches the dark blue 50% line from below
2. Stop Loss: Place above the red -25% line
3. Take Profit: Exit at green 125% line (first target) or 150% line (second target)
Entry Checklist
✅ Square quality score > 70%
✅ Price touches 50% level (dark blue line)
✅ Volume above average (if volume filter enabled)
✅ Clear square formation visible
Alerts
The script generates automatic alerts when price reaches the 50% trading level. Enable alerts in TradingView to get notified of setups.
Bottom Line: Wait for the alert → Check quality score → Enter at 50% level → Set stop at red line → Take profit at green line.

Gann Bursa Malaysia Ver1Gann Square of 9 is a spiral of numbers starting with the number one in the center.
The numbers spiral around the center in a clockwise manner to the number 9, which completes the first cycle around the center.
Square of 9 Wheel is one of the popular market tools of legendary trader W.D. Gann
Based on Gann Square of 9, this indicator automatically plot the lines which act as support and resistance .
Red Line - very strong support/resistance
Blue Line - strong support/resistance
Notes :
These indicator only suitable for Bursa Malaysia.
Currently Only Cover Price Range( RM ) from 0.020 - 2.50

Gann High LowGann High Low is a moving average based trend indicator consisting of two different simple moving averages.
The Gann High Low Activator Indicator was described by Robert Krausz in a 1998 issue of Stocks & Commodities Magazine. It is a simple moving average SMA of the previous n period's highs or lows.
The indicator tracks both curves (of the highs and the lows). The close of the bar defines which of the two gets plotted.
This version is showing the channel that needs to be broken if the trend is going to be changed, and it allows you to chose from the 4 basic averages type for calculation (by definition, Gann High Low Activator uses only simple moving average, but some other averages can give you results that are probably more acceptable for trading in some conditions).
Increasing HPeriod and decreasing LPeriod better for short trades, vice versa for long positions.

Gann Square of 9Understanding the Gann Square of 9
Delve into the fascinating realm of W.D. Gann’s Square of 9, a tool that has intrigued traders for generations. As we explore the insights behind this unique structure, we’ll show you how our Gann Square of 9 Indicator can become a valuable asset in your trading toolkit.
The History of the Gann Square of 9
The story behind the Gann Square of 9 is as fascinating as the man who created it. W.D. Gann, a pioneering trader from the early 20th century, introduced a method that highlighted the connection between time and price. Rooted in ancient mathematics and geometry, Gann’s theory suggests that financial markets follow cyclical patterns, which are captured in the design of the Square of 9.
Core Principles of the Gann Square of 9
At its heart, the Gann Square of 9 is based on a numerical system that spirals outward from a central point. This unique arrangement allows traders to identify potential support and resistance levels in the market. Each number represents a possible pivot point, indicating shifts in market direction, aligned with Gann’s time-price equilibrium theory.
Applying the Gann Square in Market Analysis
The strength of the Gann Square of 9 lies in its ability to predict key moments in the market where significant price movements may occur. By utilizing our Gann Square of 9 Indicator, traders can easily pinpoint these crucial points, applying Gann’s principles to anticipate both market highs and lows. This section will guide you through practical applications of the Gann Square for making both short-term and long-term trading decisions.
Market Timing with the Gann Square of 9 Indicator
Unlock the potential of market timing and price prediction using our Gann Square of 9 Indicator. This versatile tool brings Gann’s trading insights into the modern world of finance. Here, you’ll find a detailed walkthrough on how to use the indicator to enhance your trading strategies.
Step-by-Step Guide
Input the Source Price: Open, High, Low, Close on specific Timeframe.
Set the Pip Value: Adjust the pip value according to the scale of your trades. The pip value helps define the precision of the price levels the calculator will generate.
Analyze Results: The generated grid displays a central value (your input price) surrounded by numbers representing possible support and resistance levels.
Use the Support and Resistance Levels: Below the grid, you’ll find specific support and resistance points. These are key price levels that can help you plan your trading strategy, such as entry or exit points.
Apply Gann's Trading Entries: At the bottom, suggested long and short trade entries, with targets and stop-loss levels, giving you essential tools for managing risk effectively.
By following these steps, you can effectively incorporate Gann’s time-tested techniques into modern market analysis. Our Gann Square of 9 Indicator simplifies complex calculations while offering powerful insights, helping you make informed trading decisions rooted in one of market analysis’s most influential theories.
Whether you’re new to Gann’s approach or a seasoned trader, this indicator is designed to provide valuable insights aligned with Gann’s original concepts while delivering a seamless user experience for today’s traders. With just a few clicks, you can transform market data into a geometric pattern of time and price, setting the stage for strategic trading based on the cyclical nature of financial markets.
