Gann Square
Legendary trader W.D. Gann illuminated the cyclical nature of financial markets, revealing their adherence to predictable patterns rooted in geometry, astronomy, and numerology. With his own trading results as evidence, Gweaklann showcased the efficacy of these principles in uncovering market dynamics, including breakouts, reversals, and crucial price levels acting as support and resistance.
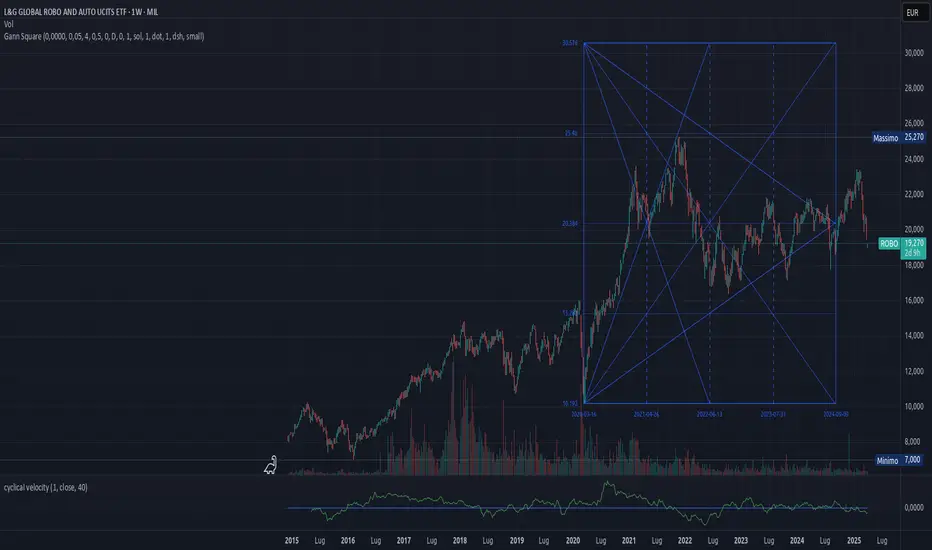
Introducing Gann Square
Gann Square, also known as the Gann Box, stands as a cornerstone of technical analysis, offering traders a powerful tool to decipher market movements and anticipate future price action. Built upon primary angles, notably the 45-degree (1x1 angle) ascending from the origin to the top-right corner and its corresponding negative angle descending from the top-right to the bottom-left corner, Gann Square epitomizes precision and foresight in chart analysis.
Unveiling Points of Setup
Central to Gann Square's functionality is the identification of points of setup. These critical junctures mark significant highs or lows in price movements, serving as pivotal reference points for traders seeking to navigate market shifts and capitalize on emerging opportunities.
Time scale: Calendar or Trading days
A lot of effort was spent to realize a precise relationship between time and price, as angles of price arise with time or with chart bars. The best of these two options is related to the type of instrument used, and is usually could be determines empirically.
For example, consider a ticker that is at market five days per week. By using TradingDays we have a match between candles on the chart and days as time, so the angle arises in a linear way. Instead of using Calendar option, from Monday to Monday we have 7 days, and the algorithm takes care of this and the angle arise faster. Look at the pictures below, with Calendar option there's a little step every time there is day's jump between consecutive candles.
Same square on TradingDays and Calendar
Timeframe independence
In Gann analysis, the correlation between angles and time periods is inherently cyclical, where each degree corresponds to approximately one day, and a full circle of 360 degrees symbolizes a year. This timeless relationship allows Gann indicators to transcend individual timeframes, ensuring consistency while preserving the critical balance between time and price dynamics.
Gann indicators operate seamlessly across multiple timeframes, yet they remain steadfastly anchored to the daily timeframe as the primary reference point. This deliberate choice maintains the integrity of the time-price relationship, essential for accurate analysis and interpretation.
Preserving Proportion Amidst Time Shifts
When an angle intersects a pivot point during a timeframe transition, the Gann indicator upholds its proportional integrity without compromise. Whether examining daily, weekly, or monthly intervals, the indicator seamlessly aligns with pivotal price levels, ensuring continuity and precision in analysis.
Illustrating Consistency in Practice
Visualize the power of timeframe independence through a single Gann fan spanning both daily and weekly intervals. Witness how each angle touches the same pivotal point, meticulously maintaining proportionality across varying timeframes, as depicted in the accompanying illustration.
Same square on daily and weekly
Intraday daily and hourly
Handle TradingView bounds
By placing a square at the limits of the chart you risk going beyond the limits of the TradingView drawable area which is 500 bars in the future. In this case the indicator manages this eventuality by truncating the drawing and trying to calculate the theoretical measurement anyway to draw the angles inside it. This leads to having a square with some geometric errors but still allows you to proceed with the analysis.
Summary of features
- Automatic price placement: the indicator look at the trend and decide autonomously if angle starts from candle low or high;
- Manual price placement: it's possible to disable automatic placement and specify a start price;
- Angle extension to present: draw angle until last available bar;
- Extension to future: draw angle and square in the future after the latest available bar ( actual TradingView limit is 500 bars in the future );
- Multiple timeframe are supported ( more details below);
- Trading days: time is considered in number of bars, for example the ticker AAPL usually has 5 daily bars per week;
- Calendar: time is considered in number of days, for example the ticker AAPL usually has 7 days per week;
- Future bars: It's possible to draw until 500 bars after the latest ( TradingView bound);
- Square over bound handling (explained above);
Operating Instructions
Placing the Gann Square on the chart
When positioning the Gann Square, ensure that the positive square is placed on an important pivot low, while the negative angle should be positioned on a pivot high. By default, the script automatically selects the pivot price based on the trend of the previous candle. However, it's important to note that automatic price selection may not always be accurate, especially in certain market conditions. In such cases, users have the option to manually specify the pivot price.
Exercise caution when using automatic price selection in conjunction with changing timeframes. For instance, the pivot low of a monthly candle may not align perfectly with a daily candle. In such scenarios, it is advisable to either opt for manual price selection or initially place the indicator using the daily timeframe before switching to a wider timeframe, such as monthly.
In intraday trading, transitioning to a daily or wider timeframe while maintaining angle proportionality between timeframes may pose challenges with automatic price selection. In this particular scenario, it is recommended to utilize manual price selection for accuracy.
Furthermore, it's beneficial to differentiate between intraday operations and daily or longer-term operations when utilizing the Gann Square, as each may require distinct considerations and approaches for optimal effectiveness.
Price unit, Factor and divisor
The size of the Gann Square can be customized using the following settings:
- Price Unit (Scale): The Price Unit, also known as the scale, determines the increment along the main angle (45°) of the Gann Square. Adjusting the Price Unit allows you to fine-tune the relationship between price and time, enabling the adaptation of the square to suit the characteristics of any financial instrument.
- Factor: The Factor setting provides additional flexibility in adjusting the scale of the Gann Square. By modifying the Factor, you can further refine the proportions of the square to align with specific trading strategies or market conditions.
- Divisor: The Divisor setting enables you to divide the square size by a specified factor (e.g., 2, 4, etc.). This feature offers a convenient way to adjust the size of the square while maintaining proportionality and symmetry, enhancing the versatility of the Gann Square tool.
By utilizing these settings in combination, traders can effectively tailor the Gann Square to their preferences and requirements, empowering them to conduct detailed technical analysis and make informed trading decisions across various financial instruments and market environments.
Point of setup
The Gann Square provides settings to divide the square by vertical lines, allowing for enhanced analysis and identification of key points of setup. Users can choose to divide the square by four, by three, or both, providing flexibility in their analysis approach.
Utilizing Vertical Lines
These vertical lines play a crucial role in identifying important candles, price levels, and time intervals where trend reversals or significant market movements may occur. By dividing the square into smaller sections, traders can pinpoint potential areas of interest with greater precision.
Intersection of Angles
The points of setup identified by the vertical lines also correspond to the intersection of various angles drawn on the square. These intersections serve as focal points for analysis, indicating potential shifts in market dynamics and offering valuable insights into future price movements.
By leveraging the point of setup settings and paying attention to the intersection of angles, traders can enhance their understanding of market trends and make more informed trading decisions.
Setting examples
- NQ1! (D, W):
price unit: 4, 8
Factor: 1
Square Division: 1 - CL1! (D, W):
price unit: 0.5
Factor: 8
Square Division: 0.25 - BTCUSD (4h):
price unit: 512
Factor: 1
Square Division: 4
WARNING
This indicator is for educational purpose only. I am in no way responsible for bad setups, strategies and possible losses or gains of money as a result!
Fix adjust v3 and v4 lines square division for intraday (only TradingDays mode).
Yalnızca davetli komut dosyası
Only users approved by the author can access this script. You'll need to request and get permission to use it. This is typically granted after payment. For more details, follow the author's instructions below or contact Strambatax directly.
TradingView, yazarına tam olarak güvenmediğiniz ve nasıl çalıştığını anlamadığınız sürece bir komut dosyası için ödeme yapmanızı veya kullanmanızı ÖNERMEZ. Ayrıca topluluk komut dosyaları bölümümüzde ücretsiz, açık kaynaklı alternatifler bulabilirsiniz.
Yazarın talimatları
Uyarı: Erişim talebinde bulunmadan önce lütfen yalnızca davetli komut dosyaları kılavuzumuzu okuyun.
Feragatname
Yalnızca davetli komut dosyası
Only users approved by the author can access this script. You'll need to request and get permission to use it. This is typically granted after payment. For more details, follow the author's instructions below or contact Strambatax directly.
TradingView, yazarına tam olarak güvenmediğiniz ve nasıl çalıştığını anlamadığınız sürece bir komut dosyası için ödeme yapmanızı veya kullanmanızı ÖNERMEZ. Ayrıca topluluk komut dosyaları bölümümüzde ücretsiz, açık kaynaklı alternatifler bulabilirsiniz.
Yazarın talimatları
Uyarı: Erişim talebinde bulunmadan önce lütfen yalnızca davetli komut dosyaları kılavuzumuzu okuyun.