Advanced Volume-Driven Breakout SignalsThe "Advanced Volume-Driven Breakout Signals" indicator is a cutting-edge tool designed to help traders identify high-potential trading opportunities through sophisticated volume analysis techniques. This indicator integrates volume flow analysis, moving averages, and Relative Volume (RVOL) to provide a comprehensive view of market conditions, going beyond traditional Volume Spread Analysis (VSA) methods.
Key Features:
Volume Flow Analysis: Distinguishes bullish and bearish volume flows with distinct colors, making it easier to visualize market sentiment and potential breakout points.
Volume Flow Moving Averages: Calculates moving averages for volume using various methods (SMA, EMA, WMA, HMA, VWMA), accommodating different trading strategies. This includes settings for adjusting the type of moving average and its period, as well as thresholds for high, medium, and low volume levels.
Volume Spikes Detection: Identifies significant volume spikes based on user-defined multipliers and moving averages, highlighting unusual trading activity.
Volume MA Cloud Settings: Computes general moving averages of volume to track trends and detect deviations. This feature includes options to select different moving average types and adjust thresholds for detecting high volume activity.
Relative Volume (RVOL): Measures current volume relative to historical averages, triggering signals when RVOL exceeds predefined thresholds, indicating notable changes in trading activity.
Entry Conditions: Provides clear long and short entry signals based on combined volume flow conditions and RVOL, offering actionable trading opportunities.
Volume Visualization:
— Bullish Volume Flow: Light and dark green bars indicate bullish volume flow.
— Bearish Volume Flow: Light and dark red bars denote bearish volume flow.
— High Volume Bars: Highlighted in yellow, and extreme volume bars in orange for additional context. These bars are plotted for visual aid and do not directly influence trade signals, focusing instead on the quality and strength of the volume flow.
Alerts: Allows users to create alert notifications for long and short entry signals when the criteria are met, enabling traders to respond promptly to trading opportunities.
Usage:
Overlay: Apply the indicator directly to your price chart to visualise real-time signals and volume conditions.
Customisable: Adjust settings for moving averages, RVOL, and other parameters to match your trading strategy and preferences.
Comparison to VSA Scripts: The "Advanced Volume-Driven Breakout Signals" indicator extends beyond traditional VSA scripts by incorporating a wider range of analytical features. While VSA primarily focuses on volume spread patterns and price action, this indicator offers enhanced functionality with advanced RVOL metrics, customizable moving averages, and detailed volume spike detection, making it a more versatile tool for identifying breakout opportunities and managing trades. It is particularly effective when used alongside key levels and order blocks.
Acknowledgements: Special thanks to @oh92 and @goofoffgoose for their invaluable scripts, which served as inspiration in the development of this advanced trading indicator.
Notes: The script is continually evolving, with ongoing refinements aimed at enhancing accuracy and performance.
"breakout" için komut dosyalarını ara

VWAP Bollinger Band Crossover Breakout with ResistanceCredit to © Jesus_Salvatierra for VWAP script
This script help you find a trend in momentum stock that is about to breakout and shows resistance point. This script utilizes Bollinger bands VWAP and is good for intra day charts.
VWAP, or Volume Weighted Average Price, is a technical analysis tool used to measure the average price a security trades at during a given time period, weighted by the trading volume for each price level. It is commonly used by traders and investors to identify the true average price of a security and to assess whether they are buying or selling at a fair price.
A Bollinger Band is a technical analysis tool that uses standard deviation to measure the volatility of a security. The Bollinger Band is typically composed of three lines: the upper band, the lower band, and the middle band. The middle band is a simple moving average of the security's price, while the upper and lower bands are calculated based on the standard deviation of the security's price.
A Bollinger Band crossover occurs when the price of a security crosses above or below one of the bands. When the price crosses above the upper band, it is considered overbought, while when it crosses below the lower band, it is considered oversold. Traders often use Bollinger Band crossovers as a signal to enter or exit a position, depending on their trading strategy.
The VWAP and Bollinger Band crossover are two separate technical analysis tools that can be used in conjunction with each other. When a security's price crosses above or below the Bollinger Band, traders may look to the VWAP to confirm whether the security is trading at a fair price. If the security is trading above the VWAP, it may be overvalued, while if it is trading below the VWAP, it may be undervalued. Similarly, traders may use the Bollinger Band crossover as a signal to enter or exit a position, while also taking into account the VWAP to assess whether the price is fair.

Fractal BreakoutThis indicator prints channels based on Williams Fractals creating an upper and a lower channel. Breakouts of these channels are marked as buy or sell signal including the respective alerts. Furthermore the indicator includes a Moving Average which can be toggled on to be used as a trendfilter (buy above, sell below).

[Excalibur] Pivoted Automatic Breakout Trend LinesPREAMBLE:
As I will elaborate further, lines and linearity are everywhere in the our thoughts, words, objects, and nature. For example, in our youth, drawing lines on paper, ascribing them in the dirt, and using them to perfect hand writing is common occurrences in life everyone has experienced. Our minds are uniquely adaptable to envision linearities in many natural or abstract objects, including facial geometry. That's how we easily recognize each other in person. For decades, along our path on roadways to and from our destinations, road lines have long safely guided us. Common phrases are "get in line", "walk the line", "line of duty", and "finish line" in English. Gazing upon the earth's line of horizon on calm wide open ocean standing upon the shoreline, it is easily visible and it has curvature. Sorry to break it to you flat earthers.
Multitudes of agreed upon lines define nationally recognized boundaries on maps for very specific reasons. Some lines are just simply not meant to be crossed and are purposefully intended to be respected. Even at the time of this original release, lines are being "crossed" on unimaginable and tragic scales, forming a trend of devastation of lives and livelihoods. On occasion in human history, border lines have to be redefined, especially when a godvernment no longer represents the WILL of a vast geographic majority of it's citizens. When puppet representatives and misleaders only have a self serving interest to put their citizens most treasured values, grievances, and souls in the grave, succession is a matter of last resort and it's often statistically speaking 101% necessary.
As an American, from my opinionated perspective assessing the situation, I welcome the ancestral people of Donetsk and Luhansk to the world stage, being independent to choose their own destinies and fates, because all that Ukraine wishes to do with them year, after year, after year is render them as subjugates or use them for target practice. And that isn't right! The way 2021+ is heading, by the year 2100 I suspect every continental map is going to have new lines on them.
LINES OF ANTIQUITY:
Many recorded instances throughout history detailing the use of lines, has endured centuries of time. The ancient origins and study of "Euclidean geometry" would have been performed scribbling in the ground, preferably in sand. The Greek mathematician Euclid of Alexandria, the founder of geometry, most probably spent a great deal of his life doing this in order to pass his bold ideas onto future generations.
Before Euclid's time, Spartans in the battle of Thermopylae drew their lines in the sand with their swords adhering to the infamous words "Molon Labe" (come and take ). These disciples of agoge, born and destined for rigorous entrainment were bound by duty, no retreat, no surrender. Hundreds of Spartan sigma males held the line for as long as they could for the security of their free peoples. In almost every case of Spartan history the imperative notion of holding the battle lines was absolutely necessary at all costs, regardless of the carnage delivered from their enemy adversaries, including the unrelenting hordes of invasion commanded by the tyrant Xerxes. ALL gave some on those days.
Over two millennia later, Colonel William Travis at the Alamo carved a line in the ground for able men to decide which side of history they would reside on. History has an awfully bad habit of repeating itself, as it is always told in forewarnment. Lines have always been pertinent, decisive, and always shall be. A world without lines, would make our grasp of understanding and existence nearly impossible to carry on civilization.
LINES IN MODERN TIMES:
The versatility of lines are every where imaginable in this 21st century. A short list of their applications are in art, design, engineering, architecture, demarcation, and they are always, always ever pervasive in computer graphics. Without a doubt, lines are now pinnacle to having the ability to make our charting possible in order to recognize trends. Here in this script's application I intended them to automatically reveal geometry, trends, and breakout zones.
When I originally encountered my discovery of TradingView's existence, the very first thing I was doing, was to naturally draw lines across the price action pivot points in search of identifiable opportunities. Three years later, I have now finalized my vision of automatically drawing an ample amount of them by harnessing the "Power of Pine" in version 5. As you will soon see, utilization of this script will reveal hidden geometry that is otherwise typically unforeseen.
SCRIPT FUNCTIONALITY:
Programmatically drawing lines on top of numeric chaos has been an arduous task, taking me over a year to stabilize this code to my liking. The possibilities of automatically drawing lines on market price action could in theory actually result into hundreds per chart pane. This script does have a limitation of 60 line segments/rays maximum. I have gone to great lengths to accomplish this feat, just to arrive at 60 per overlay indicator. Beyond that, I am experiencing limitations of Pine. Because of the amount of work required to finalize this indicator, this is one of my "Excalibur" indicators. I literally had to pull this code from the deepest recesses of my mind. I would classify this kind of indicator as a weapon of mass financial creation, so I'm offering it's availability to all members.
Segments/rays may be computationally drawn as far back as 5000 bars into the chart's history, but no more than that are to be expected. Only one line will occur from pivot point to pivot point. All duplicate line occurrences computed are not redrawn over another, as I ensured by filtration this would not happen. Numerous adjustments are present to handle a majority of expectations and the numerous visual acuities of members. I envision many thousands of members utilizing this script's versatility as a visual aid to help guide them along their path of trading assessments and decisiveness.
SCRIPT UTILITY:
Having the ability to recognize geometry in price movements is ultra handy in relation to directional trending and channeling arrangements especially. Trends are guaranteed at some unknown point in time to breakout, and form new trends or cycles. I employed a fire and ice color duo to differentiate between the upper trend lines from the lower trend lines. It seemed to be most visible without interfering too often with other indicators. These can be changed to any color combo you desire in Settings. Additional line preferences are provided to support your tailored experience while having other indicators present in the overlay pane. It may even be configured to only display two lines at a minimum. By doing so, you can really focus and fine tune Settings for just these two segments/rays with very specific refined tweaks.
One caveat of detecting pivots, is that they aren't recognized until after they have formed. Always remember that pivot points aren't instantaneously discoverable until their full form is computationally apparent in the form of a chevron. Technically describing the pivot detection is beyond normal comprehension and to difficult to explain in this description. I will also say, viewing this on a 4K display resolution reveals the best view. If you wish to use more than one instance of this indicator in the overlay for more than 60 lines at a time, go right ahead. However it may become messy.
P.S. This script and it's description was partially inspired by Twisted Sister's song "We're Not Gonna Take It"
RISK DISCLAIMER:
My scripts and indicators are specifically intended for informational and educational use only. This script uses historical data points to perform calculations to derive real-time calculations. They do not infer, indicate, or guarantee future results or performance.
By utilizing this script/indicator or any portion of it, you agree to accept 100% responsibly and liability for your investment or financial decisions, and I will not be held liable for your subjective analytic interpretations incurring sustained monetary losses. The opinions and information visual or otherwise provided by this script/indicator is not investment advice, nor does it constitute recommendation.

Volume Bar Breakout and Breakdown IndicatorVolume shows strength of a movement and highest volume shows the region that pushed price to certain extent with full strength. Breakout or Breakout of the highest volume bar range shows continuity further push by sellers or buyers indicating a trend continuation for a small period if not for long duration. Entries can be taken once signal is generated with stoploss as recommended.
Guidelines:
Don't trade if range is too large
Don't trade if Breakdown or Breakdown candle body / range is too large or if there is high volatility
Use additional indicator to get the idea of overall trend analysis

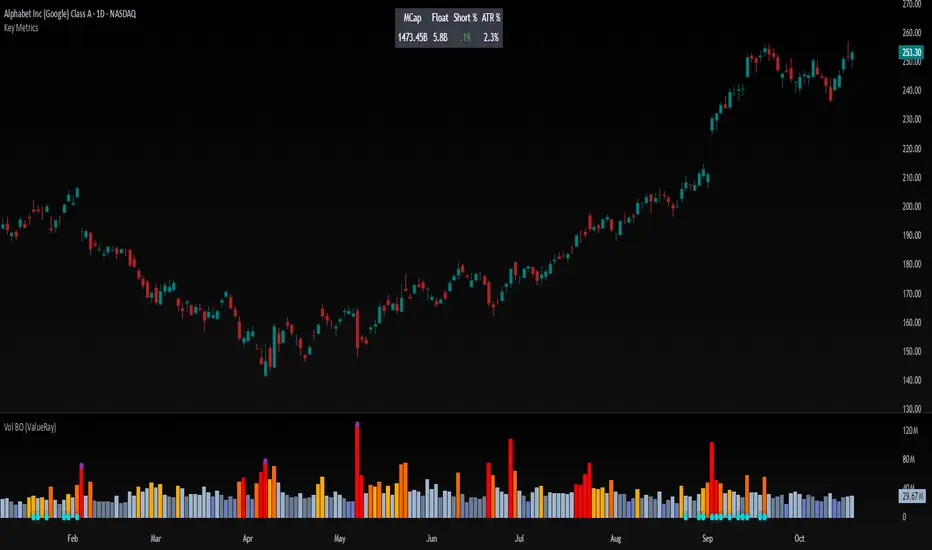
Volume Breakout (ValueRay)Easy visuals on, if volume is way over average. Good for Mean Reverting. Higher Volume tends to higher breakout chances.
Please whisper me for for ideas how to make this better. Its a very simple script, but got some alpha. If you know how to improve, let me know and i will code it into.
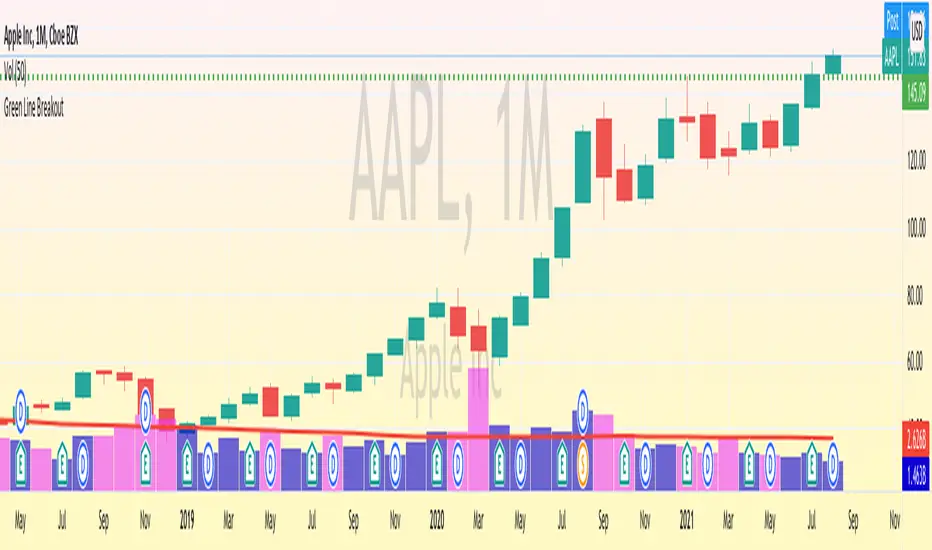
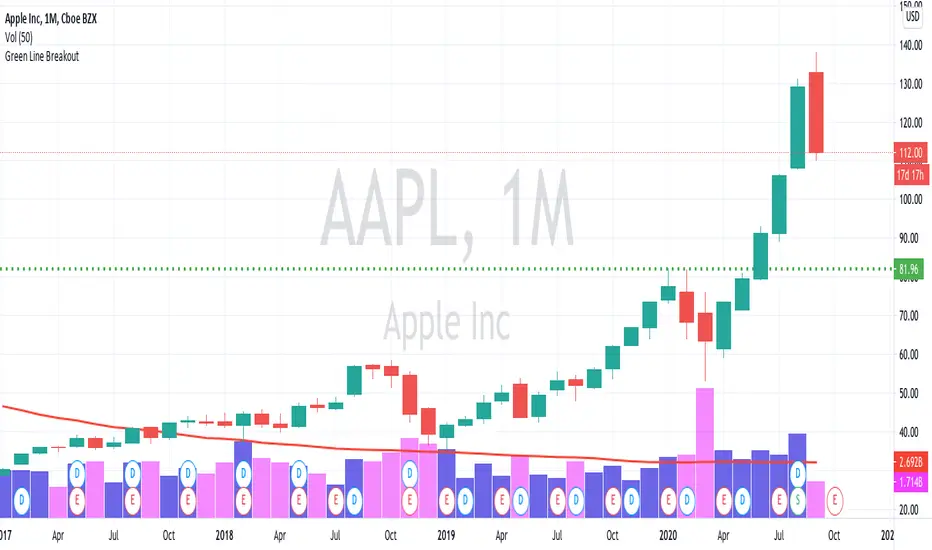
Green Line Breakout (GLB) - Public UseNOTE: This is public use - open source version of GLB published by me in Sep 2020. As Trading View is not allow unprotect script already shared, I am sharing it for anyone to use the script and make a copy.
========
This is an implementation of Green Line Breakout ( GLB ) which is popularized by Eric Wish through his Wishing Wealth Blog.
GLB indicator looks at a monthly chart for a stock that hit a new all time high recently and draw a green horizontal line at the highest price reached at any month, that has not been surpassed for at least 3 months.
In other words, this method finds stock that reached an all-time high and has then rested for at least three months. When a stock moves through the green line or is above its last green line, it is an indication of strong buying interest.
Read more about how to use the indicator in Wishing Wealth Blog.
Usage Explanation:
1. Set the time frame to Monthly for a stock and automatically a green dashed line appears based on the calculation explained above
2. If no GLB found for a stock, then green line appears at 0.0
2. If you set any other time frame other than Monthly, no Green Dashed line shown
NSDT Pre-Market Breakout LevelsA simple way to identify potential breakouts at the New York market open. This indicator plots the high and low of the New York Pre-Market, providing a great visual of a potential breakout levels.
Vortex Range Breakout SystemThis is a Vortex Based Visual System,
Which can help you identify the Vortex Crosses based Range Breakouts/ Breakdown, over the price Scale,
How its made ?
The vortex Crosses are projected over the Price
on Same Time frame {Green and Red Filled area}
-> green Area means : Vortex Crossover Range
-> red Area means : Vortex Crossunder Range
and on Higher Timeframe
Vortex Cross Levels are Plotted, which you see as :
Blue and Orange Lines
Default Configs
Vortex Period is 14
Higher Timeframe Option is set to 60 mins
You can change the Higher timeframe to any minutes which suits your need
Also If you want to change the Higher Timeframe in Days
just know
1D = 24*60 min, = 1140mins
Enjoy!

Range Breakout Indicator with trailing SLDear Traders,
This is a simple range breakout indicator where we are creating a range based on high and low of two consecutive volatile candles.
The logic is,
1) If the second candle traverse 1% up from the previous candle low (or)
2) If the second candle traverse 1% down from the previous candle high
then, the range is formed based on this high and low and
3) Buy signal will be given if the price crosses above the High
4) Sell signal will be given if the price crosses below the Low
The indication comes along with the Entry Indication, Exit Indication along with trailing SL
Option provided for changing the session time, target %, SL % and trailing SL %.
Happy Trading!
P.S: Please DM for access.
Green Line Breakout (GLB)This is an implementation of Green Line Breakout (GLB) which is popularized by Eric Wish through his Wishing Wealth Blog.
GLB indicator looks at a monthly chart for a stock that hit a new all time high recently and draw a green horizontal line at the highest price reached at any month, that has not been surpassed for at least 3 months.
In other words, this method finds stock that reached an all-time high and has then rested for at least three months. When a stock moves through the green line or is above its last green line, it is an indication of strong buying interest.
Read more about how to use the indicator in Wishing Wealth Blog.
Usage Explanation:
1. Set the time frame to Monthly for a stock and automatically a green dashed line appears based on the calculation explained above
2. If no GLB found for a stock, then green line appears at 0.0
2. If you set any other time frame other than Monthly, no Green Dashed line shown
Stock Breakout Algo by Technicaltrader615This is a Breakout Algo Suited for trading Stocks in NSE ( India) . The code looks for breakout above yesterday high and low with respect to the pivot R1 and S1. The order pings as Bracket order with 2R as target and 1R as risk. Time frame to be used is 5 mins.
We need to feed stocks with narrow range prior day for better performance.
You need to define risk in the Bridge for Each of the Stock. Lets say the stop loss is 10 points and Risk is 1000. The bridge will ping 1000/10 = 100 Shares to buy/ sell with 2R as target. the Target can be set to 3R also . This some times get rejected as Indian Stock exchange has upper circuit limit set. So we can go for 2R for ill-liquid stoks and 3R for liquid Stocks.
Similarly if 1000 Rs risk and 50 points sl , the bridge will place 1000/50 = 20 Share qty.
Breakout / Breakdown candles are Denoted by Colour change in the chart for visual purpose.
For more Details you can contact thru trading view chat window. You can also scroll down for my signature. This is only for the Students of Mine.

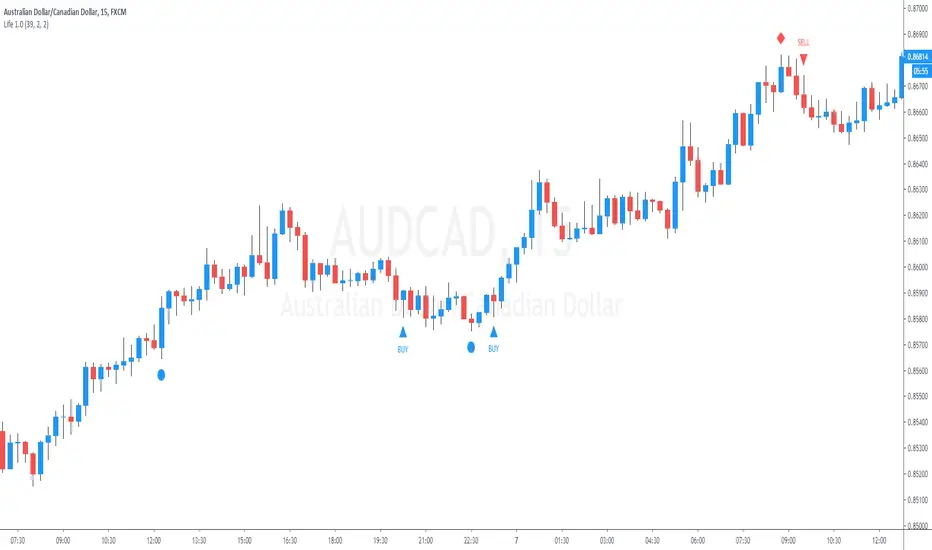
25 Life Bank BreakOutThis indicator allows the user to visually identify a swing High/Low and place a marker which will measure 2 candles either side of the swing point for the lowest body.
Once identified apply a 50% Fib to the body to ID a break out point and allow an alert to be placed.
Subsequently measures a 25% fib retracement of the breakout for a potential entry point. Alerts may also be created.
This does not provide trading signals nor is designed to do so.
It is not a trading strategy.
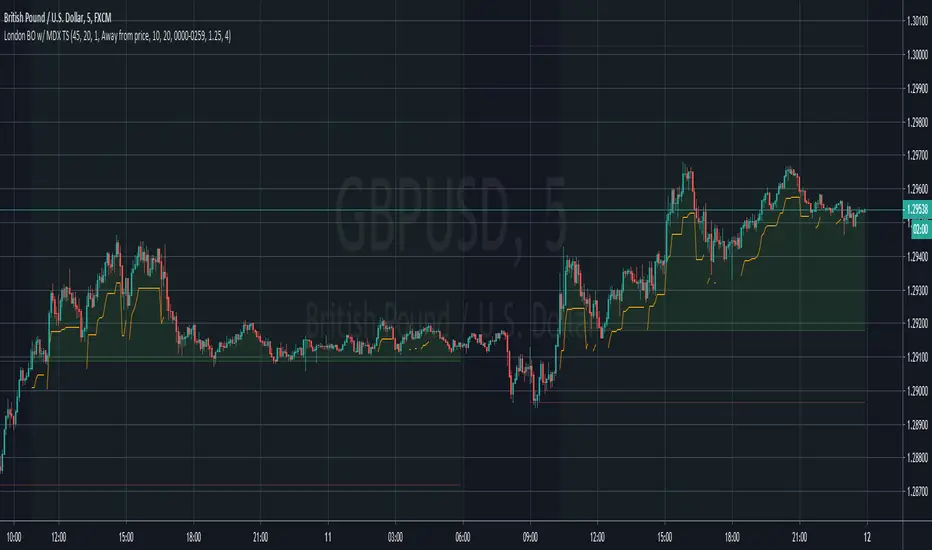
London Breakout with MDX Trailing StopThis indicator aims to aid in using the regular London Breakout strategy, as well as improve on it by adding a trailing stop based on the Mean Deviation Index.
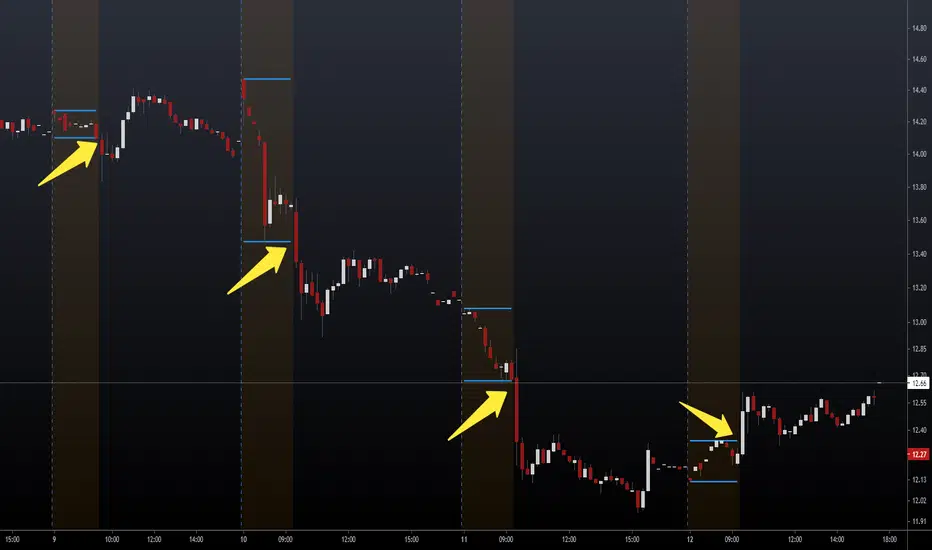
The London Breakout strategy (according to my personal understanding) basically sees the morning before London open as the accumulation or distribution range for large buyers or sellers, and assumes the market will break either above that mornings high or below that mornings low when they start to move price. It is mostly used to trade stock indices and forex.
This indicator plots the morning high and low for each day. The green line is the morning high, and the red line is the morning low. If price moves above the green line (the morning high) it fills that area with a green color. If price moves below the green line (the morning low) it fills that area with a red color. This makes the breakouts easy to spot.
The background color of the chart turns green when the MDX is above 0 (price is more than X times ATR above the mean) and a breakout above the morning high has occurred, and stays green until the opposite happens.
The background color of the chart turns red when the MDX is below 0 (price is more than X times ATR below the mean) and a breakout above the morning high has occurred, and stays green until the opposite happens.
The default for X above is 1.0, but this can be changed in the settings by changing "ATR Multiplier".
The background is always neutral during the morning session since the morning high and morning low are not established yet.
A trailing stop is shown when price is more than X times away from the mean and a breakout has occured. The distance is set using the MDX. The trailing stop uses a separate ATR multiplier though, to make the signal and trailing stop MDX values different, if one likes. The default ATR multiplier for the trailing stop is 1.25, but this can be changed is the settings by changing "ATR multiplier for trailing stop".
When the high or low of a candle breaks the trailing stop, it is moved further away, indicating you have been stopped out, but gives opportunity to use it if you enter again (so it doesn't just disappear).
As an added bonus, take profit levels have been added based on the mornnig range. The take profit distance is set by multiplying the range with a factor. The levels are then plotted that distance from the morning high and morning low.
MDX:

Darvas Box/Turtle Way Breakouts v.2 by ZekisFor those who never heard about these two huge strategies:
* * * Darvas Box Strategy - www.netpicks.com
* * * Turtle Way Strategy - www.investopedia.com
In very short terms, both strategies are based on breakouts, probably the easiest way to trade (with proper education, obviously)
I created this indicator based on highs and lows, which will create support and resistance line, which will create a channel/box.
There is the possibility to :
- change channel/box size
- ride it till it will enter again into the channel/box
- set TPs and SL targets
- set alerts for Long, Short, Close when price enter into the channel, SL
- enable or disable 2 TP targets
- enable or disable 1 SL
- enable or disable middle line
Rules are simple:
1. Go Long when price breaks the upper line
2. Go Short when price breaks the lower line
3. Exit Long/Short when price enter into the channel/box
4. Stop Loss are added for safety
5. Added 2 layers for Take Profits
6. Added middle line that can act as Stop Loss
Legend:
1. White line - channel/box
2. Upper white line followed by green line - price cracked the channel/box - Go Long
3. Lower white line followed by red line - price cracked the channel/box - Go Short
4. Red zone - Stop Loss zone
5. Dotted red line - Stop Loss line
6. Dark green zone - first Take Profit zone
7. First dotted dark green line - first Take Profit target
8. First dotted dark green line followed by dotted lime line - price touched first Take Profit
9. Bright green zone - second Take Profit zone
10. Second dotted dark green line - second Take Profit target
11. Second dotted dark green line followed by dotted lime line - price touched second Take Profit
12. Dotted gray line - channel/box middle line
*** Don't use any indicator without knowing whatyou are doing, there is no such a magic lottery winning ticket
Trade safe!
Enjoy!
@Zekis

TradingCryptoCourse Support/ resistance BreakoutThis indicator looks for breakouts above and below the latest highs and lows.

Peso Pros Asia Breakout with AlertsAsia Breakout indicator using some magic sauce with two take profit levels and alerts to go long or short. Works on a variety of pairs as discussed in the Peso Pros group and course. SL the other side of the trade at the middle of the box or the end.
Spicytrader [BUY and SELL signals + Breakouts + Trendline]
BUY and SELL signals (with alerts)
Support and resistant breakout (with alerts)
Auto trendlines : Bullish and bearish market (with alerts)
100% Compatible with Autoview bot (Buy, Sell, Takeprofit, Stop loss)
TRY IT FOR FREE : spicytrader.com

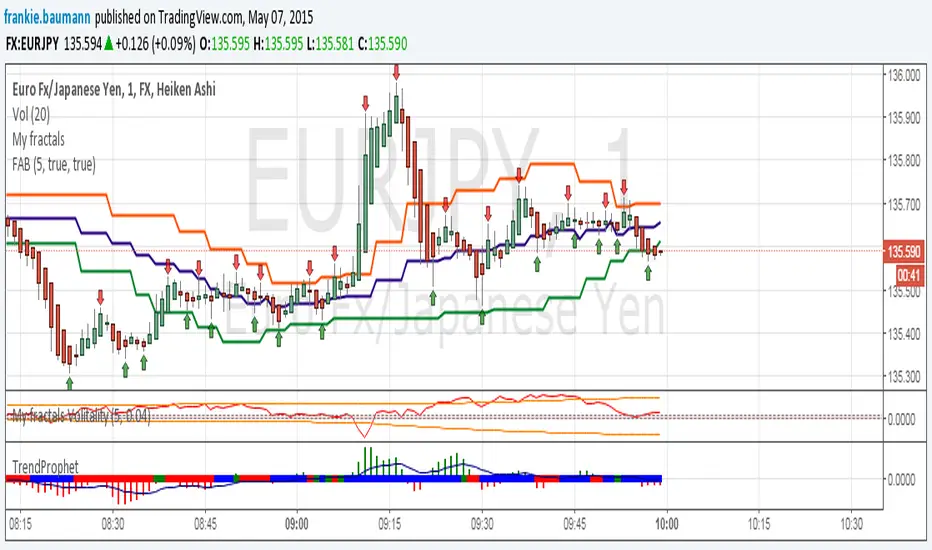
Fractals average breakout [FB]My first indicator.
A simple average of last 1 to 10 fractals (top and bottom)
Trade breakouts of top or bottom lines.
Feel free to use and experiment with.
Frank Baumann
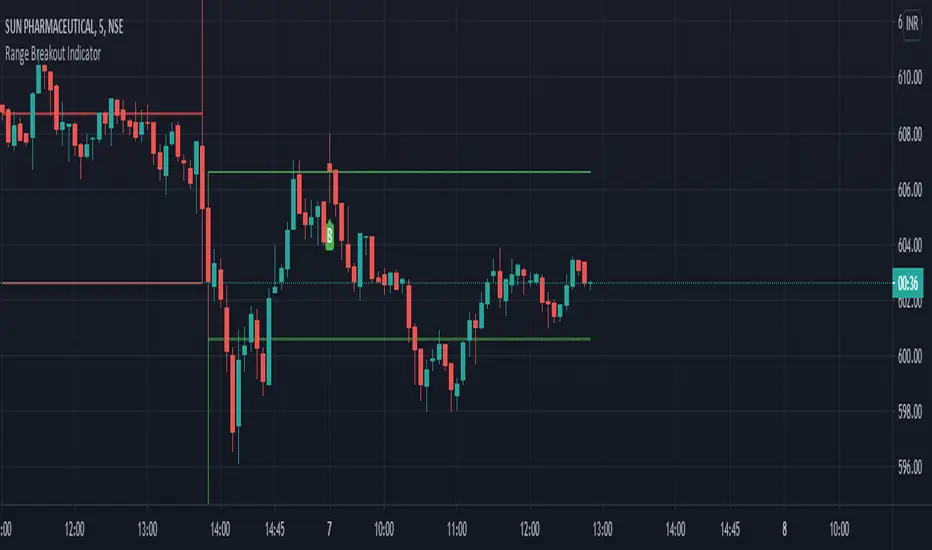
Rectangle Breakout Patterns📊 Rectangle Breakout Pattern Detector (Support & Resistance)
This indicator is a dynamic tool designed to automatically identify and visualize Rectangle Continuation Patterns and Trading Ranges based on pure price action. It focuses on finding horizontal areas of long-term support and resistance where price is consolidating before an eventual breakout.
💡 What It Does
The core function of this indicator is to detect and plot the boundaries of significant consolidation areas on your chart. It follows a multi-step confirmation process:
Level Detection: It automatically identifies significant Pivot Highs and Lows.
Pattern Confirmation: It confirms Support and Resistance by counting the number of times price 'touches' a level (controlled by the Min Pivot Touches setting).
Visualization: Once confirmed, it draws a Box around the consolidation area. This box automatically extends to the right as long as the price remains contained, showing the active trading range.
This provides an objective, code-driven approach to a classic chart pattern often relied upon by technical analysts.

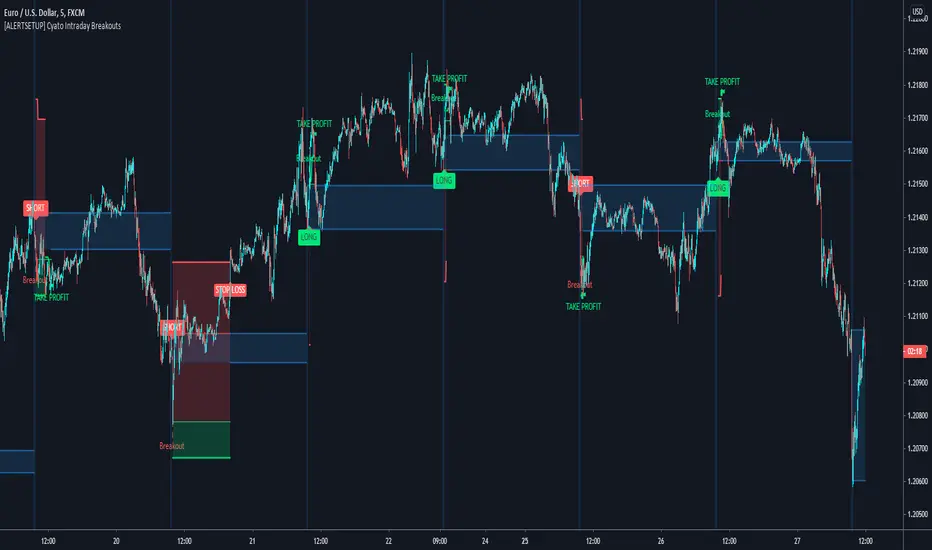
Cyatophilum Intraday Breakouts [ALERT SETUP]Private indicator.
Here is the alert version of the Triple Screen Strategy
Recap of the strategy:
The goal of this indicator is to be able to automate and backtest the strategy, all while staying on a single chart and without repainting.
Features:
Market Tide MACD configuration
Market Wave choice between 3 oscillator: Elder Force Index, Stochastic and William Percent Range
Automated Long and Short entries alerts
Integrated Trailing Stop Loss system fully configurable with automated exit alerts
Integrated Trailing Take profit system fully configurable with automated exit alerts
Indicator samples
Backtest version:
Alerts
Entry Long: Triggers on green long labels.
Take Profit Long: Triggers on the "TAKE PROFIT" green flag if the long target is reached.
Stop Loss Long: Triggers on the "STOP LOSS" or "TSSL" label if the stop loss line has been crossed.
Exit Long: Triggers on either of Take Profit Long or Stop loss long.
Entry Short: Triggers on red short labels.
Take Profit Short: Triggers on the "TAKE PROFIT" green flag if the short target is reached.
Stop Loss Short: Triggers on the "STOP LOSS" or "TSSL" label if the stop loss line has been crossed.
Exit Short: Triggers on either of Take Profit Short or Stop Loss Short.
To get access to this indicator use the link below
Thanks for reading!
Breakout/Breakdown DetectorBreakout/Breakdown Detector - Quick Overview
What it does:
This indicator automatically identifies when price breaks through key support or resistance levels, signaling potential trading opportunities.
Key Features:
📈 Breakout Detection - Alerts when price breaks ABOVE resistance (bullish signal)
📉 Breakdown Detection - Alerts when price breaks BELOW support (bearish signal)
🔊 Volume Confirmation - Optionally requires high volume to confirm the break (filters false signals)
📊 Visual Signals - Shows green triangles (breakout) and red triangles (breakdown) on chart
🎨 Support/Resistance Lines - Automatically draws key levels based on recent price action
Settings You Can Adjust:
Lookback Period (default 20) - How many candles back to find support/resistance
Volume Multiplier (default 1.5x) - How much volume needed to confirm
Breakout Threshold (default 0.5%) - How far price must break through the level
How to Use:
Add to any chart (stocks, crypto, forex, etc.)
Green triangle below bar = BUY signal (breakout)
Red triangle above bar = SELL signal (breakdown)
Set alerts to get notified automatically
Perfect for: Swing traders, breakout traders, and anyone who wants to catch momentum moves early! 🚀
