OPEN-SOURCE SCRIPT
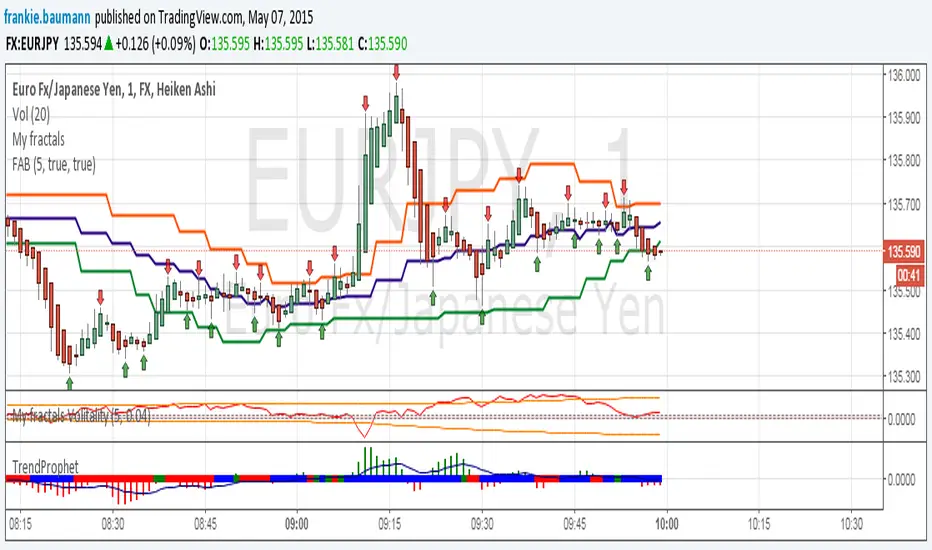
Fractals average breakout [FB]
My first indicator.
A simple average of last 1 to 10 fractals (top and bottom)
Trade breakouts of top or bottom lines.
Feel free to use and experiment with.
Frank Baumann
A simple average of last 1 to 10 fractals (top and bottom)
Trade breakouts of top or bottom lines.
Feel free to use and experiment with.
Frank Baumann
Açık kaynak kodlu komut dosyası
Gerçek TradingView ruhuna uygun olarak, bu komut dosyasının oluşturucusu bunu açık kaynaklı hale getirmiştir, böylece yatırımcılar betiğin işlevselliğini inceleyip doğrulayabilir. Yazara saygı! Ücretsiz olarak kullanabilirsiniz, ancak kodu yeniden yayınlamanın Site Kurallarımıza tabi olduğunu unutmayın.
Feragatname
Bilgiler ve yayınlar, TradingView tarafından sağlanan veya onaylanan finansal, yatırım, işlem veya diğer türden tavsiye veya tavsiyeler anlamına gelmez ve teşkil etmez. Kullanım Şartları'nda daha fazlasını okuyun.