Squeeze & Breakout Confirmation StrategyThis strategy focuses on identifying periods of low volatility (Bollinger Band Squeeze) and then confirming the direction of the subsequent breakout with momentum, volume, and candle strength.
Concepts Applied: Bollinger Bands (Squeeze), RSI (Momentum), Market Volume (Conviction), Candle Size (Strength)
Buy Signal:
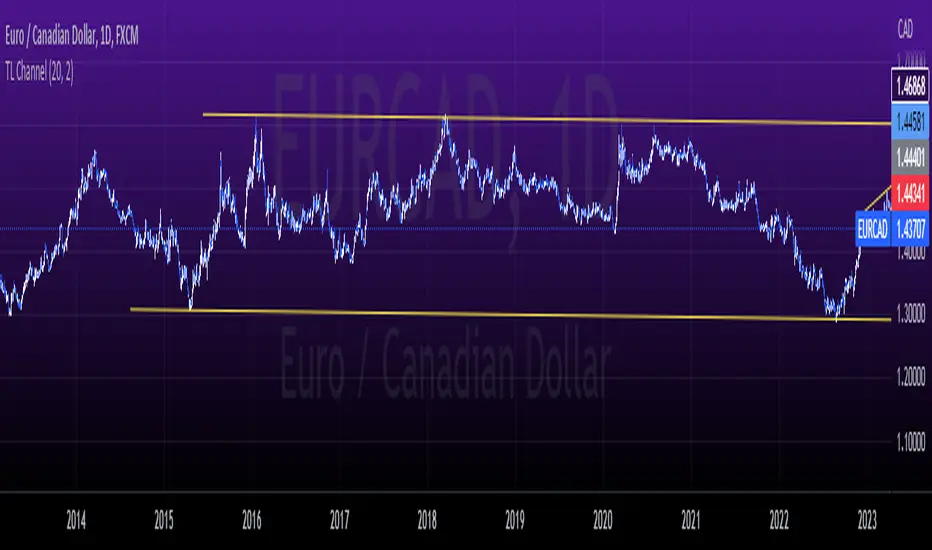
Bollinger Band Squeeze: Look for a period where the Bollinger Bands contract significantly, indicating low volatility and consolidation. The bands should be very close to the price action.
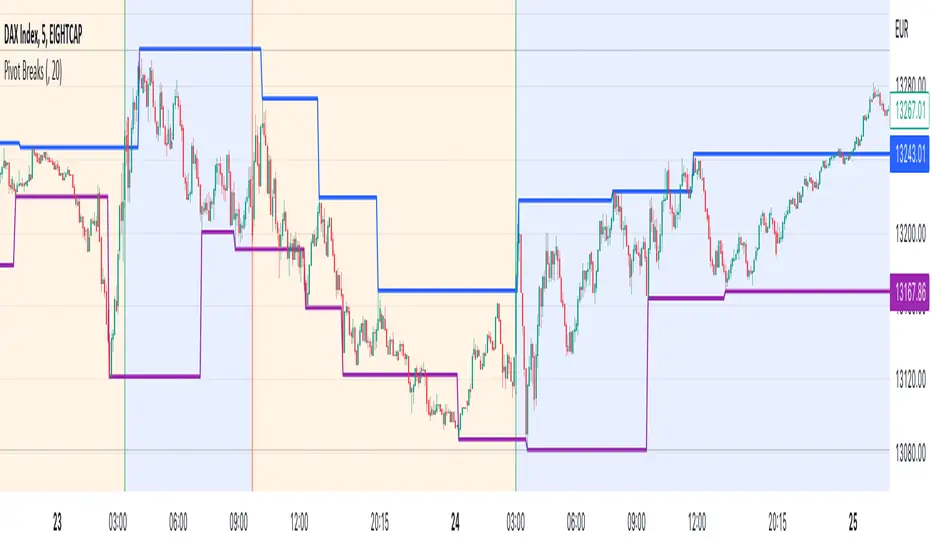
RSI Breakout: After the squeeze, wait for the price to break decisively above the upper Bollinger Band. Simultaneously, the RSI should break above 60 (or even 70), indicating strong bullish momentum.
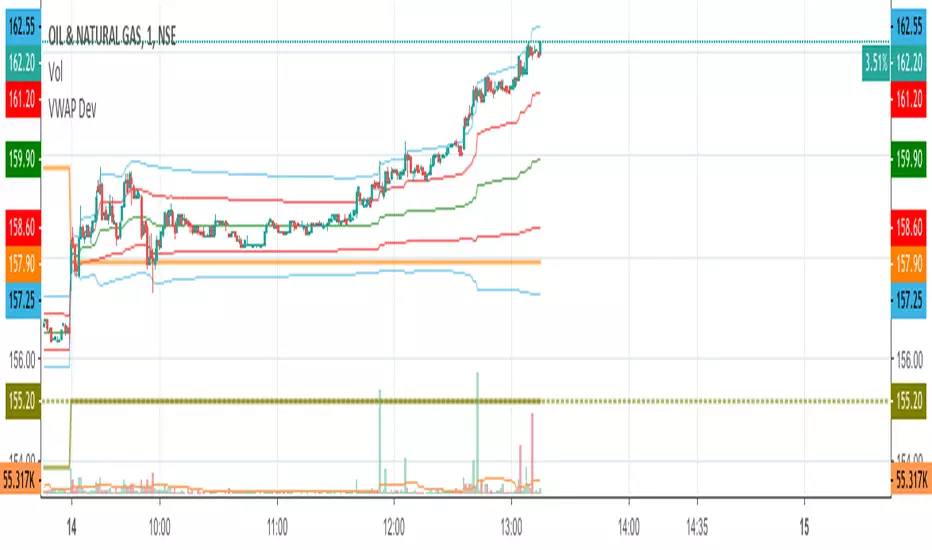
Volume Surge: The breakout candle should be accompanied by a significant increase in trading volume, ideally above its recent average, confirming strong buying interest.
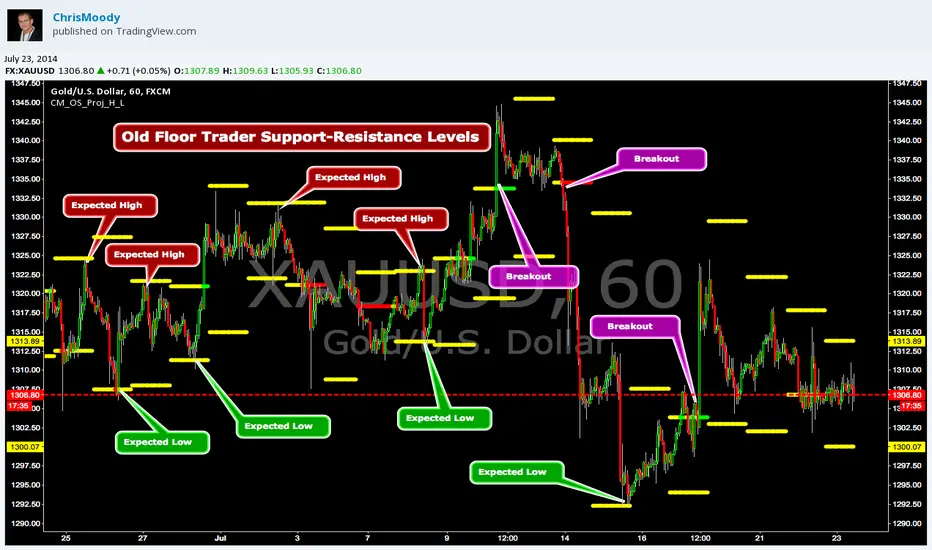
Strong Bullish Candle: The breakout candle itself should be a large, bullish candle (e.g., a strong green candle with a small upper wick or a bullish engulfing pattern), demonstrating buyer conviction.
Sell Signal (Short):
Bollinger Band Squeeze: Look for a period where the Bollinger Bands contract significantly.
RSI Breakdown: After the squeeze, wait for the price to break decisively below the lower Bollinger Band. Simultaneously, the RSI should break below 40 (or even 30), indicating strong bearish momentum.
Volume Surge: The breakdown candle should be accompanied by a significant increase in trading volume, ideally above its recent average, confirming strong selling interest.
Strong Bearish Candle: The breakdown candle itself should be a large, bearish candle (e.g., a strong red candle with a small lower wick or a bearish engulfing pattern), demonstrating seller conviction.
Pine Script® göstergesi