OPEN-SOURCE SCRIPT
tlc with False Breakout
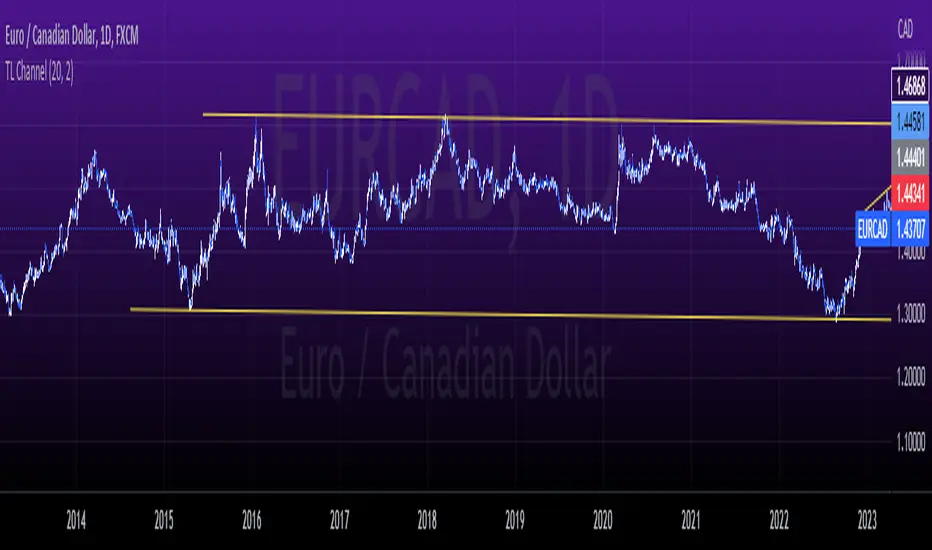
The strategy aims to identify a trend line channel with the potential for a false breakout. Here's an explanation of the strategy:
The script starts by defining the input parameters. The lookback parameter determines the number of previous bars to consider for detecting the trend lines, and the threshold parameter controls the sensitivity of the trend line detection.
The script then initializes variables to store the trend lines, tap count, and the false breakout signal.
Inside the loop, the script iterates over the specified number of bars (lookback) to identify the trend lines. It checks if the current high is greater than the previous and next highs to identify an upper trend line and sets it using the line.new function. Similarly, it checks if the current low is smaller than the previous and next lows to identify a lower trend line and sets it.
The script also keeps track of the price levels of the upper and lower trend lines using the variables upperTrendLinePrice and lowerTrendLinePrice. These price levels are obtained using the line.get_y1 function.
After the fourth tap (when tapCount is equal to 4), the script checks if the current close price is above the upper trend line or below the lower trend line. If this condition is met, it sets the falseBreakout variable to true, indicating a potential false breakout.
Finally, the script plots a shape marker (plotshape) when a false breakout occurs. This is represented by an orange label displayed below the bar.
At the end of the script, the line.delete function is used to remove the old trend lines when the script reaches the last bar (barstate.islast).
By using this strategy, you can visually identify trend line channels where the upper and lower lines touch higher highs or lower highs and higher lows or lower lows. Additionally, it provides a false breakout signal when the price breaks above the upper trend line or below the lower trend line on the fifth tap.
Açık kaynak kodlu komut dosyası
Gerçek TradingView ruhuna uygun olarak, bu komut dosyasının oluşturucusu bunu açık kaynaklı hale getirmiştir, böylece yatırımcılar betiğin işlevselliğini inceleyip doğrulayabilir. Yazara saygı! Ücretsiz olarak kullanabilirsiniz, ancak kodu yeniden yayınlamanın Site Kurallarımıza tabi olduğunu unutmayın.
Feragatname
Bilgiler ve yayınlar, TradingView tarafından sağlanan veya onaylanan finansal, yatırım, işlem veya diğer türden tavsiye veya tavsiyeler anlamına gelmez ve teşkil etmez. Kullanım Şartları'nda daha fazlasını okuyun.