Smart Breakout with ATR Stop-LossThe Smart Breakout indicator combines a classic 20-day Donchian channel breakout with a tight trailing stop, drawing green lines and “ENTRY” labels at the bar after a valid breakout, and red lines and “EXIT” label at the bar after a stop-loss breach.
By default it uses the chart’s timeframe to compute ATR and stops, but you can flip on Daily lock to freeze both ATR and price reads at the daily resolution—so your stops stay the same whether you view at 1s, 15 m, 4h or lower frequency bars.
Key features:
20-day Donchian breakout: entry when price closes above the highest high of the previous 20 bars
2 × ATR(14) trailing stop: initialized at entry and raised only when the new (close – 2 × ATR) exceeds the prior stop
Daily lock option: Ensures all ATR and close values are calculated on the daily timeframe, keeping stop levels consistent across resolutions
"breakout" için komut dosyalarını ara

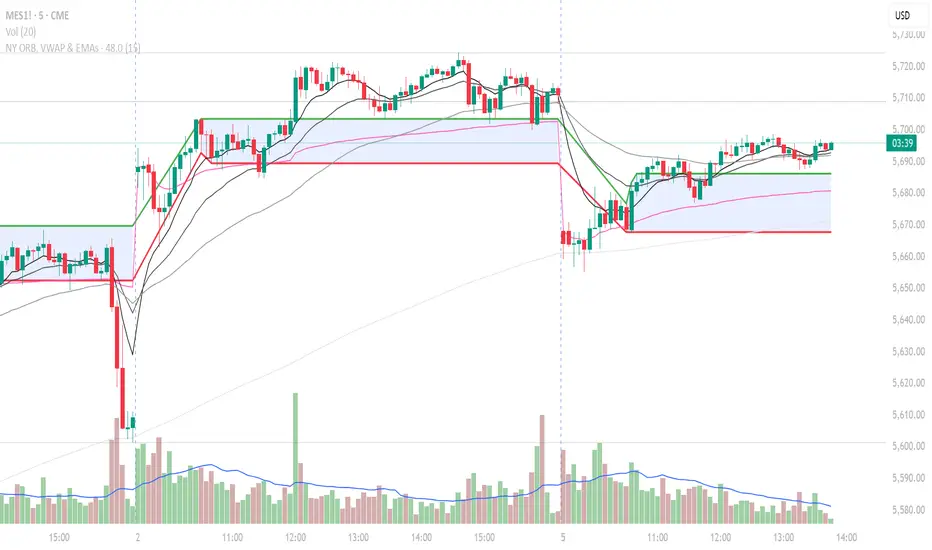
NY ORB, VWAP & EMAsIndicator is designed to display key technical analysis tools on your Trading View chart. It includes:
One of the key benefits of this indicator is that it allows Basic Trading View users to set VWAP, EMAs, and ORB in a single indicator. This is particularly useful for users who are limited to a single indicator on their Basic plan, as it provides a comprehensive view of market sentiment, trend, and potential breakouts without the need for multiple indicators.
Features
New York Opening Range Breakout (ORB): Plots the high and low of the first 15 minutes (configurable) of the New York trading session.
Volume Weighted Average Price (VWAP): Displays the VWAP line, which can be toggled on or off.
Exponential Moving Averages (EMAs): Plots four EMAs (9, 21, 50, and 200 periods), which can also be toggled on or off.
Customization
ORB Length: Choose from 5 or 15 minutes for the ORB calculation.
Show VWAP and EMAs: Toggle the visibility of the VWAP and EMA lines on or off.
Usage
This indicator is designed to help traders identify key market levels, trends, and potential breakouts during the New York trading session. The ORB can be used to gauge market sentiment, while the VWAP provides a benchmark for average price action. The EMAs offer additional trend analysis and can be used to identify potential support and resistance levels.
Donchian Breakout Strategy📈 Donchian Breakout Strategy (Inspired by Way of the Turtle)
This strategy is a modern adaptation of the legendary Turtle Trading system as taught in Way of the Turtle by Curtis Faith — re-engineered for the crypto market’s volatility, 24/7 nature, and frequent fakeouts.
⸻
🐢 Original Inspiration
The original Turtle system, created by Richard Dennis and William Eckhardt, used:
• Breakouts of Donchian Channels (20-day for entry, 10-day for exit)
• Volatility-based position sizing using ATR (N)
• Simple rules, big trend exposure, and pyramiding to grow winners
It was built for futures and commodities, trading daily bars, assuming stable trading hours and regulated markets.
⸻
🚀 What’s Different in This Strategy?
✅ Optimized for Crypto
• Adapts to constant volatility and price manipulation common in crypto
• Adds commission modeling for realistic results (0.045% default)
✅ Improved Entry Filtering
• Uses EMA filter to align with trend direction
• Adds RSI momentum check to avoid early or weak breakouts
• Optional volatility and volume filters to reduce false signals
✅ Smarter Exits
• ATR-based volatility stop loss, not just Donchian reversal
• Avoids pyramiding to reduce risk from sudden reversals
✅ Backtest-Friendly
• Default backtest window starts from 2025-01-01
• Fully configurable: long/short toggle, filter control, stop loss multiplier
⸻
🧪 Use Case
• Best on trending coins with strong directional moves
• Avoids chop via filters, preserving capital
• Can be tuned for aggressive or conservative setups with just a few tweaks

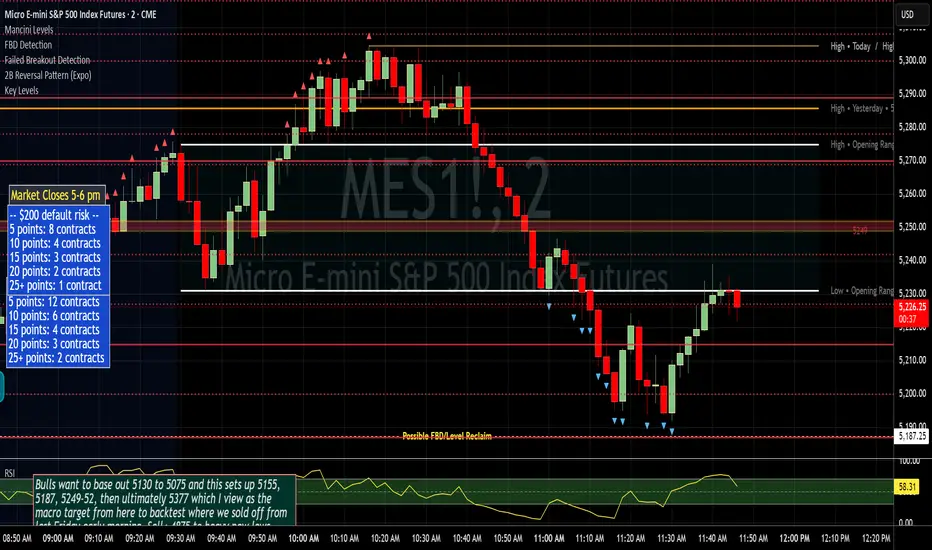
Failed Breakout DetectionThis indicator is a reverse-engineered copy of the FBD Detection indicator published by xfuturesgod. The original indicator aimed at detecting "Failed Breakdowns". This version tracks the opposite signals, "Failed Breakouts". It was coded with the ES Futures 15 minute chart in mind but may be useful on other instruments and time frames.
The original description, with terminology reversed to explain this version:
'Failed Breakouts' are a popular set up for short entries.
In short, the set up requires:
1) A significant high is made ('initial high')
2) Initial high is undercut with a new high
3) Price action then 'reclaims' the initial high by moving +8-10 points from the initial high
This script aims at detecting such set ups. It was coded with the ES Futures 15 minute chart in mind but may be useful on other instruments and time frames.
Business Logic:
1) Uses pivot highs to detect 'significant' initial highs
2) Uses amplitude threshold to detect a new high above the initial high; used /u/ben_zen script for this
3) Looks for a valid reclaim - a red candle that occurs within 10 bars of the new high
4) Price must reclaim at least 8 points for the set up to be valid
5) If a signal is detected, the initial high value (pivot high) is stored in array that prevents duplicate signals from being generated.
6) FBO Signal is plotted on the chart with "X"
7) Pivot high detection is plotted on the chart with "P" and a label
8) New highs are plotted on the chart with a red triangle
Notes:
User input
- My preference is to use the defaults as is, but as always feel free to experiment
- Can modify pivot length but in my experience 10/10 work best for pivot highs
- New high detection - 55 bars and 0.05 amplitude work well based on visual checks of signals
- Can modify the number of points needed to reclaim a high, and the # of bars limit over which this must occur.
Alerts:
- Alerts are available for detection of new highs and detection of failed breakouts
- Alerts are also available for these signals but only during 7:30PM-4PM EST - 'prime time' US trading hours
Limitations:
- Current version of the script only compares new highs to the most recent pivot high, does not look at anything prior to that
- Best used as a discretionary signal
Premarket High/Low Breakout AlertsPremarket High/Low Breakout Alerts
Description: This custom TradingView indicator helps you track premarket breakouts and breakdowns for a list of selected stocks. The indicator monitors the premarket session and sends an alert every time the stock's price breaks above the premarket high or below the premarket low.
Key Features:
Track Multiple Stocks: Easily monitor multiple stocks (e.g., AAPL, TSLA, NVDA, etc.) and get alerts when they break premarket levels.
Premarket Session Monitoring: The indicator checks for price movements during the premarket session (4:00 AM to 9:30 AM EST).
Customizable Ticker List: Modify the list of tickers directly from the TradingView settings to suit your daily trading needs.
Breakout and Breakdown Alerts: Receive instant alerts for both breakout (above premarket high) and breakdown (below premarket low) conditions.
Plot Premarket Levels: The premarket high and low levels are plotted on the chart for easy reference.
How to Use:
Add this indicator to your chart.
Go to the indicator settings and input your desired stock tickers (e.g., AAPL, TSLA, MSFT).
The indicator will automatically track the premarket levels and send alerts when those levels are broken.
Customize the tickers daily if needed.
Ideal For:
Day Traders who want to track premarket movements.
Swing Traders looking for strong breakouts from premarket levels.
Scalpers who need quick alerts to catch price action early.

MLB Momentum IndicatorMLB Momentum Indicator is a no‐lookahead technical indicator designed to signal intraday trend shifts and potential reversal points. It combines several well‐known technical components—Moving Averages, MACD, RSI, and optional ADX & Volume filters—to deliver high‐probability buy/sell signals on your chart.
Below is an overview of how it works and what each part does:
1. Moving Average Trend Filter
The script uses two moving averages (fast and slow) to determine the primary trend:
isUpTrend if Fast MA > Slow MA
isDownTrend if Fast MA < Slow MA
You can select the MA method—SMA, EMA, or WMA—and customize lengths.
Why it matters: The indicator only gives bullish signals if the trend is up, and bearish signals if the trend is down, helping avoid trades that go against the bigger flow.
2. MACD Confirmation (Momentum)
Uses MACD (with user‐defined Fast, Slow, and Signal lengths) to check momentum:
macdBuySignal if the MACD line crosses above its signal line (bullish)
macdSellSignal if the MACD line crosses below its signal line (bearish)
Why it matters: MACD crossovers confirm an emerging momentum shift, aligning signals with actual price acceleration rather than random fluctuation.
3. RSI Overbought/Oversold Filter
RSI (Relative Strength Index) is calculated with a chosen length, plus Overbought & Oversold thresholds:
For long signals: the RSI must be below the Overbought threshold (e.g. 70).
For short signals: the RSI must be above the Oversold threshold (e.g. 30).
Why it matters: Prevents buying when price is already overbought or shorting when price is too oversold, filtering out possible poor‐risk trades.
4. Optional ADX Filter (Trend Strength)
If enabled, ADX must exceed a chosen threshold (e.g., 20) for a signal to be valid:
This ensures you’re only taking trades in markets that have sufficient directional momentum.
Why it matters: It weeds out choppy, sideways conditions where signals are unreliable.
5. Optional Volume Filter (High‐Participation Moves)
If enabled, the indicator checks whether current volume is above a certain multiple of its moving average (e.g., 1.5× average volume).
Why it matters: High volume often indicates stronger institutional interest, validating potential breakouts or reversals.
6. ATR & Chandelier (Visual Reference)
For reference only, the script can display ATR‐based stop levels or a Chandelier Exit line:
ATR (Average True Range) helps gauge volatility and can inform stop‐loss distances.
Chandelier Exit is a trailing stop technique that adjusts automatically as price moves.
Why it matters: Though this version of the script doesn’t execute trades, these lines help you see how far to place stops or how to ride a trend.
7. Final Bullish / Bearish Signal
When all conditions (trend, MACD, RSI, optional ADX, optional Volume) line up for a long, a green “Long” arrow appears.
When all conditions line up for a short, a red “Short” arrow appears.
Why it matters: You get a clear, on‐chart signal for each potential entry, rather than needing to check multiple indicators manually.
8. Session & Date Filtering
The script allows choosing a start/end date and an optional session window (e.g. 09:30–16:00).
Why it matters: Helps limit signals to a specific historical backtest range or trading hours, which can be crucial for day traders (e.g., stock market hours only).
Putting It All Together
Primary Trend → ensures you trade in line with the bigger direction.
MACD & RSI → confirm momentum and avoid overbought/oversold extremes.
ADX & Volume → optional filters for strong trend strength & genuine interest.
Arrows → each potential buy (Long) or sell (Short) signal is clearly shown on your chart.
Use Cases
5‐Minute Scalping: Shorter RSI/MACD lengths to catch small, frequent intraday moves.
Swing Trading: Larger MAs, bigger RSI thresholds, and using ADX to filter only major trends.
Cautious Approach: Enable volume & ADX filters to reduce false signals in choppy markets.
Benefits & Limitations
Benefits:
Consolidates multiple indicators into one overlay.
Clear buy/sell signals with optional dynamic volatility references.
Flexible user inputs adapt to different trading styles/timeframes.
Limitations:
Like all technical indicators, it can produce false signals in sideways or news‐driven markets.
Success depends heavily on user settings and the particular market’s behavior.
Summary
The MLB Momentum Indicator combines a trend filter (MAs), momentum check (MACD), overbought/oversold gating (RSI), and optional ADX/Volume filters to create clear buy/sell arrows on your chart. This approach encourages trading in sync with both trend and momentum, and helps avoid suboptimal entries when volume or trend strength is lacking. It can be tailored to scalp micro‐moves on lower timeframes or used for higher‐timeframe swing trading by adjusting the input settings.

FVG Breakout/BreakdownThe FVG Breakout/Breakdown indicator is designed to identify potential breakout and breakdown opportunities in the market, based on the concept of Fair Value Gaps (FVGs). FVGs are areas where price moves too quickly, leaving behind gaps between candlesticks, often seen as areas of inefficiency or imbalance that the market tends to revisit.
Key Concepts:
Fair Value Gaps (FVG):
FVG occurs when a price gap is created between candlesticks, typically when the high of one candle is lower than the low of the previous candle (for a bearish FVG) or the low of one candle is higher than the high of the previous candle (for a bullish FVG).
These gaps represent an imbalance between buying and selling pressure, and the market often revisits them, making them valuable for identifying potential entry points.
Bullish FVG: This occurs when the low of the current candle is higher than the high of the previous candle.
Condition: low > high
Bearish FVG: This occurs when the high of the current candle is lower than the low of the previous candle.
Condition: high < low
Breakout/Breakdown Signals:
Breakout: A bullish breakout signal occurs when the price breaks above a defined resistance level after an FVG gap. This suggests that the market may continue moving higher.
Breakdown: A bearish breakdown signal occurs when the price breaks below a defined support level after an FVG gap. This suggests that the market may continue moving lower.
NWOG (New Week Opening Gap):
The NWOG can be used as an additional factor to confirm the FVG signal. The gap between Friday's close and Monday's open is a crucial level for identifying the start of a new move for the week.
NWOG helps to further refine the timing of breakout or breakdown signals, only triggering them when price moves relative to the Monday Open and shows a new direction.
Inside Bar Setup [as]Inside Bar Setup Indicator Description
The **Inside Bar Setup ** indicator is a powerful tool for traders to identify and visualize inside bar patterns on their charts. An inside bar pattern occurs when the current candle's high is lower than the previous candle's high, and the current candle's low is higher than the previous candle's low. This pattern can indicate a potential breakout or a continuation of the existing trend.
Key Features:
1. **Highlight Inside Bar Patterns:**
- The indicator highlights inside bar patterns with distinct colors for bullish and bearish bars. Bullish inside bars are colored with the user-defined bull bar color (default lime), and bearish inside bars are colored with the user-defined bear bar color (default maroon).
2. **Marking Mother Candle High and Low:**
- The high and low of the mother candle (the candle preceding the inside bar) are marked with horizontal lines. The high is marked with a green line, and the low is marked with a red line.
- These levels are labeled as "Range High" and "Range Low" respectively, with the labels displayed a few bars to the right for clarity. The labels have a semi-transparent background for better visibility.
3. **Target Levels:**
- The indicator calculates and plots potential target levels (T1 and T2) for both long and short positions based on user-defined multipliers of the mother candle's range.
- For long positions, T1 and T2 are plotted above the mother candle's high.
- For short positions, T1 and T2 are plotted below the mother candle's low.
- These target levels are optional and can be toggled on or off via the input settings.
4. **Customizable Inputs:**
- **Colors:**
- Bull Bar Color: Customize the color for bullish inside bars.
- Bear Bar Color: Customize the color for bearish inside bars.
- **Long Targets:**
- Show Long T1: Toggle the display of the first long target.
- Show Long T2: Toggle the display of the second long target.
- Long T1: Multiplier for the first long target above the mother candle's high.
- Long T2: Multiplier for the second long target above the mother candle's high.
- **Short Targets:**
- Show Short T1: Toggle the display of the first short target.
- Show Short T2: Toggle the display of the second short target.
- Short T1: Multiplier for the first short target below the mother candle's low.
- Short T2: Multiplier for the second short target below the mother candle's low.
5. **New Day Detection:**
- The indicator detects the start of a new day and clears the inside bar arrays, ensuring that the pattern detection is always current.
#### Usage:
- Add the indicator to your TradingView chart.
- Customize the inputs to match your trading strategy.
- Watch for highlighted inside bars to identify potential breakout opportunities.
- Use the marked range highs and lows, along with the calculated target levels, to plan your trades.
This indicator is ideal for traders looking to capitalize on inside bar patterns and their potential breakouts. It provides clear visual cues and customizable settings to enhance your trading decisions.
Note:
This indicator is based on famous 15 min inside bar strategy shared by Subashish Pani on his youtube channel Power of stocks. Please watch his videos to use this indicator for best results.

Pivot Extremes BreakoutI created the "Pivot Extremes Breakout" (PEB) indicator to easily spot breakout zones using pivot points. This tool comes from my need to anticipate market direction and capitalize on breakouts. PEB uses the last two pivot points to predict price paths and highlights potential breakout areas, adjusting for any timeframe. It simplifies seeing where the market might move next with color-coded lines and zones, aiming to improve your trading decisions.

NY Open Breakout Strategy - High Liquidity & Favorable RRR Pine Description:
The NY Open Breakout Strategy is an advanced Pine Script indicator tailored for the TradingView platform. This strategy is specifically designed to exploit the high liquidity found during the New York session opening in the Forex market. Its primary goal is to provide traders with an opportunity to engage in positions with lower risk and higher potential profits, thereby ensuring an advantageous risk-to-reward ratio (RRR).
Core Objectives:
Leveraging High Liquidity: Capitalizes on the significant market movements at the New York session opening, known for its high liquidity, to identify strong breakout signals.
Achieving Favorable RRR: By setting strategic stop-loss and take-profit levels, the strategy aims for a higher RRR. This approach can lead to overall profitability, even if the win rate is lower than the loss rate.
Functionality:
Dynamic Breakout Identification: Uses the first 15-minute candle’s high and low after NY open as benchmarks for detecting potential breakouts.
Customizable Stop-Loss & Take-Profit: Provides options to configure stop-loss at the last swing or the previous candle’s close. The take-profit levels are determined based on a favorable risk-reward ratio.
Visual Session Indicators: Includes distinct background coloring and vertical lines to mark the New York session for easy visibility.
Methodology:
This strategy hinges on the premise that the opening of the New York session often triggers key price movements due to an influx of trading activity. By focusing on these moments, our indicator aims to capture strong trends and breakout patterns. The carefully calibrated stop-loss and take-profit settings ensure that each trade aims for a higher potential reward compared to the risk undertaken.
Unique Features:
Enhanced Risk Management: With adaptable risk-reward settings, traders can tailor their trading strategies to align with individual risk appetites.
Personalized User Experience: Offers a range of customizable settings for visual elements, allowing traders to adjust the look and feel of the indicator to their preferences.
Usage Guidelines:
Customize the indicator settings, including the stop-loss reference and risk-reward ratio, to match your trading style.
Watch for 'Buy Enter' and 'Sell Enter' signals during the New York session opening.
Utilize the displayed stop-loss and take-profit levels to effectively manage each trade.
This NY Open Breakout Strategy is ideal for traders who prioritize efficient risk management while aiming to capitalize on the high liquidity periods of the Forex market. The strategy is designed to be robust, providing a pathway to profitability even in scenarios where the number of losing trades surpasses winning ones, thanks to its emphasis on a high risk-to-reward ratio.

Long-Only Opening Range Breakout (ORB) with Pivot PointsIntraday Trading Strategy: Long-Only Opening Range Breakout (ORB) with Pivot Points
Background:
Opening Range Breakout (ORB) is a popular long-only trading strategy that capitalizes on the early morning volatility in financial markets. It's based on the idea that the initial price movements during the first few minutes or hours of the trading day can set the tone for the rest of the session. The strategy involves identifying a price range within which the asset trades during the opening period and then taking long positions when the price breaks out to the upside of this range.
Pivot Points are a widely used technical indicator in trading. They represent potential support and resistance levels based on the previous day's price action. Pivot points are calculated using the previous day's high, low, and close prices and can help traders identify key price levels for making trading decisions.
How to Use the Script:
Initialization: This script is written in Pine Script, a domain-specific language for trading strategies on the TradingView platform. To use this script, you need to have access to TradingView.
Apply the Script: You can do this by adding it to your favorites, then selecting the script in the indicators list under favorites or by searching for it by name under community scripts.
Customize Settings: The script allows you to customize various settings through the TradingView interface. These settings include:
Opening Session: You can set the time frame for the opening session.
Max Trades per Day: Specify the maximum number of long trades allowed per trading day.
Initial Stop Loss Type: Choose between using a percentage-based stop loss or the previous candles low for stop loss calculations.
Stop Loss Percentage: If you select the percentage-based stop loss, specify the percentage of the entry price for the stop loss.
Backtesting Start and End Time: Set the time frame for backtesting the strategy.
Strategy Signals:
The script will display pivot points in blue (R1, R2, R3, R4, R5) and half-pivot points in gray (R0.5, R1.5, R2.5, R3.5, R4.5) on your chart.
The green line represents the opening range.
The script generates long (buy) signals based on specific conditions:
---The open price is below the opening range high (h).
---The current high price is above the opening range high.
---Pivot point R1 is above the opening range high.
---It's a long-only strategy designed to capture upside breakouts.
---It also respects the maximum number of long trades per day.
The script manages long positions, calculates stop losses, and adjusts long positions according to the defined rules.
Trailing Stop Mechanism
The script incorporates a dynamic trailing stop mechanism designed to protect and maximize profits for long positions. Here's how it works:
1. Initialization:
The script allows you to choose between two types of initial stop loss:
---Percentage-based: This option sets the initial stop loss as a percentage of the entry price.
---Previous day's low: This option sets the initial stop loss at the previous day's low.
2. Setting the Initial Stop Loss (`sl_long0`):
The initial stop loss (`sl_long0`) is calculated based on the chosen method:
---If "Percentage" is selected, it calculates the stop loss as a percentage of the entry price.
---If "Previous Low" is selected, it sets the stop loss at the previous day's low.
3. Dynamic Trailing Stop (`trail_long`):
The script then monitors price movements and uses a dynamic trailing stop mechanism (`trail_long`) to adjust the stop loss level for long positions.
If the current high price rises above certain pivot point levels, the trailing stop is adjusted upwards to lock in profits.
The trailing stop levels are calculated based on pivot points (`r1`, `r2`, `r3`, etc.) and half-pivot points (`r0.5`, `r1.5`, `r2.5`, etc.).
The script checks if the high price surpasses these levels and, if so, updates the trailing stop accordingly.
This dynamic trailing stop allows traders to secure profits while giving the position room to potentially capture additional gains.
4. Final Stop Loss (`sl_long`):
The script calculates the final stop loss level (`sl_long`) based on the following logic:
---If no position is open (`pos == 0`), the stop loss is set to zero, indicating there is no active stop loss.
---If a position is open (`pos == 1`), the script calculates the maximum of the initial stop loss (`sl_long0`) and the dynamic trailing stop (`trail_long`).
---This ensures that the stop loss is always set to the more conservative of the two values to protect profits.
5. Plotting the Stop Loss:
The script plots the stop loss level on the chart using the `plot` function.
It will only display the stop loss level if there is an open position (`pos == 1`) and it's not a new trading day (`not newday`).
The stop loss level is shown in red on the chart.
By combining an initial stop loss with a dynamic trailing stop based on pivot points and half-pivot points, the script aims to provide a comprehensive risk management mechanism for long positions. This allows traders to lock in profits as the price moves in their favor while maintaining a safeguard against adverse price movements.
End of Day (EOD) Exit:
The script includes an "End of Day" (EOD) exit mechanism to automatically close any open positions at the end of the trading day. This feature is designed to manage and control positions when the trading day comes to a close. Here's how it works:
1. Initialization:
At the beginning of each trading day, the script identifies a new trading day using the `is_newbar('D')` condition.
When a new trading day begins, the `newday` variable becomes `true`, indicating the start of a new trading session.
2. Plotting the "End of Day" Signal:
The script includes a plot on the chart to visually represent the "End of Day" signal. This is done using the `plot` function.
The plot is labeled "DayEnd" and is displayed as a comment on the chart. It signifies the EOD point.
3. EOD Exit Condition:
When the script detects that a new trading day has started (`newday == true`), it triggers the EOD exit condition.
At this point, the script proceeds to close all open positions that may have been active during the trading day.
4. Closing Open Positions:
The `strategy.close_all` function is used to close all open positions when the EOD exit condition is met.
This function ensures that any remaining long positions are exited, regardless of their current profit or loss.
The function also includes an `alert_message`, which can be customized to send an alert or notification when positions are closed at EOD.
Purpose of EOD Exit
The "End of Day" exit mechanism serves several essential purposes in the trading strategy:
Risk Management: It helps manage risk by ensuring that positions are not left open overnight when markets can experience increased volatility.
Capital Preservation: Closing positions at EOD can help preserve trading capital by avoiding potential adverse overnight price movements.
Rule-Based Exit: The EOD exit is rule-based and automatic, ensuring that it is consistently applied without emotions or manual intervention.
Scalability: It allows the strategy to be applied to various markets and timeframes where EOD exits may be appropriate.
By incorporating an EOD exit mechanism, the script provides a comprehensive approach to managing positions, taking profits, and minimizing risk as each trading day concludes. This can be especially important in volatile markets like cryptocurrencies, where overnight price swings can be significant.
Backtesting: The script includes a backtesting feature that allows you to test the strategy's performance over historical data. Set the start and end times for backtesting to see how the long-only strategy would have performed in the past.
Trade Execution: If you choose to use this script for live trading, make sure you understand the risks involved. It's essential to set up proper risk management, including position sizing and stop loss orders.
Monitoring: Monitor the long-only strategy's performance over time and be prepared to make adjustments as market conditions change.
Disclaimer: Trading carries a risk of capital loss. This script is provided for educational purposes and as a starting point for your own long-only strategy development. Always do your own research and consider seeking advice from a qualified financial professional before making trading decisions.

Flag FinderFlag Finder Indicator is a technical analysis tool to identify bull and bear flags.
What are flags
Flags are continuation patterns that occur within the general trend of the security. A bull flag represents a temporary pause or consolidation before price resumes it's upward movement, while a bear flag occurs before price continues its downward movement.
Both flag patterns consist of two components:
The Pole
The Flag
The pole is the initial strong upward surge or decline that precedes the flag. The pole is usually a fast move accompanied by heavy volume signaling significant buying or selling pressure.
The flag is then formed as price consolidates after the initial surge or decline from the pole. For a bull flag price will drift slightly downward to sideways, a bear flag will drift upward to sideways. The best flags often see volume dry up during this phase of the pattern.
Indicator Settings
Both components are fully customizable in the indicator so the user can adjust for any time frame or volatility. Select the minimum and maximum accepted limits from the % gain loss required for the pole, the maximum acceptable flag depth or rally and the minimum and maximum number of bars for each component.
Colors and what components are visible at any time are also user controlled.
Trading flags
Traders typically use flags to enter on breakouts. A breakout occurs when price moves above the left side high of a bull flag or below the left side low of a bear flag.
Alerts
The Flag Finder allows for four different types of alerts
New Bull Flag
New Bear Flag
Bull Flag Breakout
Bear Flag Breakout
Pine Script
On top of the indicator identifying bull and bear flags, throughout the source code I left notes on nearly every line to help anyone who is interested in pine script see my thought process and explain which each line of code does. This code isn't too complex, but it offers a look into many different concepts one might use when writing pinescript such as:
input groups
declaring and reassigning variables
for loops
plotshapes & lines
alerts

Range H/L Buy and Sell SignalThe "Range H/L Buy and Sell Signal" indicator is designed to identify potential buy and sell signals based on a specified price range and market volatility. This indicator can be used in the TradingView platform to assist traders in making informed decisions.
The indicator allows customization of several parameters to adapt to different trading strategies. These parameters include the start and end times for the price range, the volatility threshold, and the desired breakout conditions.
To begin, the indicator calculates the range start and end timestamps based on the provided hours and minutes. This defines the time period within which the indicator will analyze price movements.
Next, the indicator determines the highest high (High) and lowest low (Low) within the specified price range. These levels represent the upper and lower boundaries of the range and act as potential breakout points.
Volatility is also taken into account to filter out false signals. The indicator calculates the true range and the average true range over a period of 14 bars. The true range measures the price range from the current high to low, while the average true range provides an indication of market volatility.
Based on the breakout conditions and the volatility threshold, buy and sell signals are generated. A buy signal occurs when the closing price crosses above the High and the true range is greater than the volatility threshold multiplied by the average true range. Conversely, a sell signal is triggered when the closing price crosses below the Low and the true range exceeds the volatility threshold multiplied by the average true range.
The indicator visually displays the High and Low levels as plotted lines on the chart. Additionally, it marks the buy signals with green labels labeled "BUY" below the corresponding bars and the sell signals with red labels labeled "SELL" above the bars.
It is important to note that this indicator should be used in conjunction with other technical analysis tools and indicators for comprehensive market analysis. Trading always carries risks, and it is crucial to exercise caution and conduct thorough analysis before making any trading decisions.
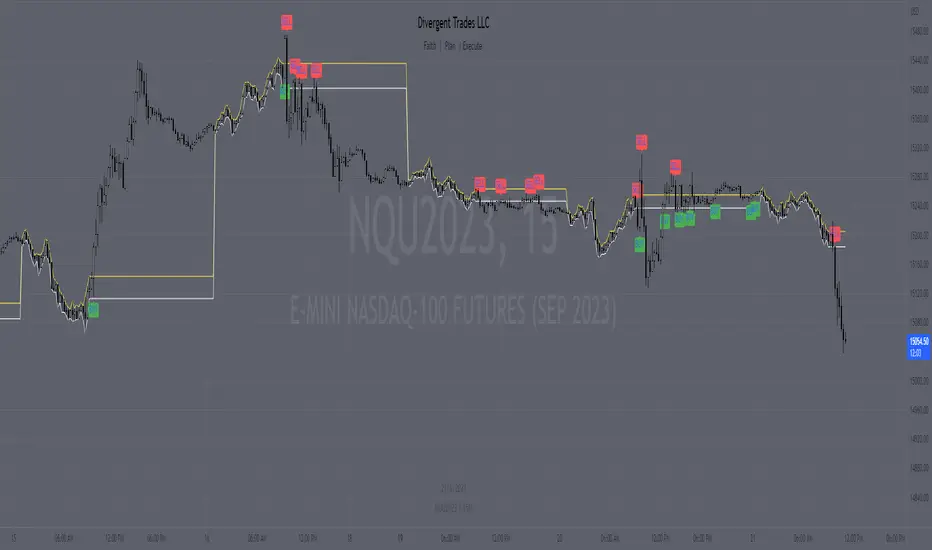
Divergent Trades LLC:
Disclaimer: The information provided by the Divergent Trades LLC indicator is for educational and informational purposes only. It should not be considered financial advice or a recommendation to buy, sell, or trade any financial instrument. Divergent Trades LLC is not responsible for any losses incurred as a result of using this indicator. Trading in the financial markets carries a high level of risk and may not be suitable for all investors. Before making any investment decisions, please consult with a financial advisor and do your own due diligence. Past performance is not indicative of future results. By using the Divergent Trades LLC indicator, you acknowledge that you have read and understand this disclaimer and agree to its terms and conditions.
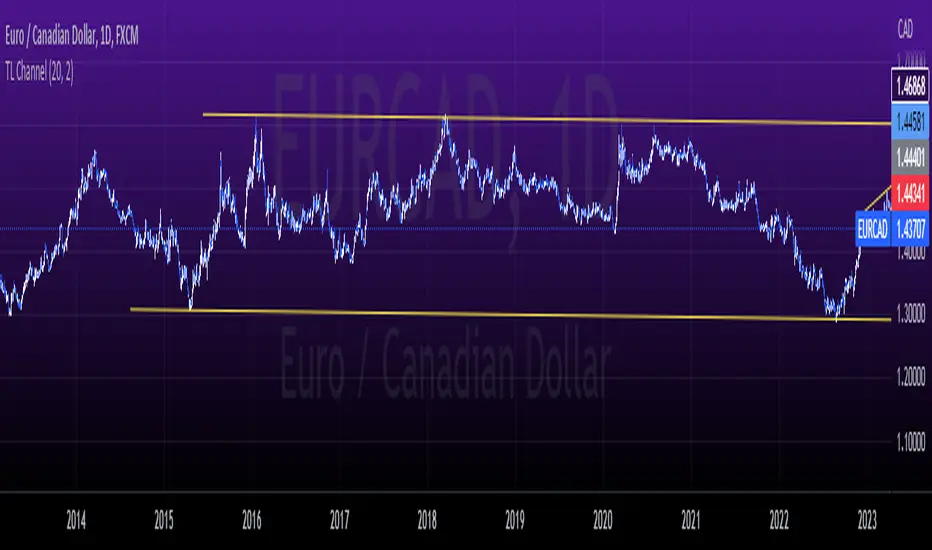
tlc with False BreakoutThe strategy aims to identify a trend line channel with the potential for a false breakout. Here's an explanation of the strategy:
The script starts by defining the input parameters. The lookback parameter determines the number of previous bars to consider for detecting the trend lines, and the threshold parameter controls the sensitivity of the trend line detection.
The script then initializes variables to store the trend lines, tap count, and the false breakout signal.
Inside the loop, the script iterates over the specified number of bars (lookback) to identify the trend lines. It checks if the current high is greater than the previous and next highs to identify an upper trend line and sets it using the line.new function. Similarly, it checks if the current low is smaller than the previous and next lows to identify a lower trend line and sets it.
The script also keeps track of the price levels of the upper and lower trend lines using the variables upperTrendLinePrice and lowerTrendLinePrice. These price levels are obtained using the line.get_y1 function.
After the fourth tap (when tapCount is equal to 4), the script checks if the current close price is above the upper trend line or below the lower trend line. If this condition is met, it sets the falseBreakout variable to true, indicating a potential false breakout.
Finally, the script plots a shape marker (plotshape) when a false breakout occurs. This is represented by an orange label displayed below the bar.
At the end of the script, the line.delete function is used to remove the old trend lines when the script reaches the last bar (barstate.islast).
By using this strategy, you can visually identify trend line channels where the upper and lower lines touch higher highs or lower highs and higher lows or lower lows. Additionally, it provides a false breakout signal when the price breaks above the upper trend line or below the lower trend line on the fifth tap.
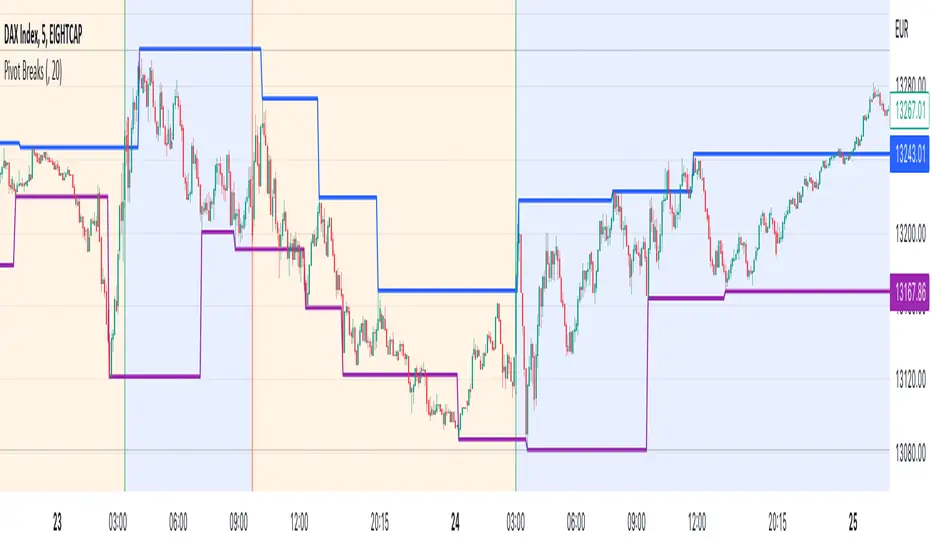
Pivot BreaksThere are built-in and published Pivot Point High Low indicators in Public Library. As far as I see none of them show the breaking candles or the trend.
with the closing price crossing over the previous / current pivot high A bearish breakOut can either indicate the progression of a lower high pattern or a trend reversal
with the closing price crossing under the previous / current pivot low A bullish breakOut can either indicate the progression of a higher low pattern or a trend reversal
This indicator can show the first breaking candle or all breaking candles . It Can also show The Breaking state (Trend) based on the last break.
Alert Mode is included, colour can be customised, Higher TimeFrame can be requested (it Can also cause repainting)
Inputs are optional as possible so have fun with it
Disclaimer: Scripts that I post publicly are experimental. They are not financial advices. Always backtest your ideas using your own methodologies.
Linear Regression & RSI Multi-Function Screener with Table-LabelHi fellow traders..
Happy to share a Linear Regression & RSI Multi-Function Custom Screener with Table-Labels...
The Screener scans for Linear Regression 2-SD Breakouts and RSI OB/OS levels for the coded tickers and gives Summary alerts
Uses Tables (dynamica resizing) for the scanner output instead of standard labels!
This Screener cum indicator collection has two distinct objectives..
1. Attempt re-entry into trending trades.
2. Attempt Counter trend trades using linear regression , RSI and Zigzag.
Briefly about the Screener functions..
a. It uses TABLES as Labels a FIRST for any Screener on TV.
b. Tables dynamically resize based on criteria..
c. Alerts for breakouts of the UPPER and the LOWER regression channels.(2 SD)
d. In addition to LinReg it also Screens RSI for OB/OS levels so a multifunction Screener.
e. Of course has the standard summary Alerts and programmable format for Custom functions.
f. Uses only the inbuilt Auto Fib and Lin Reg code for the screener.(No proprietary stuff)
g. The auto Zigzag code is derived(Auto fib).
Question what are all these doing in a single screener ??
ZigZag is very useful in determining Trend Up or Down from one Pivot to another.
So Once you have a firm view of the Current Trend for your chosen timeframe and ticker…
We can consider few possible trading scenarios..
a. Re-entry in an Up Trend - Combination of OS Rsi And a Lower Channel breach followed by a re-entry back into the regression channel CAN be used as an effective re-entry.
b. Similarily one can join a Down Trend on OB Rsi and Upper Channel line breach followed by re-entry into the regression channel.
If ZigZag signals a range-bound market, bound within channel lines then the Upper breakout can be used to Sell and vice-versa!
In short many possibilities for using these functions together with Scanner and Alerts.
This facilitates timely PROFITABLE Trending and Counter trend opportunities across multiple tickers.
You must give a thorough READ to the various available tutorials on ZigZag / Regression and Fib retracements before attempting counter trend trades using these tools!!
A small TIP – Markets are sideways or consolidating 70% of the time!!
Acknowledgements: - Thanks a lot DGTRD for the Auto ZigZag code and also for the eagerness to help wherever possible..Respect!!
Disclaimer: The Alerts and Screener are just few tools among many and not any kind of Buy/Sell recommendations. Unless you have sufficient trading experience please consult a Financial advisor before investing real money.
*The alerts are set for crossovers however for viewing tickers trading above or below the channel use code in line 343 and 344 after setting up the Alerts!
** RSI alerts are disabled by default to avoid clutter, but if needed one can activate code lines 441,442,444 and 445
Wish you all, Happy Profitable Trading!

SMT - Smart Money Thursday Boxes
The Smart Money Trading Thursday - is a very specific trading system. You only trade it on a Thursday.
The script/indicator will color Thursdays as two boxes. If you just want one color, use same color for
both boxes. The boxes is there to indicate London/New York sessions.
SETTINGS
In the setting you find a numeric value as 1700-0400:5
The "5" indicate Thursday. You can change that if you prefer to color another specific day.
For example "4" would indicate Wednesday. And you can change the hours to fit your
sessions and trading style.
You can also use the 2 boxes on different days. If you for example would like to color up
London for Wednesday and Thursday. Then set hours to fit London session and adjust the
:5 to 4 on the 1st box and 5 on the 2nd.
HOW TO USE IT?
The Smart Money works in a way retail trading does not. Smart Money has an objective
to locate retail patterns, where there will be a lot of stop loss volume to be grabbed.
So when a retail trader see a setup like a "Double Top / Bottom". The Institutional
will see $$$ of dumb money, ready to be taken. The best moves happen on a Thursday
but if you are a skilled trader, you can see the move also occur on Wednesday or Friday.
The first thing that will happen, is that the Smart Money Breaks out of session. Meaning
they will leave the current weeks high/low range. To start collect negative contracts
of the retail volume.
When you see that happen. And you see a breakout that consist of 4 in a row 1 hour
chart candles. Then you have your first rule meet.
#1 Thursday breakout of current weeks high/low. And the move is a clean 4 hour move
as 4x H1 candles. The move can start within range. But must end clearly outside.
Visual Example:
#2 Next, we await an engulf at peak or near peak. That is where Institutional
may have problem to match any more contracts, and since they used their own
money to make this move. They must now mitigate orders, and return back to
the original retail pattern as most retail traders are now stopped out.
(Normally this is a long/clear candle out of range. they rarely go lower
then retail traders entry in the 1st push. This to not save any souls :)
#3 Price returns back to where the breakout from the retail happens.
You can now take your profit as a Smart Money Trader. Trading with less risk,
you can take profit of the return of that latest 4x H1 candle move. (Order
Block)
CONCLUSION
The best trade is when you can combine a retail pattern, followed by a
breakout which holds 4x 1 hour candles in the outbreak direction.
2nd best is when you have the 4x H1 breakout and really no clear retail
pattern. Still is the same game. Just not as clear as the one above.
Study the steps in this image and you see what to look after:
Good Luck with your trading!
Regards,
The Hunter Trading Group

Big Breakout IndexBig Breakout Index is a great indicator for detecting breakouts. When the current close breaks out of consolidation, the indicator will tell you.
Green - Buy
Red - Sell

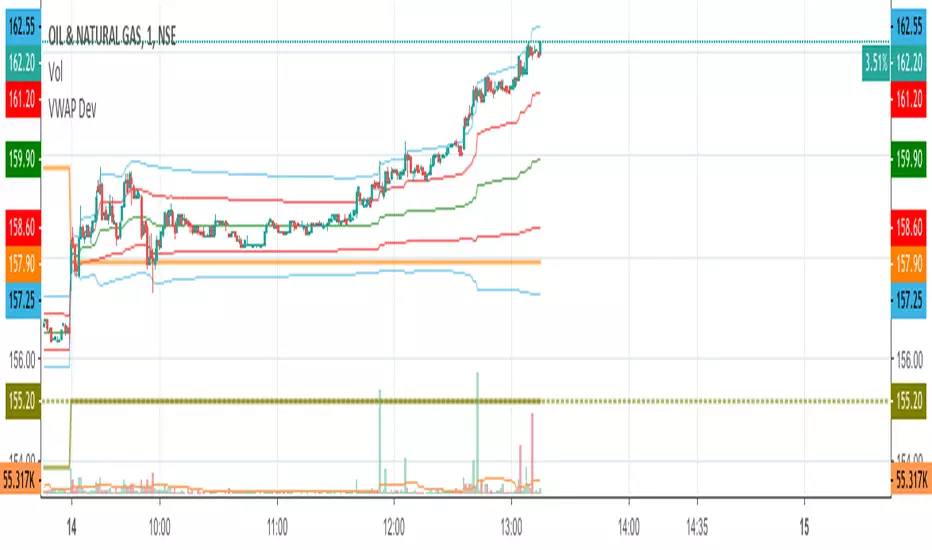
VWAP Stdev BandsCurrent price always obeys VWAP and is very useful for intraday traders. The Price will never go beyond the second deviation of VWAP at any point of time. The deviation bands are also very useful in predicting the volatility of the script.
Breakout trades can be taken based on the previous day's VWAP and it's deviations.
One can say that the stock has experienced breakout if current price crosses the fourth deviation of the previous day's VWAP or price bounces off that level, the price movement will be rapid if this occurs providing a good trading opportunity with low risk-reward ratio.
Systematic TF IndicatorThis is a simple trend following indicator which works off moving averages for trend bias and breakouts for entry.

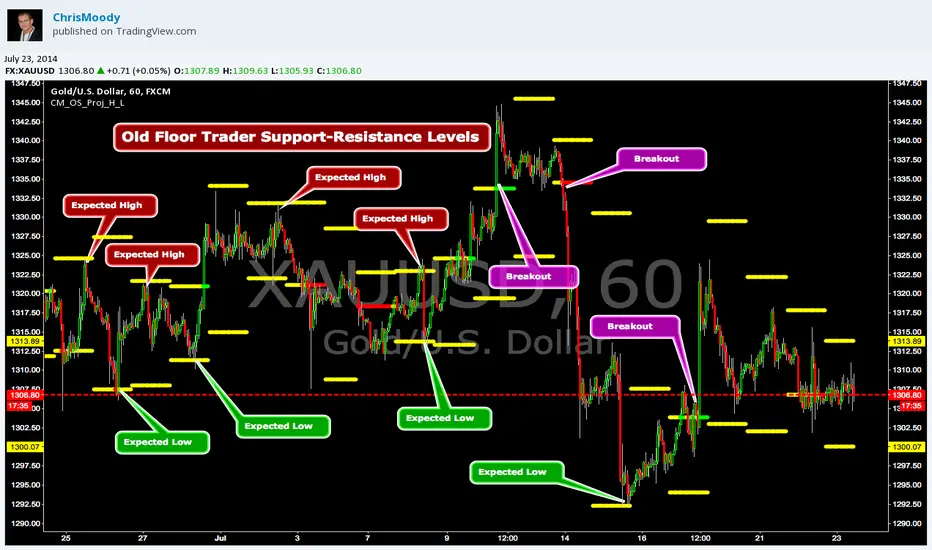
CM_OldSchool_Projected_high_LowHeard this story from Larry Williams…the trader who holds the record for winning the U.S. Trading Championship by turning $10K in to 2 Million.
A trader named Owen Taylor developed this formula as a Floor Trader before to calculate the Projected High and Low of the next day.
The formula worked so well…Owen charged other Traders 1K to get it.
I was pretty impressed with the results…so I coded it for the Weekly, Monthly, Quarterly, and Yearly Projected High Low.
While Owen considered these levels to be major support and resistance, Larry has developed many strategies based on the Breakout of the Projected High Low.
Therefore I coded it so the Levels would plot Yellow, and change to Green if the Projected High was taken out, and Red if the Projected Low was taken out.
***I’ve noticed on many instruments, Stocks, Index’s, Forex etc., depending on the instrument it works great as Support/Resistance or Breakouts.
***On a Daily Chart put the Quarterly and Yearly levels on SPY and EURUSD and go back about 10 years. Levels are pretty accurate.
VWAP BB Breakout + DMI MomentumI decided to code a single indicator that has some of my most used indicators.
I encourage that you have read up on VWAP, Bollinger Bands, ADX/DMI to understand how they function.
VWAP + Bollinger 1σ Breakout + DMI/ADX Scalping Strategy (NASDAQ)
This strategy is designed for single-chart, intraday scalping on the NASDAQ, focusing on volatility expansion in the direction of market control. It avoids higher-timeframe confirmation to eliminate lag and reacts only when price shows acceptance and momentum.
Core Concepts
VWAP defines market control and trade direction
Bollinger Bands (20, 1σ) identify early volatility expansion
DMI/ADX (10 / 5) confirms directional momentum and strength
The strategy trades breakouts that are supported by both bias and momentum, filtering out low-quality moves and chop.
Trade Rules
Long Setup
Price is above VWAP
Candle closes above the upper Bollinger 1σ band
+DI > –DI
ADX rising or above strength threshold
Short Setup
Price is below VWAP
Candle closes below the lower Bollinger 1σ band
–DI > +DI
ADX rising or above strength threshold
Trades are taken only on candle close to confirm acceptance.
Risk & Trade Management
Trades are avoided near VWAP to reduce chop
Stops are placed just inside the Bollinger 20 SMA or beyond the breakout candle
Partial profits can be taken at the 2σ band
Exits are considered when ADX flattens or DMI flips
Market Conditions
Best suited for:
High-liquidity sessions (NY open and main session)
Trending or expanding volatility environments
Avoid during:
Flat VWAP conditions
Bollinger Band compression
Low ADX / range-bound markets
Strategy Philosophy
This is a reactive momentum strategy, not predictive.
It waits for price to prove direction and strength, then participates in the move rather than anticipating it.

ORB Breakout Strategy📊 Overview
📈 Systematic intraday Opening Range Breakout (ORB) strategy
🧭 Designed for index CFDs (e.g. US500)
⏱️ Optimized for 5-minute charts during regular trading hours
🛡️ Strict risk management and position sizing
🚦 Maximum one trade per day
💡 Core Idea
🌅 The market establishes a key price range shortly after the open
🚀 A confirmed breakout from this opening range can signal directional momentum
🎯 The strategy trades only confirmed breakouts with predefined risk
📐 Opening Range Definition
⏰ Opening range is defined between 09:30 and 09:45 (exchange time)
🕯️ Uses the first three 5-minute candles of the session
⬆️ Opening Range High is the highest high of those candles
⬇️ Opening Range Low is the lowest low of those candles
🟢 Long Trade
📊 A 5-minute candle closes above the Opening Range High
🟩 A Fair Value Gap (FVG) exists relative to the candle 10 minutes earlier
🧲 A buy limit order is placed at the Opening Range High
🔴 Short Trade
📉 A 5-minute candle closes below the Opening Range Low
🟥 A Fair Value Gap (FVG) exists relative to the candle 10 minutes earlier
🧲 A sell limit order is placed at the Opening Range Low
🛑 Stop Loss
📉 Long trades use the low of the candle 10 minutes before the breakout
📈 Short trades use the high of the candle 10 minutes before the breakdown
🎯 Take Profit
⚖️ Fixed reward-to-risk ratio of 2:1
📏 Take profit distance equals two times the stop loss distance
💰 Position Sizing
💵 Fixed dollar risk per trade (default: $2,000)
📐 Position size is calculated dynamically based on stop loss distance
🔁 Risk remains consistent across changing volatility conditions
⏳ Trade Management Rules
🚦 Maximum one trade per day, including same-bar entries and exits
🕛 No new entries after 12:00 (exchange time)
⏰ All open positions are closed at 15:50
❌ Pending orders are cancelled after the entry cutoff or at session end
⚙️ Execution & Costs
💸 Commission model can be configured in the strategy settings
🧪 Backtests use TradingView Strategy Tester mechanics
📝 Notes
📚 This is a rules-based trading strategy, not a signal service
🔍 Results depend on instrument, broker feed, spreads, and commissions
🧠 Forward testing is strongly recommended before live trading
⚠️ Disclaimer
📖 This script is provided for educational and research purposes only
🚫 It does not constitute financial advice
🔥 Trading leveraged instruments involves significant risk
