yutas_BOindicator_β1_simpleVer.1.0
・High-low sign indicator for binary option only. (β_simple version)
・Signs are displayed where repulsion is likely to occur on special oscillators.
・You can expect a rebound in the next candle after you sign.
・The filter can be in a certain numerical range.
・We recommend cross-yen for currency pairs.
・バイナリーオプション専用ハイローサインインジケーター。 (ベータシンプルバージョン)
・特殊なオシレーターでの反発しやすい所にサインを表示します。
・サインが出た次のローソクでの反発が期待できます。
・フィルターとして一定数値範囲内という条件も可能。
・通貨ペアはクロス円がオススメです。
"binary" için komut dosyalarını ara

10X Trading System10X Trading System (Non Repaint)
TradingView Account Needed: Free
Not satisfied with your trading results so far? This may help:
The 10X Trading System helps you identify tops, bottoms and market direction — quickly and accurately.
The strategy behind its accuracy is the fact that it combines price action and multiple market timing algorithms to determine these significant turning points in the markets.
That way, you can be sure you have the best chance to get the best entry and exit points with perfect timing, and hopefully extract more profits from the markets than anybody else.
Once the 10X Trading system has spotted a possible top or bottom, it clearly displays these Buy or Sell alerts on your charts… showing you exactly where this may occur.
You can activate alerts to never miss a signal.
How to use the signals and alerts:
10X Trading System automatically analyze price action and multiple market timing algorithms to give you a signal when there's a good trade.
Works on all markets on all time frames so it's suitable for binary, scalping, day and swing trading.
10X Trading System allow you to get the best entry and exit points with perfect timing.
If you want more details, the link is in the signature.
Disclaimer:
Past performance is not indicative of future performance. No representation is being made that any results discussed within the service and its related media content will be achieved. All opinions, news, research, analyses, prices or other information is provided as general market commentary and not as investment advice. TradingWalk, their members, shareholders, employees, agents, representatives and resellers do not warrant the completeness, accuracy or timeliness of the information supplied, and they shall not be liable for any loss or damages, consequential or otherwise, which may arise from the use or reliance of the TradingWalk service and its content. © 2019 TradingWalk.
TradingWalk indicators are built for TradingView. TradingWalk is on no way a part of TradingView.
Two Bar Break Line Alerts R1.0 by JustUncleLThis indicator with default settings is designed for BINARY OPTIONS trading. The indicator can also be used for Forex trading with some setting changes. The script shows Two Bar Pullback Break lines and alerts when those Break lines are Touched (broken) creating a short term momentum entry condition.
For a Bullish Break (Green Up Arrow) to occur: first must have two (or three) consecutive bear (red) candles which is followed by a bull (green) candle creating a pivot point. The breakout occurs then the High of the current Bull (green) exceeds the highest point of the previous two (or three) pivotal bear candles. The green channel Line shows where the current Bullish BreakOut occurs.
For a Bearish Break (Red Down Arrow) to occur: first must have two (or three) consecutive bull (green) candles which is followed by a bear (red) candle creating a pivot point. The breakout occurs when the Low of the current Bear (red) drops below the lowest point of the previous two (or three) pivotal Bull candles. The red channel Line shows where the current Bearish BreakOut occurs.
The break Line Arrows can optionally be filtered by the Coloured MA (enabled by default), a longer term directional MA (disabled by default) and/or a MACD condition (enabled by default) as a momentum filter.
You can optionally select three Bar break lines instead of two. The three bar break lines are actually equivalent to Guppy's Three Bar Count Back Line method for trade entries (see Guppy's video reference below).
Included in this indicator is an ability to display some basic Binary Option statistics, when enabled (enabled by default) it shows Successful Bars in Yellow and failed Bars in Black and the last Nine numbers on the script title line represent the Binary option Statistics in order:
%ITM rate
Total orders
Successful Orders
Failed Orders
Total candles tested
Candles per Day
Trades per Day
Max Consecutive Wins
Max Consecutive Losses
You can start the Binary Option statistics from a specific Date, which is handy for checking more recent history.
HINTS:
BINARY OPTIONS trading: use 5min, 15m, 1hr or even Daily charts. Trade after the price touches one of the Breakout lines and the Arrow first appears. Wait for the price to come back from Break Line by 1 or 2 pips, the alert arrow must stay on and candle change to black, then take Binary trade expiry End of Candle. If price pull back and arrow turns off, don't trade this candle, move on you probably don't have momentum, there will be plenty of other trigger events. The backtesting results are good with ITM rates 65% to 72% on many currency pairs, commodities and indices. Realtime trading has confirmed the backtesting results and they could even be bettered, provided you are selective on which signals to trade (strong MACD support etc), that you are patient and disciplined to this trading method.
FOREX trading: the default settings should work with scalping. For longer term trades try with settings change to a more standard MACD filter or slower to catch the longer term momentum swings and the idea would be to trade the first Break Line alert that occurs after a decent Pullback in the direction of the trend. Setting the SL to just above/below the Pivot High/Low and set target to two or three times SL.
References:
"Fundamentals of Price Action Trading for Forex, Stocks, Options and Futures" video:
www.youtube.com
Other videos by "basecamptrading" on Naked Trading.
"Taking Profits in Today's Market by Daryl Guppy" video:
www.youtube.com

Bernoulli Process - Binary Entropy FunctionThis indicator is the Bernoulli Process or Wikipedia - Binary Entropy Function . Within Information Theory, Entropy is the measure of available information, here we use a binary variable 0 or 1 (P) and (1-P) (Bernoulli Function/Distribution), and combined with the Shannon Entropy measurement. As you can see below, it produces some wonderful charts and signals, using price, volume, or both summed together. The chart below shows you a couple of options and some critical details on the indicator. The best part about this is the simplicity, all of this information in a couple of lines of code.
Using the indicator:
The longer the Entropy measurement the more information you are capturing, so the analogy is, the shorter the signal, the less information you have available to utilize. You'll run into your Nyquist frequencies below a length of 5. I've found values between 9 and 22 work well to gather enough measurements. You also have an averaging summation that measures the weight or importance of the information over the summation period. This is also used for highlighting when you have an information signal above the 5% level (2 sigma) and then can be adjusted using the Percent Rank Variable. Finally, you can plot the individual signals (Price or Volume) to get another set of measurements to utilize. As can be seen in the chart below, the volume moves before price (but hopefully you already knew that)
At its core, this is taking the Binary Entropy measurement (using a Bernoulli distribution) for price and volume. I've subtracted the volume from the price so that you can use it like a MACD, also for shorter time frames (7, 9, 11) you can get divergences on the histogram. These divergences are primarily due to the weekly nature of the markets (5 days, 10 days is two weeks,...so 9 is measuring the last day of the past two weeks...so 11 is measuring the current day and the past two weeks).
Here are a couple of other examples, assuming you just love BTC, Stocks, or FOREX. I fashioned up a strategy to show the potential of the indicator.
BTC-Strategy
Stock-Strategy (#loveyouNFLX)
FOREX - (for everyone hopped up on 40X leverage)

Ivan Gomes StrategyIG Signals+ - Ivan Gomes Strategy
This script is designed for scalping and binary options trading, generating buy and sell signals at the beginning of each candle. Although it is mainly optimized for short-term operations, it can also be used for medium and long-term strategies with appropriate adjustments.
How It Works
• The indicator provides buy or sell signals at the start of the candle, based on a statistical probability of candle patterns, depending on the timeframe.
• It is essential to enter the trade immediately after the signal appears and exit at the end of the same candle.
• If the first operation results in a loss (Loss), the script will send another trade signal at the start of the next candle. However, if the first trade results in a win (Gain), no new signal will be generated.
• The signals follow cycles of 3 candles, regardless of the timeframe. However, if a Doji candle appears, the cycle is interrupted, and no signals will be generated until the next valid cycle starts.
• The strategy consists of up to two trades per cycle: if the first trade is not successful, the second trade serves as an additional attempt to recover.
Key Points to Consider
1. Avoid trading in sideways markets – If price levels do not fluctuate significantly, the accuracy of the signals may decrease.
2. Trade in the direction of the trend – Using Ichimoku clouds or other trend indicators can help confirm trend direction and improve signal reliability. If the market is in an uptrend (bullish trend) and the indicator generates a sell signal, the most prudent decision would be to wait for a buy signal that aligns with the main trend. The same applies to downtrends, where buy signals may be riskier.
These decisions should be based on chart reading and supported by other technical analysis tools, such as support and resistance levels, which indicate zones where price might face obstacles or reverse direction. Additionally, Fibonacci retracement levels can help identify possible pullback points within a trend. Moving averages are also useful for visualizing the general market direction and confirming whether an indicator signal aligns with the overall price structure. Combining these tools can increase trade accuracy and prevent unnecessary trades against the main trend, reducing risks.
3. Works based on probability statistics – The algorithm analyzes candle formations and their statistical probabilities depending on the timeframe to optimize trade entries.
4. Best suited for scalping and binary options – This strategy performs best in 1-minute and 5-minute timeframes, allowing for multiple trades throughout the day.
Technical Details
• The script detects the candle cycle and assigns an index to each candle to identify patterns and possible reversals.
• It recognizes reference candles, stores their colors, and compares them with subsequent candles to determine if a signal should be triggered.
• Doji candle rules are implemented to avoid false signals in indecisive market conditions. When a Doji appears, the script does not generate signals for that cycle.
• The indicator displays visual alerts and notifications, ensuring fast execution of trades.
Disclaimer
The IG Signals+ indicator was created to assist traders who struggle to analyze the market by providing objective trade signals. However, no strategy is foolproof, and this script does not guarantee profits.
Trading involves significant financial risk, and users should test it in a demo account before trading with real money. Proper risk management is crucial for long-term success.

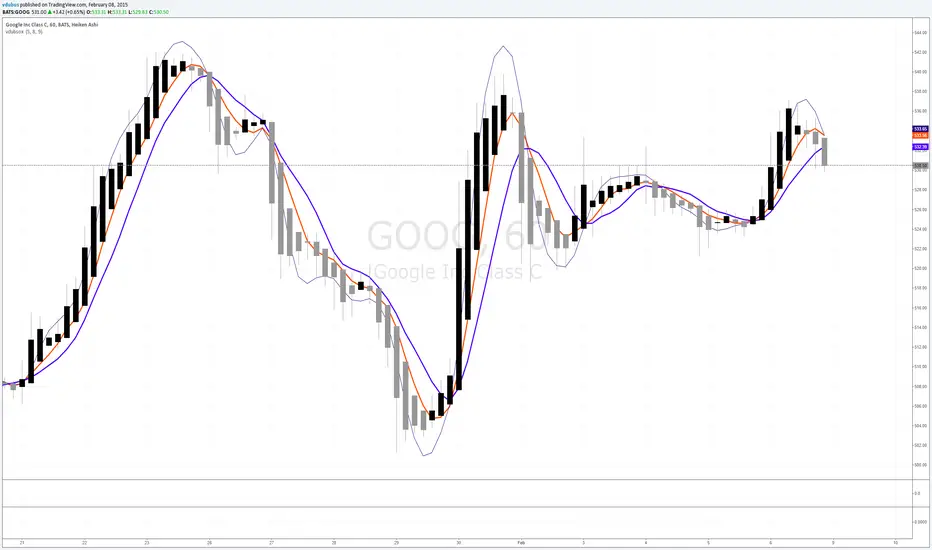
vdubsoxI've been asking for this concept for a while, a simple MA that rides the top side of the trend instead of the bottom, and by accident came across the 'Hull ma' on a TV blog post. I've added another two simple Moving averages to act as strength indicator with close proximity to the price.
The strategy is simple MA cross over but with the early indication using Hull ma gives you a heads up on trend / price reversal.
I'm using this in conjunction with BB set at 34. on a 1/3/5 min charts & Heiken Ashi to smooth out the noise with awesome success trading Binary options.
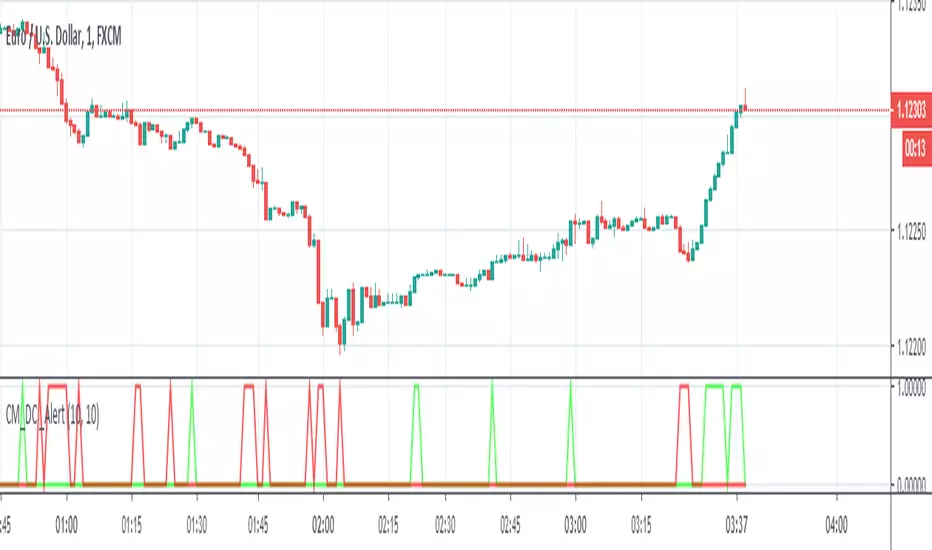
BO - CCI Arrow with AlertBO - CCI Arrow with Alert base on CCI indicator to get signal for trade Binary Option.
Rules of BO - CCI Arrow with Alert below:
A. Setup Menu
1. cciLength:
* Default CCI lenght = 14
2. Linear Regression Length:
* Periods to calculate Linear Regression of CCI,
* Default value = 5
3. Extreme Level:
* Default top extreme level = 100
* Default bottom extreme level = -100
4. Filter Length:
* Periods to define highest or lowest Linear Regression
* Default value = 6
B. Rule Of Alert Bar
1. Put Alert Bar
* Current Linear Regression Line created temporrary peak
* Peak of Linear Regression Line greater than Top Extreme Level (100)
* Previous Linear Regression is highest of Filter Length (6)
* Previous Linear Regression is greater than previous peak of Linear Regression Line
* Current price greater than previous low
* CCI(14) less than Linear Regression Line
2. Call Alert Bar
* Current Linear Regression Line created temporrary bottom
* Bottom of Linear Regression Line less than Bottom Extreme Level (-100)
* Previous Linear Regression is lowest of Filter Length (6)
* Previous Linear Regression is less than previous bottom of Linear Regression Line
* Current price less than previous lhigh
* CCI(14) greater than Linear Regression Line
B. Rule Of Entry Bar and Epiry.
1. Put Entry with expiry 3 bars:
* After Put Alert Bar close with signal confirmed, put Arrow appear, and after 3 bars, result label will appear to show win trade, loss trade or draw trade
2. Call Entry with expiry 3 bars:
* After Call Alert Bar close with signal confirmed, call Arrow appear, and after 3 bars, result label will appear to show win trade, loss trade or draw trade.
3. While 1 trade is opening no more any signal
C. Popup Alert/Mobile Alert
1. Signal alert: Put Alert or Call Alert will send to mobile or show popup on chart
2. Put Alert: only Put Alert will send to mobile or show popup on chart
3. Call Alert: only Call Alert will send to mobile or show popup on chart

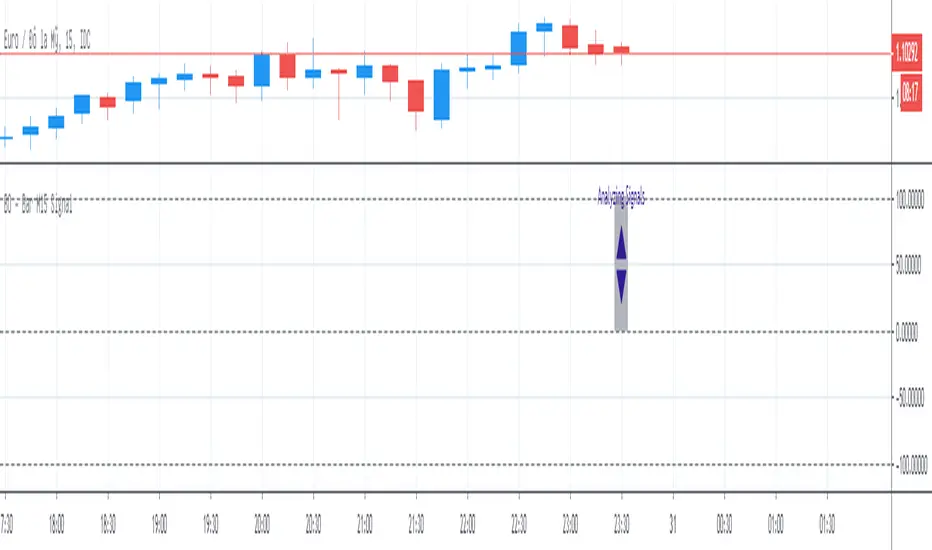
BO - Bar M15 2/3 SignalBO - Bar M15 2/3 Signal show the signal to trade Binary Option with rule below:
A. Indicator
* Bollinger Band (20,2): avoid waterfall
B. Rule of Signal
1. Rule1: Split Bar M15 to 3 part and load them on M5 chart (recommend use M5 IDC chart)
2. Rule 2: Delay 10' after bar M15 open => wait for price's pattern
3. Rule 3: Put Signal row 30-32
* Delay 10' after bar M15 open.
* Direction of 1/3 and 2/3 Bar M15 is upward
* close of 2/3 Bar M15 below upper band Bb(20,2) on M5 chart => avoid strong buy
4. Rule 4: Call Signal row 36-38
* Delay 10' after bar M15 open.
* Direction of 1/3 and 2/3 Bar M15 is downward
* close of 2/3 Bar M15 above lower band Bb(20,2) on M5 chart => avoid strong sell
C. Recommend Expiry time: Bar M15 close
* We try to catch the shadow of Bar M15 but dont trade when price run on the upper or lower band of BB(20,2,M5)

BO - Bar M15 Signal* This script show the signal base on volatility of previous bar M15 to trade Binary Option.
* Rule of Signal is below:
A. Rule 1: Wait for prices created temporary peak and bottom
Row 18: 10 minutes till close
B. Rule 2: Reversal previous bar's direction
1. Put Signal - Row 22 - 25:
- Delay 5' after bar M15 open
- previous bar's direction is upward
- price less than previous close
- temporary bottom greater than previous open
2. Call Signal - Row 29 - 32:
- Delay 5' after bar M15 open
- previous bar's direction is downward
- price greater than previous close
- temporary peak less than previous open
C. Rule 3: Follow previous bar's direction
1. Put Signal - Row 37 - 40:
- Delay 5' after bar M15 open
- previous bar's direction is downward
- price greater than previous open
- temporary peak less than previous peak
2. Call Signal - Row 43 - 46:
- Delay 5' after bar M15 open
- previous bar's direction is upward
- price less than previous open
- temporary bottom greater than previous bottom

QQE Cross Indicator Alert v2.0 by JustUncleLThis version of the indicator makes a distinction between the types of QQE cross alerts on the chart and now only recommends the Thresh Hold channel exit crosses for BUY/SELL alerts, the other two types of crosses are still there to provide pre-warning of pending BUY/SELL alerts. Also only the BUY/SELL alerts are filtered by Moving Average Filter and/or the new Directional filter (default). The default settings in this version have also been changed, particularly the Moving Averages, to indicate trend changes quicker.
Indicator Project Description:
*** This is a trend following indicator alert that uses fast QQE crosses with Moving Averages for trend direction filtering. QQE or Qualitative Quantitative Estimation is based on the relative strength index, but uses a smoothing technique as an additional transformation. Three crosses can be selected (all selected by default):
RSI signal crossing ZERO (XZERO)
RSI signal crossing Fast RSIatr line (XQQE)
RSI signal exiting the RSI Threshhold Channel (BUY/SELL)
The (BUY/SELL) alerts can be optionally filtered by the Moving Average Combo:
For BUY alert the Close must be above the fast MA and
fast MA (EMA8) > medium MA (EMA20) > slow MA (SMA50).
For SELL alert the Close must be below the fast MA and
fast MA (EMA8) < medium MA (EMA20) < slow MA (SMA50).
and/or Directional filter (default filter):
For BUY alert the Close must be above the slow MA (SMA50) and the directional MA (EMA20) must be green.
For SELL alert the Close must be below the slow MA (SMA50) and the directional MA (EMA20) must be red.
The XZERO and XQQE are not included in the filtering, they are used to indicate pending BUY/SELL alerts, particularly the XZERO.
Note: I have found the XQQE cross can also be quite good alert for BUY/SELL as well, particularly in direction of current trend. The XZERO I have found to be totally unreliable for BUY/SELL alerts.
This indicator should work on any currency pair, most chart timeframes and expiry in 3 to 6 candles for binary option trading. For hourly or longer charts expiry can be longer for binary options, or if available use standard forex trading techniques
Some Hints for using this indicator:
Avoid taking trades in non-trending market, this is normally indicated by a near Horizontal SMA50 line.
Avoid trading when all the moving averages are close together.
When trading 1min and 5min charts, expiry should set to 1-3 candles.
Avoid trading when market choppy, this is normally indicated by the fast EMA8 crossing the EMA20 back and forwards quickly.
High probability trades tend to occur when you get a XQQE followed by a XZERO and then BUY/SELL in the same direction of trend.
Don't trade near nor directly on any major market news (sometime better no trade day).
Please practise this system in DEMO first, before committing any real money. Be patient the more you practise the better and more confident you will be.
I hope you enjoy this indicator, it has proven very effective for me.

yutas_BOindicator2βVer1.0
High-low sign indicator for binary option only. (β version)
バイナリーオプション専用ハイローサインインジケーター。 (ベータバージョン)

SlingerMust be added an Ichimoku Clound with the following entries
Conversion Line Periods __4
Base Line Periods _______ 26
Lagging Span 2 Periods___ 52
Displacement __________ 26
Turn off from chart
-Conversion Line
-Base Lina
-Lagging Span
Must add 1 EMA 25
Instructions, USE FOR BINARY AT TRENDING CHARTS
5MIN
BUY
Price must be OVER Ichimoku Clound, EMA 25 and pulled back to the GREEN lines
SELL
Price must be BELOW Ichimoku Cloud, EMA 25 and pulled back to the GREEN lines
ENTRY
As it comes back moving up or down after touching the green line(s)
I may update the script later and add all at the same so you don't have to add the EMA 25 and the Ichimiku Cloud

Big Snapper Alerts R2.0 by JustUncleLThis is a diversified Binary Option or Scalping Alert indicator originally designed for lower Time Frame Trend or Swing trading. Although you will find it a useful tool for higher time frames as well.
The Alerts are generated by the changing direction of the ColouredMA (HullMA by default), you then have the choice of selecting the Directional filtering on these signals or a Bollinger swing reversal filter.
The filters include:
Type 1 - The three MAs (EMAs 21,55,89 by default) in various combinations or by themselves. When only one directional MA selected then direction filter is given by ColouredMA above(up)/below(down) selected MA. If more than one MA selected the direction is given by MAs being in correct order for trend direction.
Type 2 - The SuperTrend direction is used to filter ColouredMA signals.
Type 3 - Bollinger Band Outside In is used to filter ColouredMA for swing reversals.
Type 4 - No directional filtering, all signals from the ColouredMA are shown.
Notes:
Each Type can be combined with another type to form more complex filtration.
Alerts can also be disabled completely if you just want one indicator with one colouredMA and/or 3xMAs and/or Bollinger Bands and/or SuperTrend painted on the chart.
Warning:
Be aware that combining Bollinger OutsideIn swing filter and a directional filter can be counter productive as they are opposites. So careful consideration is needed when combining Bollinger OutsideIn with any of the directional filters.
Hints:
For Binary Options try ColouredMA = HullMA(13) or HullMA(8) with Type 2 or 3 Filter.
When using Trend filters SuperTrend and/or 3xMA Trend, you will find if price reverses and breaks back through the Big Fat Signal line, then this can be a good reversal trade.
Some explanation about the what Hull Moving average and ideas of how the generated in Big Snapper can be used:
tradingsim.com
forextradingstrategies4u.com
Inspiration from @vdubus
Big Snapper's Bollinger OutsideIn Swing filter in Action:

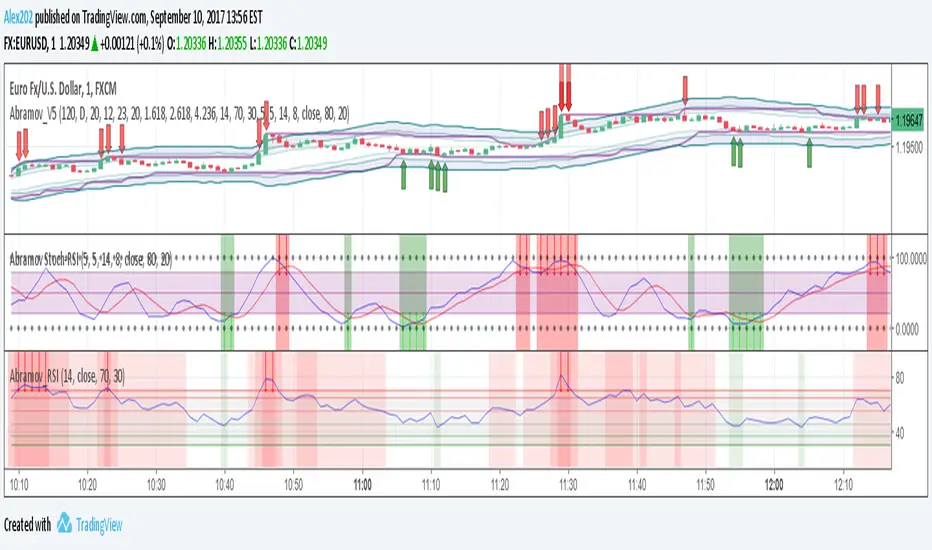
Abramov_V5Improved script Abramov_V4, has notifications
Recommended for binary options
Strategy is on my site
Multicurrency
Timeframe from 1 minute
Volatility - not lower than average
This indicator includes:
1. Bollinger waves 3 levels - incl. / off.
2. Moving averages 2 pieces - incl. / off.
3. Price channel - incl. / off.
4. Support and resistance level per day - incl. / off.
5. Support and resistance level for 120 minutes - incl. / off.
6. Arrows RSI + Stochastic buy / sell
7. Arrows to buy / sell on the price level in the channel
8. Customizable notifications from the indicator, now you do not need to waste time searching for a good entry point, notification comes in advance.
9. The indicator does not redraw!
Any of the indicators is configurable.
The optimal settings are set by default.
This indicator is suitable for several strategies.
Paid subscription to the indicator
When working with this indicator, it is necessary to avoid news and sudden jumps in the market
For additional signal filtering, I recommend:
Abramov_RSI - additional indicator
Abramov Stochastic-RSI - additional indicator
----------------------------------------------
Улучшенный скрипт Abramov_V4, имеет оповещения
Рекомендовано для бинарных опционов
Стратегия у меня на сайте
Мультивалютный
Таймфрейм от 1 минуты
Волатильность - не ниже среднего
Этот индикатор включает в себя:
1. Волны Боллинджера 3 уровня - вкл. / выкл.
2. Скользящие средние 2 штуки - вкл. / выкл.
3. Канал цены - вкл. / выкл.
4. Уровень поддержки и сопротивления за день - вкл. / выкл.
5. Уровень поддержки и сопротивления за 120 минут - вкл. / выкл.
6. Стрелки RSI+стохастик купить/продать
7. Стрелки купить/продать по уровню цены в канале
8. Настраиваемые уведомления от индикатора, теперь не нужно тратить время на поиски хорошей точки входа, уведомление приходит заранее.
9. Индикатор не перерисовывает!
Любой из индикаторов настраивается.
Оптимальные настройки устанавливаются по умолчанию.
Этот индикатор подходит для нескольких стратегий.
Платная подписка на индикатор
При работе с этим индикатором необходимо избегать новостей и резких скачков на рынке
Для дополнительной фильтрации сигналов рекомендую:
Abramov_RSI -дополнительный индикатор
Abramov Stochastic-RSI -дополнительный индикатор
The GM Slip Signals - VIP Revactory - Public SignalsThe GM Slip Signals,
The GM Slip is a signal that uses the strategy based on Candlestick Formation.
This is the pattern formula of GM Slip signals :
1. BASIC SLIP STRATEGY,
- Bullish Basic Slip Pattern : ((BULLISH CANDLE) - (BULLISH CANDLE) - (BEARISH CANDLE) - (BULLISH CANDLE)) = BUY
- Bearish Basic Slip Pattern : ((BEARISH CANDLE) - (BEARISH CANDLE) - (BULLISH CANDLE) - (BEARISH CANDLE)) = SELL
2. COMBINATION SLIP STRATEGY,
- Bullish Combination Slip Pattern : ((BULLISH CANDLE) - (BULLISH CANDLE) - (BEARISH CANDLE) - (BULLISH OUTSIDEBAR CLOSE > UPPER BOLLINGER BANDS )) = BUY
- Bearish Combination Slip Pattern : ((BEARISH CANDLE) - (BEARISH CANDLE) - (BULLISH CANDLE) - (BEARISH OUTSIDEBAR CLOSE < LOWER BOLLINGER BANDS )) = SELL
// ----------- Add-ons Setting ----------- //
Setting for Basic Slip Strategy for Signals :
// ----------- Add-ons Setting ----------- //
Setting for Combination Slip Strategy for Signals :
--------
Recommendations Formula Entry for Binary Options,
// Formula : Timeframe X 1 = Expiration Entry
Ex,
Timeframe : M1 X 1 = 1 Minute
Timeframe : M5 X 1 = 5 Minute
Timeframe : M15 X 1 = 15 Minute
Etc.
--------
Signal Instructions,
1. Diamond BUY / SELL Arrow : PREPARATION SIGNAL
2. Highlight Line Arrow : OPEN POSITION SIGNAL
3. If lose, automatically will be appear "Highlight Line Arrow" on next bar for open position level 1 martingale
--------
Regards Profit Digdaya,
- VIP Revactory Indonesia
--------
DISCLAIMER: No sharing, copying, reselling, modifying, or any other forms of use are authorized for our documents, script / strategy, and the information published with them. This informational planning script / strategy is strictly for individual use and educational purposes only. This is not financial or investment advice. Investments are always made at your own risk and are based on your personal judgement. I am not responsible for any losses you may incur. Please invest wisely.*

QQE-CCI Hello guys;
This indicator is a simple combination of two oscillators "Quantitative Qualitative Estimation Signals"(based on RSI) and "Commodity Channel Index".
To summarize, the method of signaling from this indicator is that by observing the "Long" signal and CCI cross with the midline upwards simultaneously, we open the buy position; and if we see the "Short" signal and CCI cross with the midline down at the same time, we open a sell position.
I have designed this indicator for use in Binary options; 70% of the trades I have made based on this indicator signals have been successful.
I put my telegram ID here incase if U need, txt me :)
@QQECCi

Williams Fractals with Alerts by MrTuanDoanCustom William Fractals for alerts and educational purpose.
Added custom alerts for Williams Fractals.
Also added filter to show less fractals on chart.
The simple idea how I use fractals in Binary Option is to determine temporary resistance and support.
Simple strategy:
- Mark Resistance/Support on higher time frame (e.g. 5M)
- Set an alert for new fractal
- Whenever a new fractal that appears close to your marked Resistance/Support, go to lower time frame (e.g. 1M)
- Wait for rejection at the level that lower than new down fractal (or higher than new up fractal).
- Enter with the same expiry of lower time frame.
Good luck and happy trading. :-)

EMA200 with alerts before touchingInitial version: provide alert when price is in range before it touches ema.
Used for Binary Option to enter rejection from EMA200.
Why Jason200?
It's a legitimate request from Jason Estudillo.

Cryptotrader ExstremeIndicator which helps with the longterm trading of cryptocurreny, to find entry points.
Its also great for binary with an ideal bank management stragety.
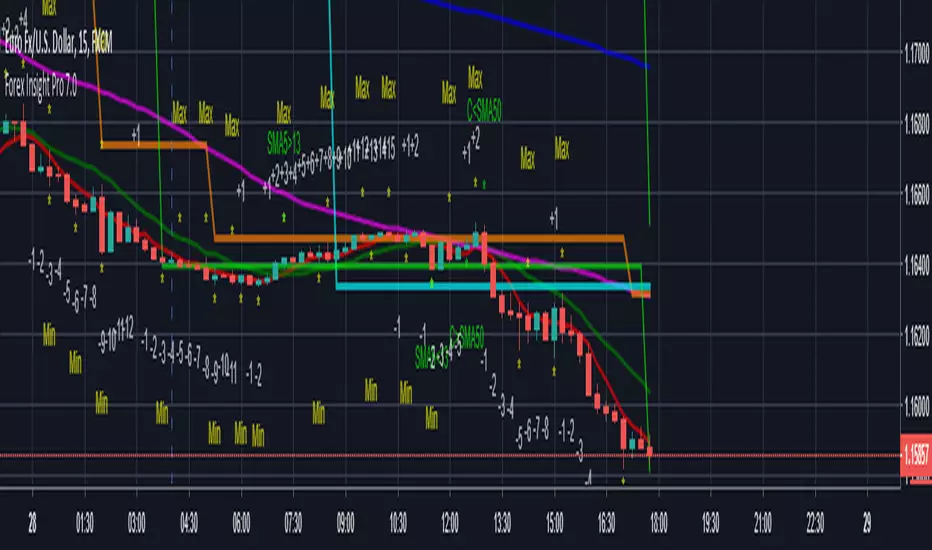
Forex Insight Pro 7.0Forex Insight Pro 7.0 for TradingView gives you abilities to see the stories hiding in the graphs of the markets. It marks and reminds you about important parameters that are happening on the graph so that you will not forget to consider them before placing orders. These parameters include:
Automatic CC(X) counting that compare the close of the right price bar to that of left price bar in a group of X consecutive bars such as CC(5,9) of a group of 5 bars will compare the close price of the right bar to the left bar (ignoring 3 bars in the middle). If the right bar closed higher, the count positive number would be printed above the bar. If the left bar closed higher, the count negative number would be printed below the bar. Nine consecutive series of up counts will define the lowest price as CC(5,9) support line and nine consecutive series of down counts will define the highest price as CC(5,9) resistance line. The count numbers and support / resistance lines are automatically printed on the graph if enabled.
Show a set of simple moving average lines such as SMA5, SMA13, SMA50, SMA200, SMA800, if enabled. The color of SMA50 line (which is the same as the the middle line of Bollinger band (50,2) can be set to change based on increasing/decreasing values of itself, or of the MACD(12,26,9).
Show Bollinger bands (50,2), if enabled.
Show the high and low levels of the previous day, if enabled.
Show the important time areas for Forex trading during Asian, London, and New York sessions, if enabled.
Automatic printing of the events happening in the graph to remind the readers of parameters under considerations (if enabled) including:
- Print "SMA5>13" and "SMA5<13" for SMA5 crossed above and below SMA13.
- Print "SMA50>200" and SMA50<200" for SMA50 crossed above and below SMA200.
- Print "Max" and "Min" for local maximum and local minimum bars.
- Print "C75" and "C25" for the bars that closed above 75% and closed below 25% of its ranges.
- Print "C>SMA50" and "C30" and "RSI<70" for RSI(14) that crossed above 30 % and below 70 %.
- Print "MACD>0" and "MACD<0" for MACD(12,26,9) that crossed above and below zero.
- Print "MACD>Sig" and "MACD
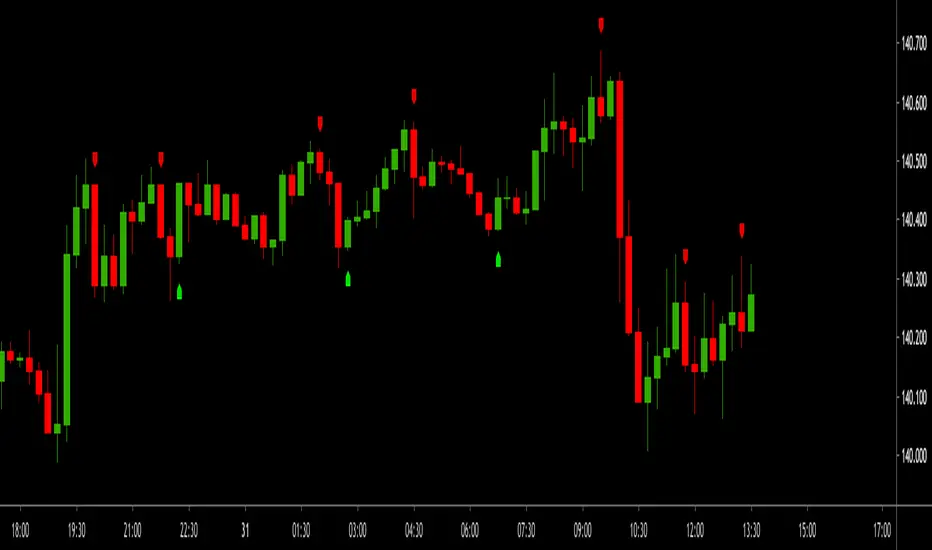
Noro's BinaryHacker v1.0The indicator isn't redrawn (the last candle can be redrawn because it still changes).
NOT indicator shows a bottom of the market or top of the market!!! The indicator shows what there will be a color of the following candle.
The index up under the current candle means that the following candle will be growing (there will be a green candle). And vice versa. The index down under the current candle means that the following candle will be falling (there will be a red candle). The indicator shows only on one following candle. It is not the trend indicator!
Well for Forex and binary options.
