ATR Squeeze Identifier + Last-Bar TR Stops1) Paints two lines based on previous bar's true range, has option for custom multiplier to make stop a factor of previous bar's TR. Used for quick identification of stop loss placement based on previous bar set-ups.
2) Identifies bar on close which has true range that is smaller than a period-chosen ATR criteria. Additionally, has an input for a raw "ATR Shave" which is used to narrow down bars with even smaller true range. Mostly used to identify potential entry zones where market is being squeezed, and expansion is likely to follow. Plots a character under the bar.
3) Identifies a close which includes and follows 5 consecutive closes which all exhibit smaller than average ATR. Includes customize-able ATR length and "ATR Shave" to narrow down tighter range's. Paints circle at bottom of chart. Mostly used to identify when market has been 'quiet' for some time and entries should be considered for likely expansion.
"bar" için komut dosyalarını ara

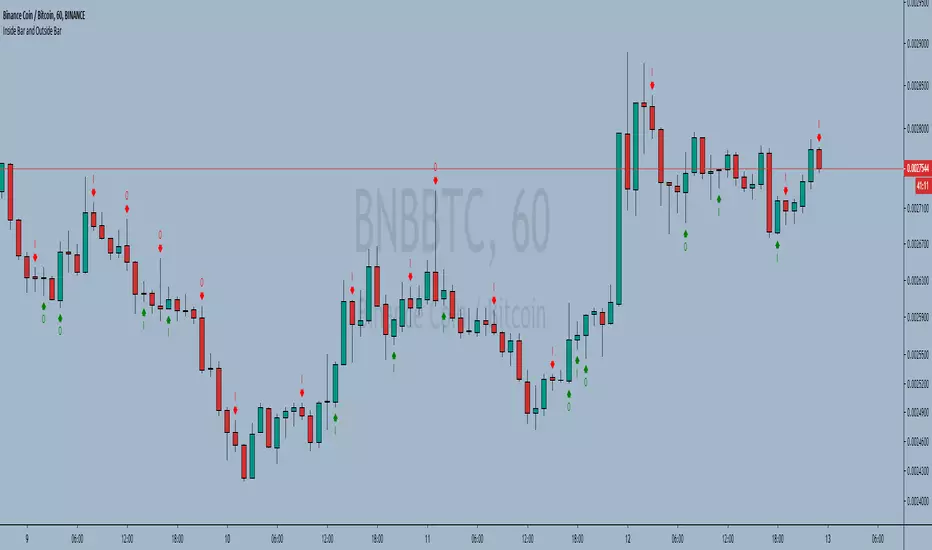
Inside Bar and Outside Bar Simple indicator, to show outside bars and inside bars
inside sellbar = "I" in red color
inside buybar = "I" in green color
Outside sellbar = "O" in red color
Outside buybar = "O" in green color
----------//---------------
PT-BR
Indicador simples, para mostrar outside bars e inside bars
inside sellbar = "I" na cor vermelha
inside buybar = "I" na cor verde
Outside sellbar = "O" na cor vermelha
Outside buybar = "O" na cor verde
Stochastic with False bar R2-2 by JustUncleLThis study project is an updated version of the implementation of the "Stochastic False BAR" indicator.
Description:
The standard Stochastic buy/sell indications come from Stochastic crosses about the standard overbought/oversold zones (80/20). This does not always work and you get stuck in the OB/OS zones with a trend continuation. Utilising a second much longer length Stochastic, the "False BAR" (Black) indicates when it is unsafe to take Stochastic cross over trades. Where the false bar does not appear (aqua, no background highlighing), the overbought / oversold conditions of the Stochastic can be considered higher-probability reversal areas and thus trading opportunities.
This Revision:
Added options to enable/disable False Bar lines and Stochastic trends.
Added options to modify upper and lower limits of false bar Stochastic and trading stochastic trend.
Added option to show the trading Stochastic as coloured Ribbon.
Added name titles for all plots
Added Background highlighting for False Bar.

Fractal Resonance BarLazyBear's WaveTrend port has been praised for highlighting trend reversals with precision and punctuality (minimal lag). But strong "3rd Wave" trends can "embed" or saturate any oscillator flashing several premature crosses while stuck overbought/oversold. This happens when the trend stretches over a longer timescale than the oscillator's averaging window or filter time constant. Our solution: monitor many timescales. With Fractal Resonance Bar's rich color codings, strong wavefronts form across timescales and jump out like an approaching line of thunderclouds!
Fractal Resonance Bar color-codes the status of eight underlying stochastic oscillators, with each row averaging over twice the time of the row above.
Fractal Resonance Bar shifts its timescales along with your choice of main chart timescale:
1 minute chart: 1 minute through 128 minute (~2 hour) oscillators.
15 minute chart: 15 minute through 1920 minute (~32 hour) oscillators.
1 hour chart: 1 hour through 128 hour (~2 week) oscillators.
Daily chart: 1 day through 128 day (~4 month) oscillators.
The color map is configured as follows:
Hot Pink: Extreme Overbought (> 100%) rolled over to sell, but oscillators probably embedded with more upside (revert to Dark Green) possible after a pause.
Deep Red: Overbought (> 75%) crossover ripe for selling (validated when red spreads to timescales below).
Brown: Minor (< 75%) crossover sell from which could bounce back green or start a plunge toward gray/black.
Gray/Black: Mature (< -75%) sells turning full black in a plunge before the dawn.
Lime Green: Extreme Oversold (< -100%) and bouncing, though may yet bottom even lower.
Green: Oversold (< -75%) crossover ripe for buy. Green spreading to all timescales below will validate bottom is in.
Dark Green/Teal: Mature buy in overbought (> 75%) range, waiting for sell crossover to Hot Pink for a pause or correction.
White Stripes are Impulsive Trend Warning
Fractal Resonance Bar warns of oscillator embedding by showing white stripes when it detects strong, early surges in the timescale rows below.The white stripes usually accompany Hot Pink warning it's too early to go short, or Lime Green warning it's too early to go long.
Heeding these warnings will probably miss the exact top or bottom, but you're less likely to get overrun in a momentum move.
Usually the market gives us a second opportunity to short very close to the top or buy very close to the bottom after the warning white stripes have subsided.
NOTE: Recently rolled over Futures contracts may not have enough history for all oscillator calculations, in which case no bar colors will appear.
Tweakable Attributes
The default Channel Length, Stochastic Ratio Length and Lag Length work reasonably well on all timescales in our experience. Minor tweaks don't hurt but this may just overfit to a particular chart history.
We don't recommend changing the 75% Overbought and 100% Extreme Overbought default levels as these are ideal numbers relative to the underlying oscillator statistic calculations. But these settings can shift the color transition levels.
Embedded attribute controls the sensitivity/conservativeness of the white strip embedding detectors. Closer to 75 increases the warning sensitivity while closer to 100 decreases the aggressiveness of blocking white stripes.
Embed Separation also affects the white stripe sensitivity.
Row width increases each row's thickness to fill the available screen height you've afforded the bar.

Conditional Background & Bar Colorsℹ️ Conditional Background & Bar Colors is a lightweight utility indicator that applies conditional background and candle/bar colors based on user-defined logical rules.
This script is not a trading indicator and does not generate buy or sell signals.
It is designed purely as a visual enhancement layer to help highlight market states or indicator conditions.
🔧 Features
Define multiple independent conditions using:
➤ Comparisons (>, <, =, ≥, ≤)
➤ Cross, crossover, crossunder
➤ Value changes and slope direction
➤ NA / non-NA states
Apply colors to:
➤ Chart background
➤ Candles / bars
➤ Optional “all conditions matched” logic for confluence highlighting
➤ Works with any indicator or price source
Can be applied to:
➤ Main price chart
➤ Indicator panes (e.g. RSI, MACD, custom indicators)
➤ No repainting
➤ No alerts
➤ No strategy or execution logic
🎯 Use Cases
➤ Visual confirmation of indicator alignment
➤ Market regime or bias highlighting
➤ Context awareness for discretionary trading
➤ Conditional coloring inside indicator panes
🎨 Color behavior
➤ Background colors overlap and can be combined using transparency
➤ The “all conditions matched” color overrides individual background colors
➤ Bar colors override each other, where the lowest active condition in the list takes priority
⚠️ Disclaimer
This script provides visual assistance only.
All trading decisions remain the sole responsibility of the user.

Alson Chew PAM EXE and Mother BarIndicators for strategies taught by Alson Chew's Price Action Manipulation (PAM) course
Two functions.
First it identifies EXE bars (Pin, Mark, Icecream bars).
Second it identifies Mother bars and draws an extension line for 6 bars.
Applicable to all time frames and can customise how many signals to show.
To be used in conjunction with trading strategies like
- 20 SMA, 50 SMA, 200 SMA FS formation
- Force Bottom, Force Top FS formation
- UR1 and DR1 using EXE Bar

Watermark | Bar Time | Average Daily RangeMulti Info Panel & Watermark
Multi Info Panel & Watermark is a utility indicator that displays several pieces of chart information in a single, customizable panel. It is designed to support intraday and swing analysis by making key data—such as symbol details, date, and average daily range—easy to see at a glance, as well as providing simple tools for notes and backtesting.
Features
Watermark / Custom Note
Optional text overlay that can be used as a watermark or personal note.
Can display a strategy name, reminder, or any other user-defined label on the chart.
Ticker Info
Shows information about the currently active symbol on the chart (for example, symbol name and other basic details depending on the inputs).
Helps keep track of which market or pair is being analyzed, especially when using multiple charts.
Current Date
Displays the current date directly on the chart.
Useful for screenshots, journaling, and documenting analysis.
Average Daily Range (ADR)
Calculates the average daily range of the active symbol over a user-defined number of recent days.
Helps visualize how much price typically moves in a day, which can support position sizing, target setting, or volatility awareness within your own trading approach.
Open Bar Time Marker
Marks the open time of a selected bar (for example, a session open or a specific reference bar).
Primarily intended as a visual aid for manual backtesting and reviewing historical price action.
Usage
Use the watermark and ticker info to keep your charts labeled and organized.
Refer to the ADR readout to understand typical daily volatility of the instrument you are studying.
Use the date and open bar time marker when creating screenshots, trade journals, or when replaying historical sessions for review.
This script does not generate trading signals and does not guarantee any performance or results. It is provided solely as an informational and visualization tool. Always combine it with your own analysis, risk management, and decision-making. Nothing in this indicator or description should be considered financial advice.

Yash RSI Bars - Multi Timeframersi time frame testing
Only bar coloring - No extra plots or lines
✅ Custom timeframe - Colors bars based on RSI from your selected timeframe
✅ White bars - When RSI is above overbought level (default 70)
✅ Yellow bars - When RSI is below oversold level (default 30)
✅ No color - When RSI is in neutral zone
Clean and simple! 🎯

Price Action - Inside/Outside BarsThis indicator highlights Inside and Outside bars based on Al Brooks' price action philosophy from "Reading Price Charts Bar by Bar." Inside bars (high ≤ previous high and low ≥ previous low) represent contraction and potential breakouts, often leading to two-legged moves. Outside bars (high > previous high and low < previous low with min body 50%) signal volatility and possible reversals or trends. Customizable highlights, lines, and labels help identify high-probability setups in trends or ranges. Always focus on context—buy low, sell high, and wait for confirmation.

Remote bar rangeShows the price range for a certain period of bars back. For example, the range between 100 bars back and 50 bars back. The last 50 bars are not counted in this case.

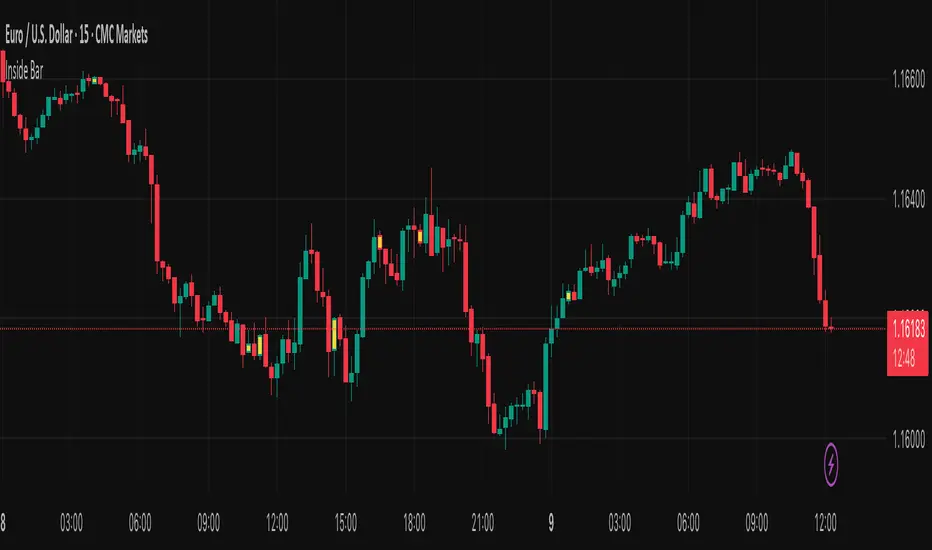
Inside Bar Highlighter by nkChartsOverview:
The Inside Candle Highlighter is a simple yet powerful TradingView indicator designed to identify inside bars (inside candles) on your chart. An inside candle is defined as a candle whose high is lower than the previous candle's high and low is higher than the previous candle's low, meaning it forms entirely within the range of the preceding candle.
Inside candles are commonly interpreted by traders as periods of market consolidation or indecision and often precede breakouts or significant price moves. This indicator highlights these candles directly on your chart, making them easy to spot at a glance.
Features
Detects Inside Candles: Automatically identifies bars that are fully contained within the previous bar’s high-low range.
Confirmed Bar Coloring: Colors the candle after it closes, ensuring no repainting occurs during formation.
Style Tab Customization: Users can adjust the candle color directly from the Style tab, allowing seamless integration with your chart theme.
Clean & Minimal: Only inside candles are highlighted, keeping charts uncluttered.
How Traders Can Use It
Identify Consolidation Zones: Quickly spot periods where the market is contracting.
Prepare for Breakouts: Inside candles often signal an upcoming directional move; traders can plan entry or exit points based on breakouts from the inside candle range.
Combine With Other Indicators: Use alongside trend indicators, volume tools, or support/resistance levels to enhance trade confirmation.
Recommended Use
Works on all timeframes — from intraday charts to daily or weekly charts.
Particularly useful in price action trading, swing trading, and trend-following strategies.
Ideal for traders who want a visual cue for consolidation and potential breakout areas without adding complexity to the chart.
Note: This indicator only highlights inside candles. Interpretation and trading decisions are left to the user.
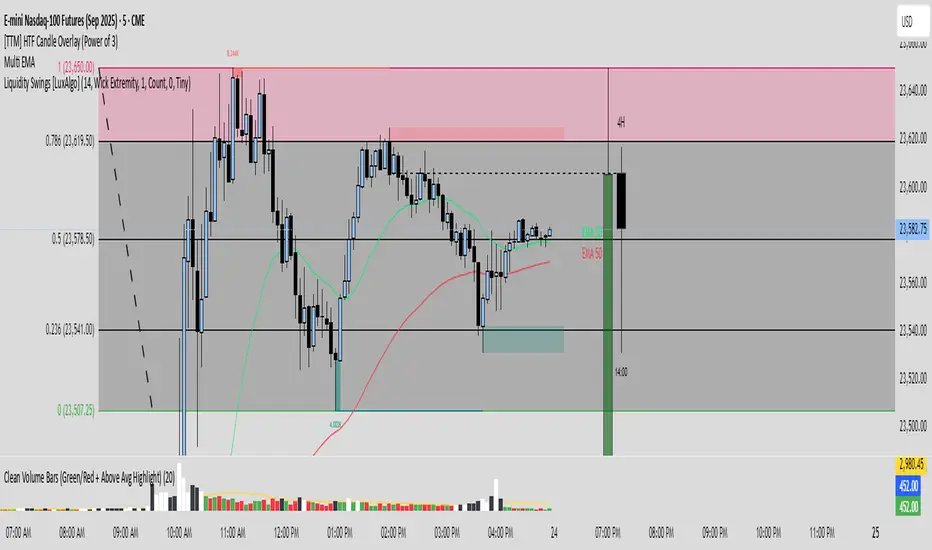
Clean Volume Bars (Green/Red + Above Avg Highlight)📊 Clean Volume Bars (Green/Red + Above Avg Highlight)
This script provides a clearer view of market volume by combining standard green/red volume bars with dynamic highlights for above-average activity.
Features:
✅ Green / Red Volume Bars – standard visualization:
Green when the candle closes higher than it opened
Red when the candle closes lower than it opened
✅ Average Volume Line – a simple moving average (default 20 periods) to track relative volume.
✅ Above Average Highlights – bars that exceed the average volume are emphasized:
White for above-average bullish volume
Black for above-average bearish volume
How to Use:
Look for white volume spikes during up candles → potential strong bullish activity.
Watch for black volume spikes during down candles → potential strong bearish pressure.
Combine with price action, trend, or other indicators for confluence (this is not a standalone trading system).
Coefficient of Variance BarsThe script calculates the Coefficient of Variance (CV), which is the standard deviation (a measure of volatility) divided by the average price over a set period. In simple terms, it tells you how volatile the market is in relation to its current price level.
• Highlighting Volatility Increase: By default, the script colors the bars when this relative volatility makes a new high. This suggests that the market is "waking up" and that a significant price move could be starting.
• Highlighting Low Volatility (Inverse Mode): When you uncheck the box in the settings, it highlights periods where volatility is not making a new high. This is useful for spotting quiet, consolidating markets.
________________________________________
How to Use It in Trading
This indicator is a complementary tool and should be used with other forms of analysis, like price action or trend indicators.
1. Spotting Potential Breakouts
The most common use is to anticipate breakouts. When the price is moving in a tight range (consolidation) and you suddenly see a highlighted bar, it signals a surge in volatility. This is often the catalyst that pushes the price out of the range.
• Strategy: Look for a period of price consolidation. When a bar is colored, indicating a volatility spike, look for a confirmation of a breakout (e.g., a candle closing above resistance or below support) and consider entering a trade in that direction.
2. Identifying Ranging Markets
By switching to the inverse mode, you can easily see when the market is quiet and range-bound.
• Strategy: When the bars are consistently highlighted in inverse mode, it confirms a ranging market. This is the ideal environment for strategies that capitalize on sideways movement, such as using oscillators (like RSI or Stochastics) to trade between support and resistance levels.
3. Gauging Trend Strength and Exhaustion
In a strong, ongoing trend, you'll likely see intermittent volatility spikes confirming the momentum. However, a sudden, massive spike in volatility after a very long trend might signal a "climax," potentially indicating the trend is exhausted and a reversal could be near.

Retracement Bar🔍 Retracement Bar – RB
The Retracement Bar (RB) indicator is designed to highlight potential reversal zones by identifying candles where price shows a clear rejection from the extremes. It helps traders spot moments where institutional inventory rebalancing may be occurring — often a precursor to a strong move in the opposite direction.
RB highlights bars that:
Have a relatively small real body compared to the total candle range.
Show a long wick (upper or lower) that exceeds a user-defined percentage of the candle range.
Suggest a potential rejection of price — upward or downward — based on candle structure.
When these conditions are met, a triangle symbol is plotted:
🔻 Red triangle above a candle suggests a possible short opportunity.
🔺 Green triangle below a candle suggests a possible long opportunity.
This indicator does not repaint and triggers only at candle close.
📈 Example – Long Entry
Signal: A green triangle appears below a candle (suggesting rejection of lower prices).
Steps:
Wait for the current RB candle to close.
On the next candle:
Enter long if price breaks above the high of the RB candle.
Alternatively, wait for a pullback and enter based on confirmation (e.g., bullish engulfing, hammer, trendline bounce).
Place a stop-loss just below the low of the RB candle.
Set a target:
Based on a 2:1 risk-reward ratio.
Or use the next resistance/Fibonacci level.
📉 Example – Short Entry
Signal: A red triangle appears above a candle (suggesting rejection of higher prices).
Steps:
Wait for the current RB candle to close.
On the next candle:
Enter short if price breaks below the low of the RB candle.
Or wait for confirmation (e.g., bearish engulfing, shooting star, breakdown from a level).
Place a stop-loss just above the high of the RB candle.
Set a target:
2:1 risk-reward ratio.
Or the next support/Fibonacci zone.
✅ Recommended Filters for Better Results:
Confluence with support/resistance zones.
Trend alignment or reversal context.
Additional confirmation from price action patterns or oscillators.
Volume analysis for entry strength.
🙏 Acknowledgment
Special thanks to Rob Hoffman for inspiring this concept through his original Inventory Retracement Bar (IRB) idea — this indicator is a reinterpretation meant to visually and practically support discretionary price action traders.

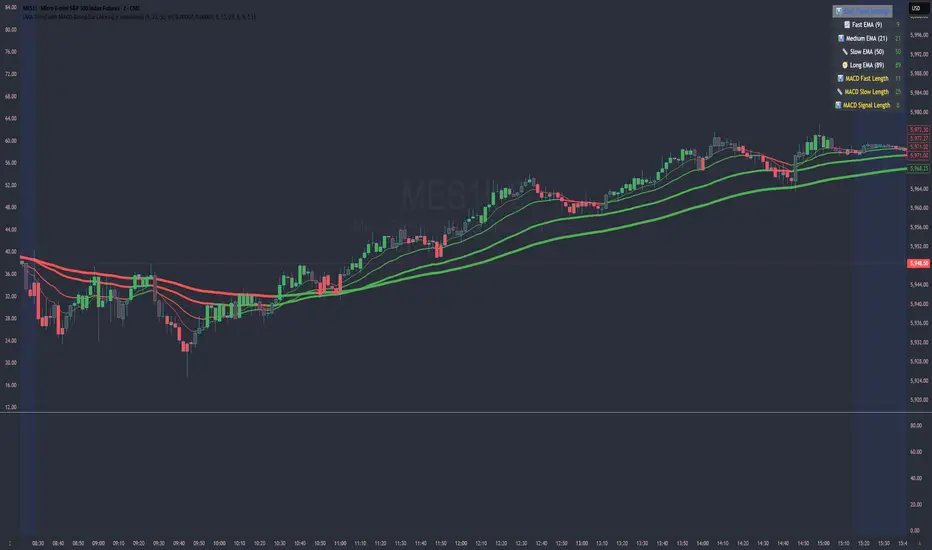
EMA Trend with MACD-Based Bar Coloring (Customized)This indicator blends trend-following EMAs with MACD-based momentum signals to provide a visually intuitive view of market conditions. It's designed for traders who value clean, color-coded charts and want to quickly assess both trend direction and overbought/oversold momentum.
🔍 Key Features:
Multi-EMA Trend Visualization:
Includes four Exponential Moving Averages (EMAs):
Fast (9)
Medium (21)
Slow (50)
Long (89)
Each EMA is dynamically color-coded based on its slope—green for bullish, red for bearish, and gray for neutral—to help identify the trend strength and alignment at a glance.
MACD-Based Bar Coloring:
Candlesticks are colored based on MACD's relationship to its Bollinger Bands:
Green bars signal strong bullish momentum (MACD > Upper Band)
Red bars signal strong bearish momentum (MACD < Lower Band)
Gray bars reflect neutral conditions
Compact Visual Dashboard:
A clean, top-right table displays your current EMA and MACD settings, helping you track parameter configurations without opening the settings menu.
✅ Best Used For:
Identifying trend alignment across short- to medium-term timeframes
Filtering entries based on trend strength and MACD overextension
Enhancing discretion-based or rule-based strategies with visual confirmation
Live Risk/Reward Lines (Dynamic Update: Tick or Bar Close)This script displays dynamic Risk and Reward target lines directly on the chart.
You can choose whether the updates happen live with each price tick or only once a bar closes.
It supports both long and short trading directions, with customizable risk and reward percentages.
Key Features:
Dynamic live updates (per tick or per bar close).
Choose Long or Short trade direction.
Customize risk and reward percentages individually.
Adjustable line length and color.
Option to show or hide risk and reward lines.
How It Works:
For long trades: Risk = Close Price * (1 - Risk %), Reward = Close Price * (1 + Reward %).
For short trades: Risk = Close Price * (1 + Risk %), Reward = Close Price * (1 - Reward %).
Lines are automatically centered around the current bar.
Why It Is Unique:
Unlike static risk/reward indicators, this script allows traders to see real-time dynamic changes based on the latest tick or bar close.
It offers full flexibility for scalpers and swing traders by allowing manual control over update timing and visualization style.
Usage Instructions:
Select your trade direction (Long or Short) from the settings.
Set your preferred risk and reward percentages.
Choose whether lines should update with every tick or only on bar close.
Optionally adjust the length and colors of the lines.
Important:
The script focuses on visualizing risk and reward directly on the price chart without giving buy or sell signals.
Disclaimer:
This tool is intended for educational and informational purposes only and should not be considered financial advice.

7 Inside Bars with Full Range Box (15m)his indicator detects periods of extreme price compression by identifying 7 consecutive inside bars on the 15-minute timeframe. An inside bar is a candle that forms within the high and low of the previous candle. When 7 such bars occur in a row, it's a strong signal of market indecision and potential breakout.
What it does:
Detects if the last 7 candles are all inside the range of the 8th candle (the outer bar).
Highlights the consolidation zone by drawing a fuchsia-colored box from the high to low of the outer candle.
Marks the final candle in the sequence with a small "7IN" label below the bar.
This setup can help traders spot high-probability breakout zones and prepare for potential volatility after extended consolidation.
🔍 Best Used For:
Breakout trading
Volatility expansion strategies
Trade setups following tight consolidation
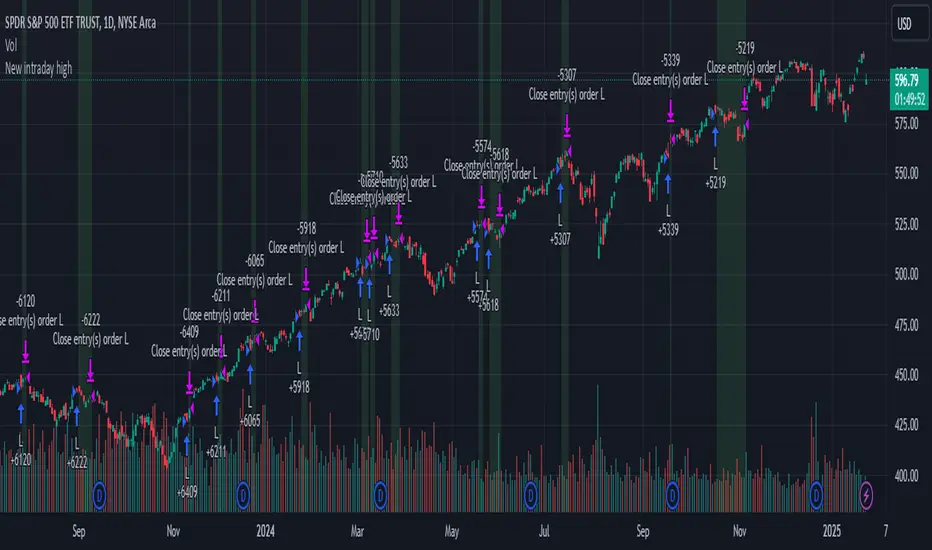
IBS (Internal Bar Strength) Trading Strategy for SPY and NDQImplementation by AlgoTradeKit
Overview
The IBS Trading Strategy is a daily bars long-only trading system, based on the concept of Internal Bar Strength (IBS). The strategy aims to identify potential reversals by monitoring how the previous bar’s close positions itself within its high-low range. It is suitable for stock and US indices. The default parameters are optimized for SPY/SPX and NDQ/QQQ
Strategy Concept
The Internal Bar Strength (IBS) is calculated using the formula:
IBS = (Previous Close - Previous Low) / (Previous High - Previous Low)
This value always lies between 0 and 1. An IBS value below 0.2 is typically interpreted as an oversold condition, while a value above 0.9 suggests an overbought state.
Trading Rules
- Long Entry :
- Condition 1 : IBS is below the user-defined entry threshold (default is 0.2).
- Condition 2 : The current price is above an N-period Exponential Moving Average (EMA) (default period is 252).
- Note : You can disable the EMA condition by setting the EMA period to 0.
- Long Exit
- The position is closed when IBS rises above the user-defined exit threshold (default is 0.9).
Customization Options
- IBS Entry Threshold : Adjust to set the sensitivity for entering a long trade based on oversold conditions.
- IBS Exit Threshold : Customize to define the exit point when the market becomes overbought.
- EMA Period : Set the lookback period for the EMA to align with your trend bias; disable this condition by setting the period to 0.
Risk Management & Trading Considerations
- Designed for daily charts, the strategy captures higher timeframe trends and minimizes noise.
- The entry and exit conditions are straightforward, aiming to avoid over-trading while letting clear signals dictate trade management.
- Always use proper risk management techniques and test the strategy thoroughly on historical data and in a simulated environment before applying it in live markets.
Disclaimer
This strategy is for educational and informational purposes only and does not constitute financial advice. Trading involves risk, and past performance is not indicative of future results. Always conduct your own research and consider your risk tolerance before making any trades.

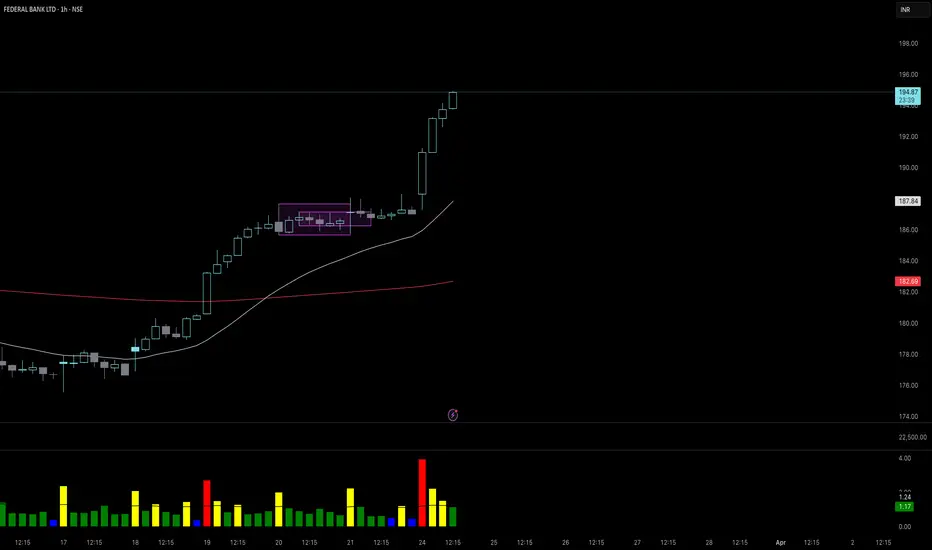
New intraday high with weak barStrategy Logic:
The strategy checks if the current bar’s high is the highest high of the last 10 bar and if internal bar strength is less than 0.15.
Position is closed when close is greater than the previous bar’s high.
When a position is open, the script applies a light green background on the chart to signal that you are in a trade.
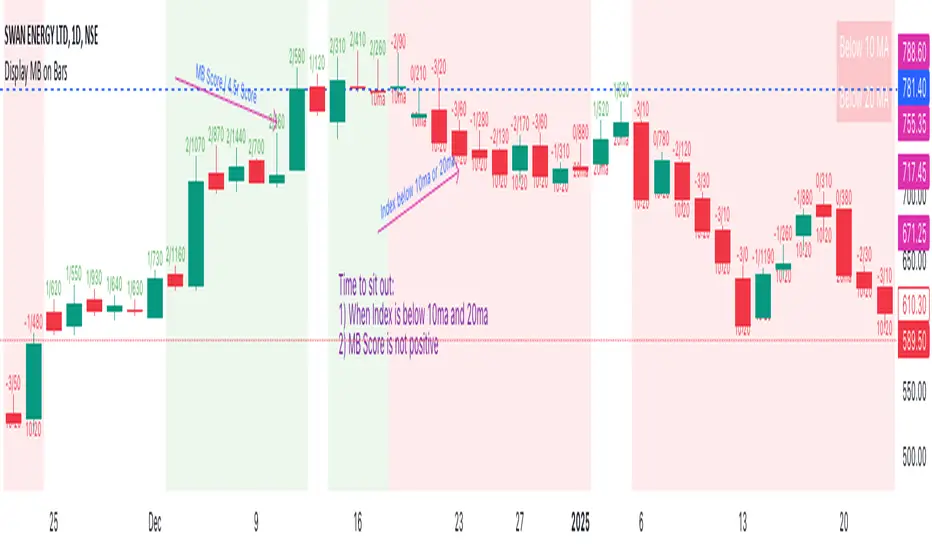
Display MB on BarsDescription
The "Display MB on Bars" Pine Script indicator is designed to visually represent Market Breadth values and R4.5 scores on trading charts. This script enables traders to highlight and analyze key market behavior using pre-defined thresholds for MB scores and dynamically calculated R4.5 values. Additionally, it includes a moving average status table to assess price levels relative to the 10-day and 20-day moving averages.
Features:
1. COB Date Matching: Displays data corresponding to specific "COB dates" provided by the user.
2. MB Value Visualization:
o Highlights bars with a background color based on MB values:
Red if MB ≤ MB_Red (default: -1).
Green if MB ≥ MB_Green (default: 3).
3. R4.5 Scores Display:
o Creates a label on the chart with the MB and R4.5 values when conditions are met (e.g., R4.5 > 200 or specific MB thresholds).
4. Index Moving Average Comparison:
o Calculates 10-day and 20-day moving averages for the selected symbol (default: NSE:NIFTYMIDSML400).
o Shows the price position relative to these moving averages in a table.
How to Use:
1. Configure Inputs:
o COB Dates: Enter a comma-separated list of dates in the format DD-MM-YYYY.
o MB Values: Provide the corresponding MB scores for the COB dates.
o R4.5 Values: Provide the R4.5 scores for the COB dates.
o Set the thresholds for MB values (MB Red<= and MB Green>=).
o Toggle features like MB, RS (R4.5), and the moving average status table.
2. Interpret the Output:
o Observe background colors on the bars:
Red: Indicates MB is less than or equal to the lower threshold.
Green: Indicates MB exceeds the upper threshold.
o Check labels above bars for R4.5 and MB values when conditions are met.
o Refer to the status table on the top-right corner to understand price positions relative to 10-day and 20-day moving averages.
This script is especially useful for traders seeking insights into custom metrics like MB and R4.5, enabling quick identification of key patterns and trends in the market.
Counting Positive and Negative BarsCounting Positive and Negative Bars: It goes through a specified number of bars and counts how many are positive (close above the previous value) and how many are negative (close below the previous value).
Imbalance Criterion: If the count of negative bars exceeds that of positive bars by a configurable margin (such as 60%), it signals a possible buy (Long) condition. The opposite applies for sell (Short) conditions..

Custom MACD Oscillator with Bar ColoringCustom MACD Oscillator with Bar Coloring
This custom MACD indicator is a fusion of two powerful MACD implementations, combining the best features of both the MACD Crossover by HPotter and the Multiple Time Frame Custom MACD Indicator by ChrisMoody. The indicator enhances the traditional MACD with customizable options and dynamic bar coloring based on the relationship between the MACD and Signal lines, providing a clear visual representation of momentum shifts in the market.
Key Features:
MACD Oscillator: Built on the core MACD principle, showing the difference between two Exponential Moving Averages (EMA) for momentum tracking.
Signal Line: A Simple Moving Average (SMA) of the MACD, helping to identify potential entry/exit points through crossovers.
Multiple Time Frame Support: Allows users to view MACD and Signal data from different timeframes, giving a broader view of the market dynamics.
Bar Coloring: Bars are colored green when the MACD is above the Signal line (bullish), red when the MACD is below (bearish), and blue during neutral conditions.
Histogram with Custom Colors: A customizable histogram visualizes the difference between the MACD and Signal lines with color-coding to represent changes in momentum.
Cross Dots: Visual markers at points where the MACD crosses the Signal line for easy identification of potential trend shifts.
This indicator is a versatile tool for traders who want to visualize MACD-based momentum and crossover signals in multiple timeframes with clear visual cues on price bars.

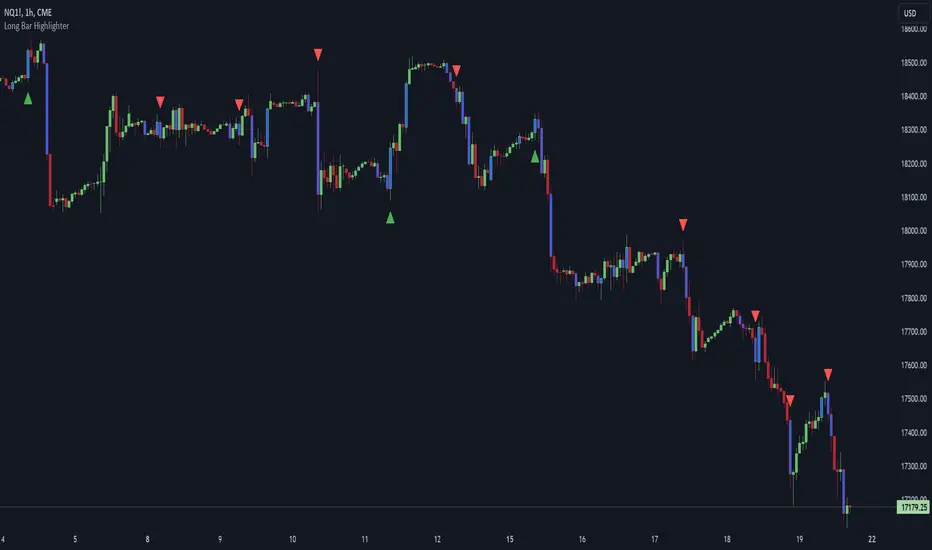
Long Bar Highlighter @shrilssThe Long Bar Highlighter is designed to detect long bars that exhibit significant price expansion beyond recent price levels. It highlights bars that exceed the length of the previous four bars, marking them for their potential importance in market movements. Additionally, the indicator plots directional shapes based on the closing prices, which helps traders visualize potential upward or downward momentum. An optional ATR crossover setting refines these signals, focusing on stronger trends for more optimal trading opportunities.