OPEN-SOURCE SCRIPT
CM EMA Trend Bars
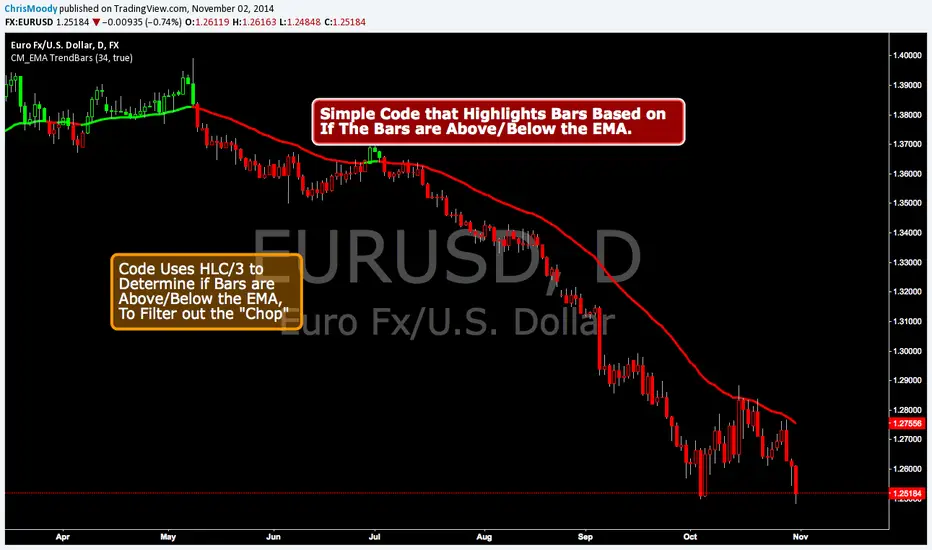
This Code Simply Changes the Bar Colors based on if the Bar is Above or Below the EMA.
Inputs via the Inputs Tab:
Ability to change the EMA Period.
Ability to Turn On/Off the EMA Plotted on the Screen
***Note - I used the HLC/3 To determine if the bar/candle is above or below the EMA. This Filters out the Chop and gets rid of many of the False Breaks above or below the EMA.
Inputs via the Inputs Tab:
Ability to change the EMA Period.
Ability to Turn On/Off the EMA Plotted on the Screen
***Note - I used the HLC/3 To determine if the bar/candle is above or below the EMA. This Filters out the Chop and gets rid of many of the False Breaks above or below the EMA.
Açık kaynak kodlu komut dosyası
Gerçek TradingView ruhuna uygun olarak, bu komut dosyasının oluşturucusu bunu açık kaynaklı hale getirmiştir, böylece yatırımcılar betiğin işlevselliğini inceleyip doğrulayabilir. Yazara saygı! Ücretsiz olarak kullanabilirsiniz, ancak kodu yeniden yayınlamanın Site Kurallarımıza tabi olduğunu unutmayın.
Coming Soon: ChrisMoodyTrading.com
Feragatname
Bilgiler ve yayınlar, TradingView tarafından sağlanan veya onaylanan finansal, yatırım, işlem veya diğer türden tavsiye veya tavsiyeler anlamına gelmez ve teşkil etmez. Kullanım Şartları'nda daha fazlasını okuyun.