SynergySynergy
This indicator was developed for use in an investigation/tutorial using Pine Script to analyse Gold and US Dollar Index correlation.
The first indicator shall measure the percentage change between the open and close of each bar and compare it to the same percentage change of an alternative asset. Additionally, we shall color the background when the two assets move in the same direction. This should allow us to more easily see when the two assets move together and spot trends in their moment.
The yellow bars show use the percentage change in the price of gold. The blue bars show the percentage change in the price of the US Dollar index. If the bar is above zero, it means that the asset closed up. Conversely, if it is below zero, it means the asset closed down. Finally, the grey bars show bars in which the two assets closed in the same direction.
It can be used in conjunction with a second indicator (to be published soon) that provides statistics generated from this indicator.
The full free post can be found here: backtest-rookies.com
"backtest" için komut dosyalarını ara

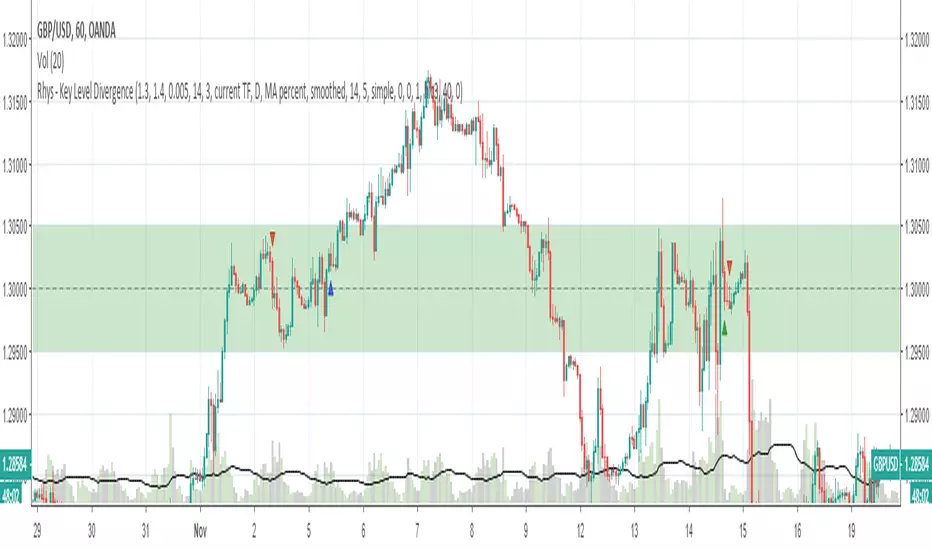
Rhys - Key Level DivergenceThis is a custom script created as part of Backtest Rookies development services. It has been published only for customer acceptance and testing. As such, I cannot grant access to anyone other than the client. Sorry about that.
See the Backtest Rookies profile for open source scripts. Visit our website for free pine-script and algorithmic trading tutorials. For those interested in custom development services, more information can be found on our website.
Key Level Divergence Indicator
A script to detect divergences only at key levels specified by the user.
Features
Select up to 2 key levels
Customize-able buffer zone around the key level
Divergence Detection - Hidden and Regular
Customize-able Pivot detection (for divergences)
Integration of proprietary momentum oscillator.
Alerts when divergences happen in key level zones.
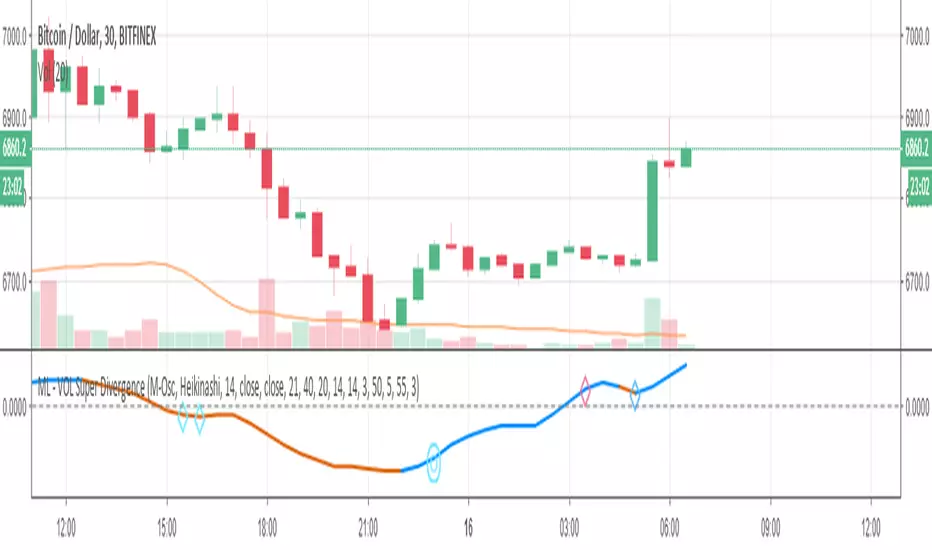
ML - VOLUME Super DivergenceThis script has been published for customer acceptance and verification. Sorry this mean access will only be provided to the customer.
For open source scripts, please take a look at the Backtest-Rookies profile. Users who are interested in custom development services can visit the Backtest-Rookies (.com) website.
VOLUME Super Divergence
A variant of .
All Osclillators have been swapped with Volume based Oscillators.
Dane - MA StrategyThis strategy has been developed as a development service. It is published for customer acceptance and verification. As such, I am unable to provide access to anyone other than the paying customer. Sorry about that.
For those interested in development services, please check out the backtest-rookies (.com) website.
MA Strategy
A Moving average crossover strategy using Heikin-ashi candles for confirmation. The strategy makes trading decisions based on Heikin-ashi data but trades on real candlestick charts to avoid incorrect backtest results.
The strategy includes optional plotting of HK candles on an overlay to help with strategy verification.

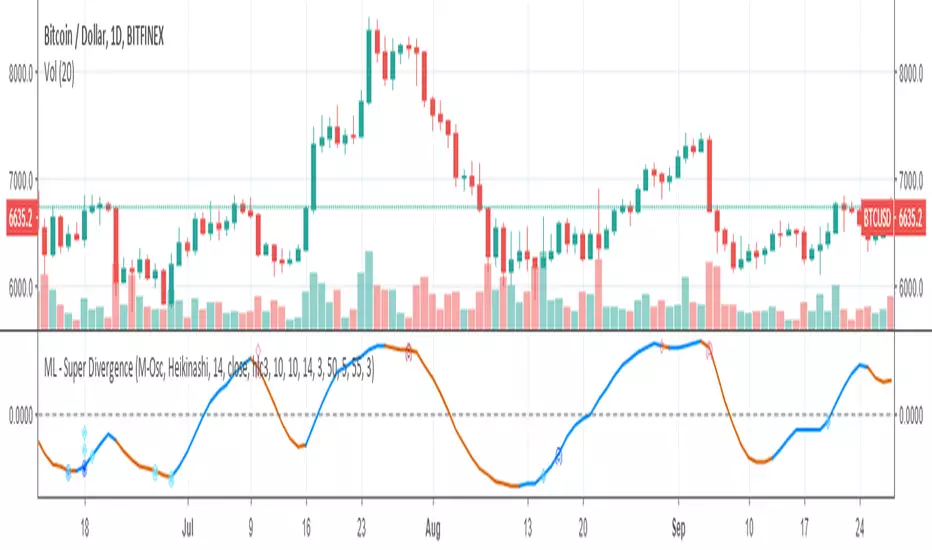
ML - Super DivergenceThis script has been published for customer acceptance and verification. Sorry this mean access will only be provided to the customer.
For open source scripts, please take a look at the Backtest-Rookies profile. Users who are interested in custom development services can visit the Backtest-Rookies (.com) website.
Super Divergence
A super indicator that looks at 4 different oscillators and highlights price to indicator divergences for each of them. It has the following features:
Select which oscillator to plot
Detection of divergences on all 4 indicators irrespective of which indicator is plotted.
Pivot/Swing Detection
Optional Pivot/Swing plotting
Options Signal plotting
Alerts for each divergence
Alex: ConsUD Alert indicatorCustom strategy that was developed for a Backtest-Rookies development service customer. Published for verification, testing and acceptance.
If you are interested in development services send me a message or visit the backtest-rookies (.com) webiste for more information
Consecutive Up/Down Days - Custom Indicator
The indicator builds upon the built-in consecutive up/down days strategy script but with some additional features:
The strategy has been converted to an indicator
Alerts have been added for entries
Position Simulation: Entry signals only happen once per long / short direction.
Plot real high / low candle data (the script is assumed to run on Renko candles)
Plot real simulated entry price at the open of the bar following an entry signal
Plot an EMA

Jeremy: Candle StrategyPrice action strategy developed for a Backtest Rookies service customer. Published for verification and acceptance.
Please visit the Backtest Rookies website if you are interested in Development services
Features
Hammer / Hanging man candle detection with variable inputs
2 position entries
2 different SL and TP ratios
Custom position sizing algorithm
Move the second position to break even once the first take profit is hit

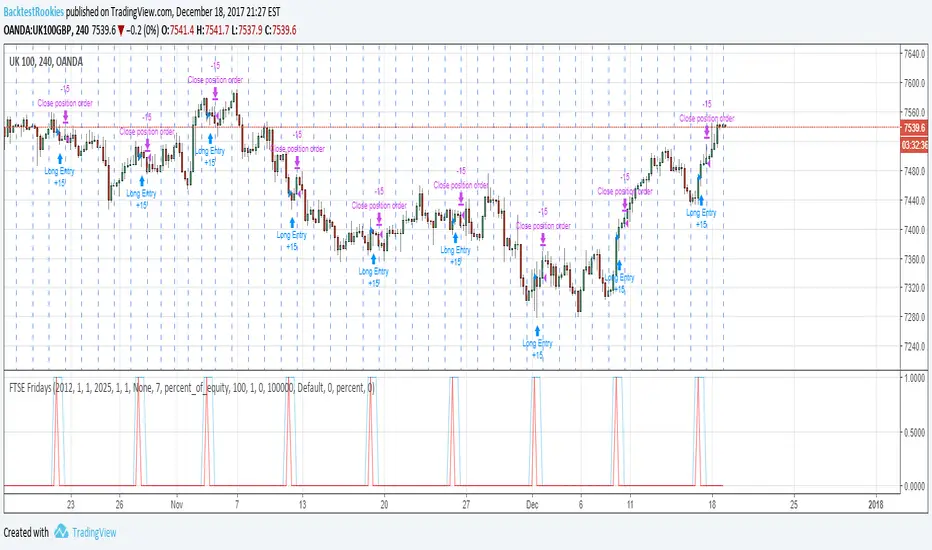
FTSE FridaysThis code snippet below is a quick and dirty follow up to some statistical analysis performed on the FTSE 100. It showed that over the long run, (since 1995) going long on a Friday appeared to have a statistical edge (53%). As a bit of fun, I wanted to create a quick pine script backtest to test this and see if it is possible to profit from it. After all, the index might finish up 53% of the time, but that doesn't mean one can profit from it.
A full commentary to the script and FTSE analysis post can be found on the Backtest-Rookies website. To comply with house rules, I cannot post a direct link here.
Important Note
The script must run on the 4H time frame…..Why? It is a quick and dirty implementation and it relies on entering a long position on the 4H bar before the market opens. This way the position will enter at the open of the market. (Since positions are always opening on the bar following an entry signal).
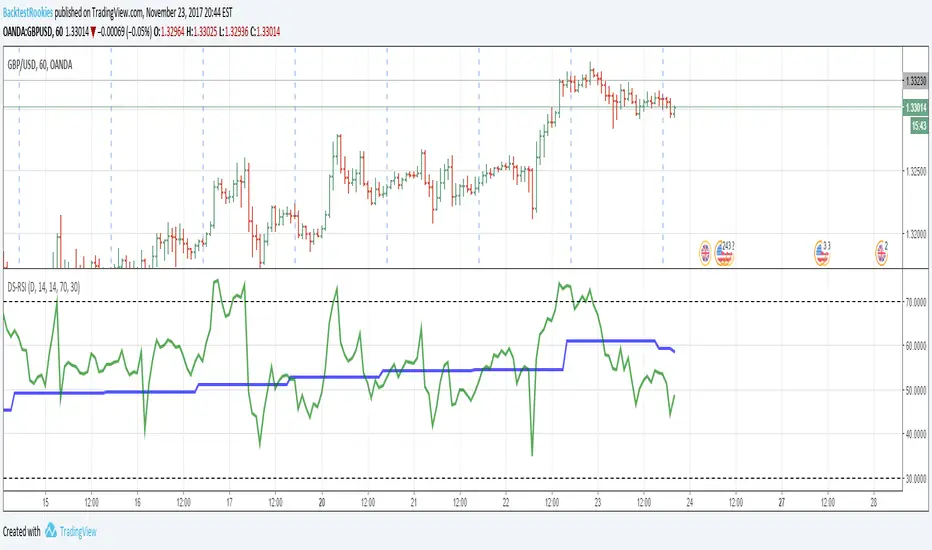
Dual Strength RSIDual Strength RSI Indicator
Republished: The original script violated house rules by including an external link to Backtest Rookies.
Background
This is a simple indicator was designed as part of a tutorial on the Backtest-Rookies website.
Logic
The indicator will plot RSI values from 2 timeframes. The first plotted line will be the current timeframe and the second line will be a user selected timeframe. The theory is that if the instrument is overbought / oversold on two timeframes at the same time, it might be more likely to reverse or revert to the mean.
As with most oscillating indicators, this will likely be most suitable for ranging market conditions.
Examples
Automatic TrendlinesIntroduction
For a full free tutorial explaining this code in more detail, visit the backtest-rookies (.com) website.
This indicator will plot two trend lines at any given time. A resistance trend line and a support trend line. The resistance trend is shown with red circles and is created by joining swing highs together. The second is a support trend which is created by joining swing lows.
Since we need swings to make the trend, the trend line code contains code for the swing detection. You can play around with the swing detection to alter how frequently new trend lines are detected. Relying on swings also means that there will be some delay in trend detection depending on how you configure the swing detection. The higher you set rightbars, the more lag you will have before a trend is detected. However, at the same time the quality of the pivots found will increase. So it is a trade-off you need to come to terms with and decide what the best settings are for you.
Lines
A single trend line is made up of several components.
Pivot Points: Marked as blue or orange circles. There will be two pivots per trend.
Orange/Purple Lines: Connecting all pivot points. You will see these lines change direction slightly each time a new pivot is detected (new circles appear).
Green/Red Circle lines: Showing the trend line from the earliest moment a new trend is detected.
Blue Dashed lines: Joining the purple and green/red circle lines so the full trend line can be seen.
Note: The blue dashed lines use pine-scripts drawing functions. As such, there is a limit to how many of these can be placed on a chart. When the limit is reached, the oldest line will be removed so the newest can be drawn. This means that if you detect enough trends and scroll back in time, the blue dashed lines will disappear at some point!

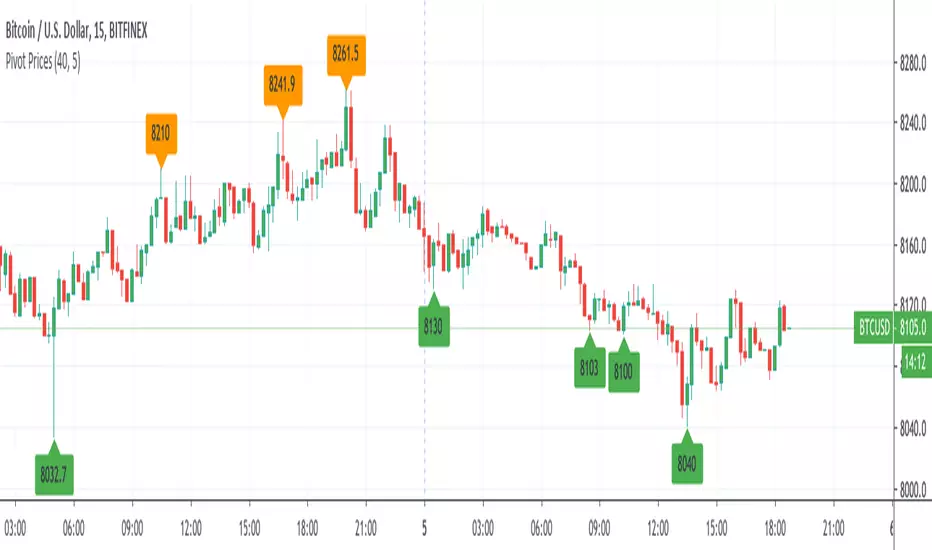
Pivot Prices - ExampleA simple example script showing how to use label.new() to plot pivot prices on the chart.
A full tutorial and commentary is available on the backtest-rookies website.
Volume Profile: Intra-bar VolumeThis indicator was developed as part of a free blog post tutorial on the Backtest-Rookies website for detailed code commentary, head over there.
Scope
The indicator shall attempt to do the following:
Look at a lower time-frame. E.g 5 minutes when on a 1-hour chart.
Create a function to loop through through candles and make an assessment.
If the candle it closed up, the volume will be categorized as buying volume. Conversely, if it closed down, the volume will be categorized as selling volume
The function will then be passed to the security() function to run on a lower timeframe.
All buying volume and selling volume from the lower time-frame shall be summed and displayed on the main chart.
Important Note
This indicator will not give you genuine buying or selling volume. It simply follows the assumption that if price closed up, there must have been more buyers than sellers and if it closed down we assume the opposite.
Usage
In order to use this indicator, users will need to calculate how many lower time-frame bars are contained in the time-frame on the main chart. So for example, the default settings are configured for the indicator to be run on the 1H chart. As a result, we need to set the "Bars on Lower Timeframe" input to 12. This is because there are 12 x 5-minute bars in 60 minutes.

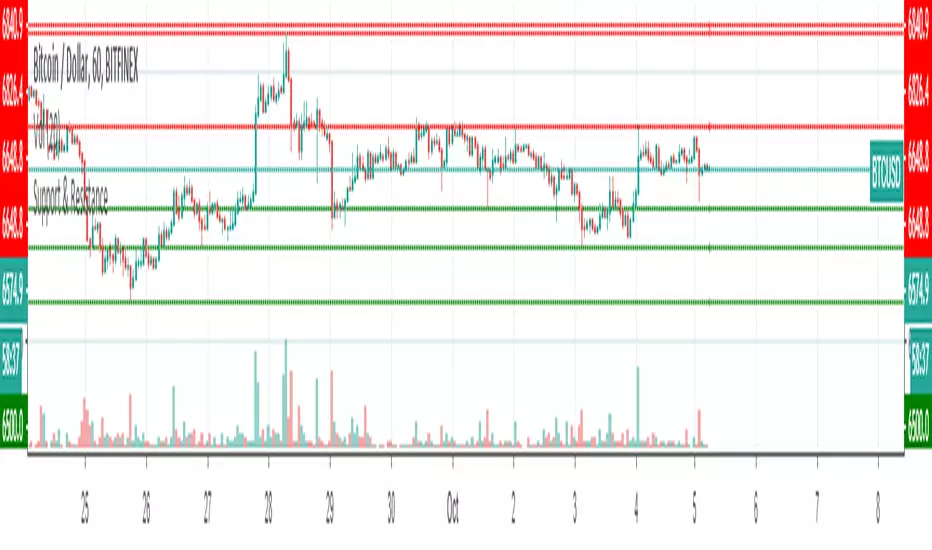
Support & ResistanceThis indicator detects large swings/pivots in historical price action to highlight tops and bottoms which might act as future levels of support or resistance. The code by default detects the last 3 significant swing highs and the last 3 swing lows. It then places lines on the chart to highlight those levels.
For a full overview of the indicator and code commentary visit the backtest-rookies (.com) website.
Example
Dane - MA StudyThis strategy has been developed as a development service. It is published for customer acceptance and verification. As such, I am unable to provide access to anyone other than the paying customer. Sorry about that.
For those interested in development services, please check out the backtest-rookies (.com) website.
MA Study
This is a study version of the Dane - MA Strategy with few extra features:
Position Simulation - So we can synchronise with the strategy.
Alerts for Going Long, Short and exiting positions
Plotting entry/exit and close markers
Plotting dots at the bottom of the chart to show whether we are in a simulated long, short or flat state.

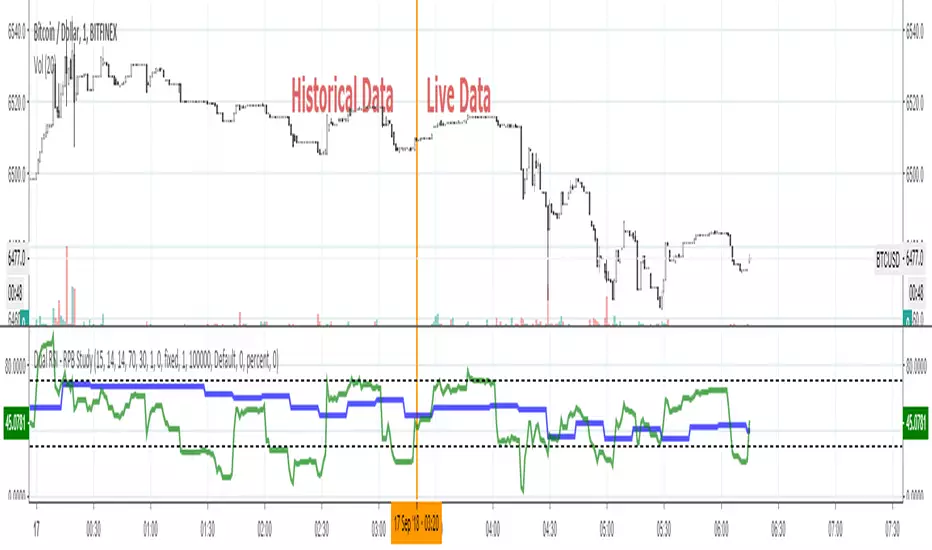
Upper Timeframe - Repaint FixThis script is a proof of concept and one possible solution for how to deal with upper timeframe repainting issues. It works for Strategies only .
Strategies that utilize data from upper timeframes can still be subject to repainting issues when forward testing. Users can copy the code and use a similar solution in your own scripts.
For full code commentary, explanations and examples visit the backtest-rookies (.com) website.
Average DownThis strategy has been published for a Pyramiding tutorial on the Backtest Rookies website.
For a full overview of the code and an introduction to Pyramiding check out our site.
Summary
The code example will create a simple script that allows us to average down whenever our portfolio is down x%. The idea will be to bring our average cost down so that we can still exit with a profit when conditions improve. With this in mind, the strategy shall also have a simple take profit exit at x% above our average price.
Inputs
Target Loss to Average Down (%) : This is the target percentage level will trigger us to average down. In other words, if we have a close below this level from our average buying price, we will average down.
Target Take Profit : A standard take profit percentage level. Use this to set how much profit you will target.
% Of Current Holdings to Buy : Is the number of shares/contracts we will aim to buy when we average down. 50 will mean we buy 50% of our current holdings. So if we have 100 shares, then we buy 50 when we average down.
SMA Period : Defines our SMA lookback period. Our strategy will enter the first/initial position when we have a close above our SMA level.

Dane: RSI MACD StrategyRSI / MACD Divergence Strategy . Published for customer verification and acceptance. Unfortunately, access can only be provided to the customer.
For those interested in custom development services, please visit the backtest-rookies (.com) website for more information.
Features
RSI & Price divergence detection
Open a trade window when trade conditions are met
Enter the trade on confirmation
Stop losses / take profit custom levels based of daily pivot values

Farooq: Bollinger Bands StrategyBollinger Band Strategy developed as a service and published for customer verification and acceptance.
If you are interested in development sevices, please either DM me or visit the Backtest Rookies webiste. If you are looking for free and open source scripts, there are some avaible both on the site and our Tradingview profile.
Overview
Bollinger Strategy base
Added additional, customizable 2nd and 3rd deviation levels
Added ability to switch between long only, short only or long & short strategies
Added option to select which deviation level to buy at
Added option to select which deviation level to sell at
Achmed: Heikinashi Open/CloseHeikinashi strategy that looks for large % changes between the open and close of a bar or the previous open and current close.
This strategy is published for customer verification and acceptance. As such, only the customer shall be granted access.
Features
Heikinashi based strategy that is run on a normal candle chart. This ensures accurate backtest results.
Heikinashi chart is plotted on a subplot
Inputs for defining different entry conditions
Switches to turn different entry criteria on / off
Trailing stop which trails the Heikinashi prices.
Trailing stop plotting on the subplot

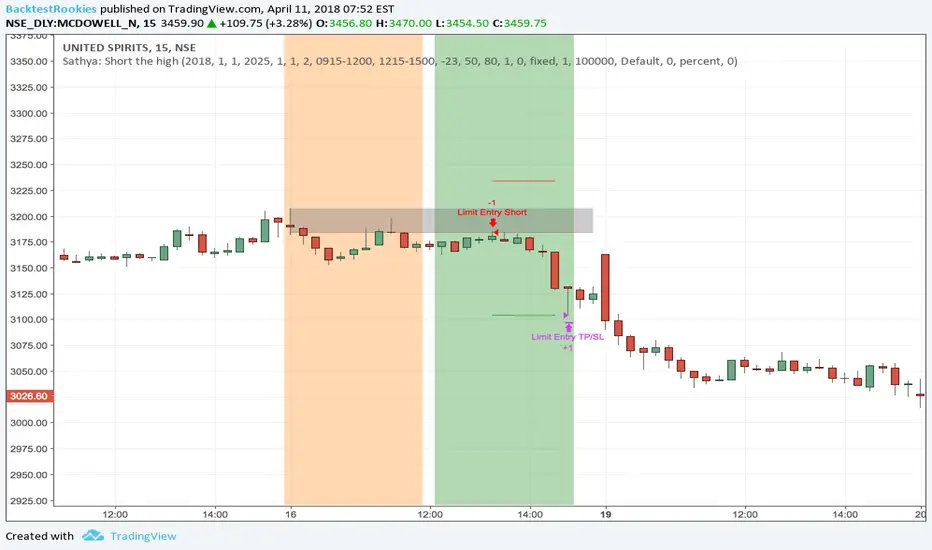
Sathya: Short the highShort the High
This script has been developed as a professional service and is published only for customer verification/acceptance.
If you are interested in development services, either PM me or visit the Backtest-Rookies website (.com)
Summary
This strategy will attempt to take a short position within a time window only after X consecutive up days. Once X consecutive up days have been detected, two windows will open up. The first window tracks the high of the day. The second window will attempt to short the high of the day if price retests it.
Features
Tracking of consecutive up days using intra-day data
Opening a trade window when consecutive up days are detected
Tracking the high of a sub-session (user definable)
Shorting the high during a second sub-session (user definable)
Stop losses and take profits
End of sub-session close out option.
Buffer range from high of the day. So price does not need to retouch the high but can come with x rupees.
Background coloring of sub-sessions so it is easy to track trades
Swing IndicatorThis indicator provides some base code for looping over data to identify swings in price action. Full code commentary can be found on the backtest rookies website.
The indicator shall allow users to "analyse" a recent historical candle to detect whether it was a swing point. This will work by inputting a number to select which historical candle you want to check. The indicator will then check all candles after it until the current candle. It shall also check the same amount of candles before it. If the candle analysed has the lowest low or highest high in the complete range, then we know it was a swing point.

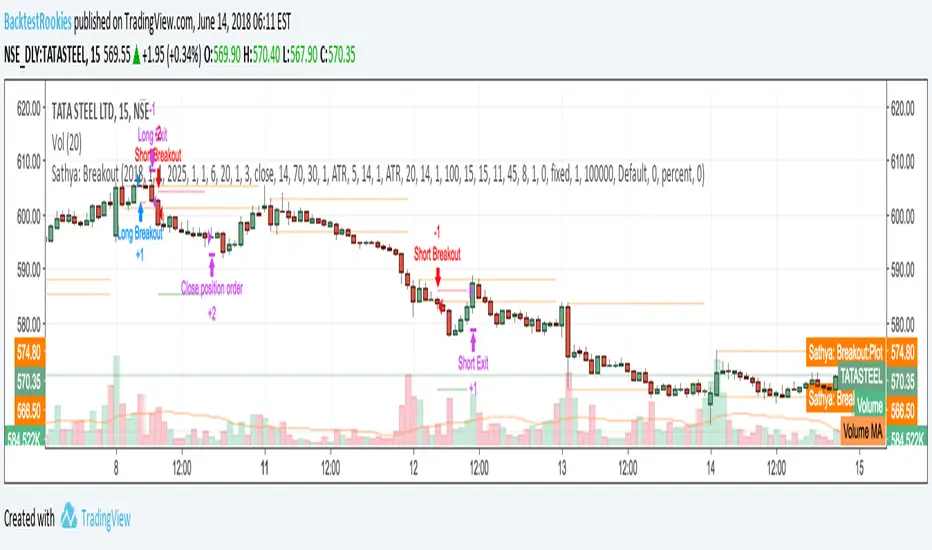
Sathya: BreakoutIntra-day Breakout Strategy: Developed as a professional service and published for customer verification/acceptance.
If you are interested in development services, please visit the backtest-rookies website.
Features
Entry on a breakout from second candle of the session
Breakout tolerance zone to prevent false breaks
Take profit
Stop loss
Timed exit (exit at a specific time of day)
nATR Reversal StrategyATR Reversal Strategy that has been extended to add an additional ATR based stoploss, trailing stop and take profit.
This script was developed as part of a professional development service. It is published for customer verification and acceptance.
For people interested in professional services, please visit the backtest-rookies (.com) website.
Features
nATR based Stop Loss added
nATR based Trailing stop added
nATR based Take profit added
Switches for each exit type to turn them on or off in the strategy
Plotting of all exit levels on the chart
Prevent reversing when using newly added exits.
Allow reversing when all exit switches are off and opposite long/short conditions are met.