Multiple Moving Averages+TransientZones+Volumes///////////////////////////////////////////////////////////////////////////////////////////
//// MULTIPLE_MA+TRANSIENT_ZONES+VOLUMES ////
/////////////////////////////////////////////////////////////////////////////////////////
// @author GianlucaBezziccheri
// A simple script including:
// 1) 4x Simple Moving Averages
// 2) 4x Exponential Moving Averages
// 3) 4x Weighted Moving Averages
// 4) 4x Volume Weighted Moving Averages
// 5) 4x Hull Moving Averages
// 6) Transient Zones v1.1 (by Jurij)
// 7) Volumes
// You can choose MA type you prefer and even to activate all of them at the same time,
// though i don't recommend doing this.
// For more details about 6) check the original script
"averages" için komut dosyalarını ara

Master Moving Averages PlusThe Master Moving Averages indicator is a full-session, moving-average–driven market structure engine that combines 1) Heiken Ashi Candlesticks, 2)Exponential Moving Averages, 3)Session Backgrounds, 4)VWAP, 5)EMA Streams, 6)EMA Crossing Labels, 7)All-Inside EMA Labels, 8)Price Control Logic (Bundles, Momentum, Reversals), and 9)Heavy EMA anchors into a single chart framework. The indicator provides access to toggle these features on and off in the settings gear icon to the right of the indicator name in the screen panel.
1)Because this chart uses Heikin Ashi candlesticks, the behavior is slightly different from standard candles. Heiken Ashi candles are smoothed, meaning each candle is influenced by the previous one. This reduces noise and makes trends easier to see. In practice, long sequences of same-color candles with small or no opposite wicks indicate strong, sustained movement, while smaller bodies or the appearance of opposite wicks signal slowing or transition. Opposite wicks are wicks that appear against the current direction of the move. In an upward move, an opposite wick is a wick on top of the candle. It shows that upward progress is no longer clean and momentum is starting to slow. In a downward move, an opposite wick is a wick on the bottom of the candle. It shows that downward progress is slowing.
With Heiken Ashi candles, opposite wicks are especially important because they do not appear easily. When one shows up, it often marks loss of trend quality, a pause, or the beginning of a transition rather than a random fluctuation. Ashi wicks still matter, but they emphasize trend quality rather than single-bar reactions, making them especially useful for staying in moves longer and avoiding premature exits caused by random price spikes. Candlesticks are a visual record of price behavior over one bar, showing where price opened, traded, and closed. The body shows the meaningful part of the move—the distance between open and close—and tells whether price made progress during that bar. Large bodies indicate clean movement and follow-through, while small bodies indicate slowing or uncertainty. The wicks show where price traveled but did not stay. Wicks in the direction of the move are normal and usually appear during healthy trends, while wicks against the move signal slowing, hesitation, or loss of momentum. A candle with a large body and small wicks reflects strong continuation, whereas long wicks with a small body suggest pause, balance, or transition. Candlesticks are not signals by themselves; they are read bar-to-bar to judge whether a move is continuing, slowing, or stalling, helping decide whether to stay in a trade, manage risk, or wait for clearer structure.
For example, suppose price is moving higher and already in a long trade. Several candles print with solid bodies and small lower wicks, showing steady upward progress. This is healthy continuation, so staying in the trade makes sense. Then a candle prints with a small body and a long upper wick. Price pushed higher during the bar but could not hold those levels by the close. That candle does not mean reverse now, but it does mean momentum is slowing. The practical response is to stay in but be alert—do not expect the same speed of continuation. If the next candle prints another upper wick or a small body, the move is likely stalling. If instead the next candle closes strong with a large body, the trend has resumed.
2)An Exponential Moving Average (EMA) is a moving average that tracks price but gives more weight to the most recent bars. In plain terms: it reacts faster to what price is doing right now than a simple average (SMA) does. Here’s what that means in practice: Every EMA is an average of price over a set number of bars The "exponential" part means the newest candles matter more than older ones. Because of that weighting, an EMA turns sooner, crosses sooner, and shows shifts in directional control sooner. On the chart specifically: Short EMAs (like 4, 9, 16) respond quickly → they show immediate pressure. Mid EMAs (24, 36, 48) show follow-through or failure. Long EMAs (72 and up) change slowly → they define structure and context, often showing the explosive nature of building pressure signaling entries.
3)Session Background gives context to which part of the trading day the current bar or candlestick belongs to. The script separates the day into: Pre-Session, After-Hours and Regular Trading Hours (RTH). Price acts differently depending on the session. Session context is shown on the chart by 1️⃣ Background shading. The lighter background → Pre-session or Pre-Market (PM) and After-hours (AH). The darker background → RTH (Regular Trading Hours). One glance tells you where you are in the day. 2️⃣ Different sessions build different levels of highs and lows: Pre-Session High and Low is built only during After Hours (AH) and pre-market hours (PM). Session High and Low is built only during RTH. Previous Day Session High and Low is carried forward into today. These provide perspective during the session. Sometimes price respects pre-session highs and lows and even previous day session highs and lows— especially immediately following opening in the initial move and retracement. Session context just means knowing whether a particular candlestick bar was or is pre-market, regular hours, or after-hours — because the rules change. It's just a check on where you are.
4)VWAP stands for Volume Weighted Average Price. It is the session’s true average price — weighted by where the volume actually traded. Not yesterday, not overnight, only during Regular Trading Hours. Every share traded during Reg Trading Hours (RTH) pulls VWAP toward it. The VWAP on this chart resets at the RTH open. VWAP uses the average price of each bar, then lets the bars with real volume count more. The calculation is High+ Low+ Close/3. High, Low, Close are added together and averaged. So instead of picking just the close or just the high, it uses the middle of where price actually traded during that bar. The equation looks like this: hlc3 × volume. It only updates during the day session. Overnight and pre-market do not contaminate it. So VWAP belongs to today’s fight only. On the chart it looks like a thick orange line outlined in white. There is a right-side label that reads: VWAP | Bullish / Bearish / Neutral.
In practice VWAP is a 1️⃣ Fair price reference that shows where the bulk of business has been done because if Price is above it → trading is happening at higher-than-average prices. If Price is below it → trading is happening at lower-than-average prices. Fair price is the price level where the most of the trading has actually occurred during the session. It's not a prediction.
It's not a target. It's not a value judgment. It's just where buyers and sellers have been most active. 2️⃣ VWAP slope is smoothed and classified: Rising → Bullish, Falling → Bearish, Flat → Neutral. This doesn’t fire signals — it confirms pressure. VWAP shows where today’s real money has traded and whether that price is drifting up, down, or going nowhere.
The right-side VWAP label summarizes everything in one place: trend state, price distance from VWAP (percentage), and slope strength with direction arrows, allowing quick assessment without clutter. Practically, VWAP is used as a fair-value anchor and intraday control reference—price holding above a rising VWAP supports continuation, price below a falling VWAP supports downside pressure, and flat VWAP conditions warn of rotation or chop rather than trend.
5)EMA (Exponential Moving Average) Streams in this script are a visual state. They are the shaded bands between specific EMA pairs that show: direction, pressure, and alignment. The stream shows the relationship of the pairs. In the script the streams are: 4–9, 9–16, 16–24, 24–36 EMA'S. Each one can be turned on or off. On the chart they look like two EMAs with soft shaded fill between them and color changes based on up or down movement. The stream mechanically is telling 1️⃣ Direction. If the pair is above price they push down, if below price they push up. Each stream is made of two EMAs: One reacts faster, one reacts slower, but they’re doing the same thing. For Example a 4 EMA takes the last 4 candlesticks and averages them; likewise a 9 EMA takes the last 9 candlesticks and averages them yielding two lines, one that moves quicker and one that moves slower. When a slower EMA crosses above a faster EMA it drives price down. When a slower EMA crosses below a faster EMA it drives price up. 2️⃣ Pressure: EMA streams show pressure leaning on price. Wide stream → pressure is expanding. Tight stream → pressure is compressing. Compression matters because it precedes movement.
6)EMA Crossing Labels (Pivots, EMA9, EMA16, EMA24) mark an actual EMA crossover event. The Crossing Labels are white labels attached below or above the candlestick showing price direction. They print only when one EMA physically crosses the price control line. The price control line is a default on the chart and is constant. The priceControlLine = (open + close) / 2. The crossing is confirmed on bar close. If, for example, EMA-16 rolls over the priceControlLine and crosses downward, the label fires indicating that price has stalled or shifted, buyers have lost control, sellers are in control, and the market is trending short. If EMA-24 and EMA-36 follow, pressure is stacking, multiple timeframes confirm, pullbacks become weaker, and price is more likely to continue in the same direction.
7)An Inside EMA label can represent two very different conditions, and context matters. When shorter ranges (such as 9–36, 9-48, or 9–72) compress inside a candle during sideways or low-energy price action, it often reflects chop or rotation, and no immediate expansion is required. In contrast, when deeper ranges (9–106, 9–139, 9–192) collapse inside a single candle—especially near the open or during active sessions—it usually occurs because price is moving faster than the EMAs can respond, signaling elevated energy and the potential for rapid continuation or transition. Practically, Inside labels are conditional triggers: shallow compression can persist, while deep compression demands attention because resolution, when it comes, tends to be decisive.
Example 1: Fast open, real urgency— The market opens and within the first few candles a 9–139 Inside label prints. Price has already moved aggressively, and all EMAs are trapped inside one candle body. In real terms, this means structure has been run over. The practical response is immediate attention: do not hesitate, do not wait for EMAs to fan out. Expect either a fast continuation (often followed quickly by a Bundle or Momentum label) or a sharp stall if momentum fails. Speed matters because the next decision point arrives quickly.
Example 2: Mid-day chop, no urgency—Later in the session, price is rotating sideways and a 9–72 Inside label appears. Price has not traveled far, candles overlap, and no expansion follows. In this case, the label simply confirms compression without pressure. The correct action is no action—continue waiting. No urgency, no expectation of immediate resolution.
Example 3: Transition point—After a trend, a 9–106 Inside prints as bodies shrink. Momentum is already slowing. Here the label marks a transition zone. The practical move is to stop expecting continuation and watch closely: a Momentum or Bundle label confirms continuation, while a Reversal label confirms control change.
8)Price Control Logic is determined by three things working together and the Bundle, Momentum, and Reversal labels are expressions of that control:
1️⃣ Price vs the Price Control Line: The Price Control Line is the midpoint of the candle body. When Price is above it → buyers are controlling closes. When Price is below it → sellers are controlling closes.
2️⃣ EMA Position Relative to Control: When EMAs cross the Price Control Line: EMA crosses up through control → momentum is shifting to buyers. EMA crosses down through control → momentum is shifting to sellers. That’s why labels fire only on those crosses. It marks real control shifts, not wicks.
3️⃣ EMA Stack & Compression: Tight EMA bundles inside the candle body means no one has control yet. EMAs expanding upward means buyers are gaining control. EMAs expanding downward means sellers are gaining control. This is pressure building vs pressure releasing.
Bundle, Momentum, and Reversal labels are confirmation markers, not prediction signals. A Bundle label prints when a compressed EMA cluster (16/24/36/48) resolves back into price with real body momentum and EMA-16 already trending, signaling stored pressure releasing. A Momentum label prints only on sharp expansion, where the candle body is significantly larger than the prior bar, confirming acceleration in the existing direction. A Reversal label marks a true short-term control shift, where EMA-16 flips slope with a momentum candle, signaling buyers and sellers have swapped control—not a wick reaction. Because all labels require body dominance and EMA agreement, they often appear after movement begins, making them reliable tools for confirming pressure, continuation, or control change rather than early entry timing. Visually, each label reinforces direction at a glance. Bullish labels are green, placed below the candle, and use an upward-pointing shape to indicate rising pressure. Bearish labels are red, placed above the candle, and use a downward-pointing shape to indicate falling pressure. Labels sit just off the candle body so price remains clear, and their color, placement, and shape always align with the direction of control.
9) Heavy EMA anchors are the big EMAs. They act like fixed reference points while everything else whips around them. The heavy EMA anchors in this chart are EMA 768,1024, 1250, 1536, 2048, 2700, 3300, 4096. They are displayed only as right-side tags at their current price levels, not as plotted lines. These tags sit on the far right edge of the chart, aligned with the price scale, and are color-matched to their respective EMAs. Their purpose is to show where slow, heavy pressure exists without cluttering price action with lines. When these EMA tags are bundled together and price is trading inside that cluster, the market is compressed and choppy. When the tags separate and price holds above or below the group, structure is returning and directional movement becomes easier. Keeping the tags visible provides instant awareness of whether price is trapped or free, helping filter noise and align the rest of the indicator with the larger structure at all times.

Moving Averages DTMoving Averages Combo: SMA 30-50-100-200 + EMA 5-8-21 (Golden & Death Cross Ready)
This clean and lightweight indicator plots the most used simple and exponential moving averages in one single script — perfect for swing traders, position traders, and scalpers.
— Simple Moving Averages (Daily timeframe focus):
• SMA 30 (Red) — Early trend detection
• SMA 50 (Blue) — Classic medium-term trend
• SMA 100 (Green) — Institutional reference
• SMA 200 (Orange) — The legendary Golden/Death Cross line
— Fast Exponential Moving Averages (Perfect for pullbacks & entries):
• EMA 5 (Purple) — Ultra-fast reaction
• EMA 8 (Yellow) — Fibonacci-based favorite
• EMA 21 (Black) — 21-day cycle + Fibonacci
Why this combination works so well:
• EMA 8 + EMA 21 = Powerful short-term trend filter (used by thousands of crypto & forex traders)
• SMA 50/200 = Classic Golden & Death Cross signals
• SMA 30/100 = Extra confirmation layers used by banks and funds
Features:
✓ All MAs on a single indicator (no chart clutter)
✓ Clean colors with perfect contrast on light/dark themes
✓ Ready for alerts: set alert on EMA 8 crossing EMA 21 or SMA 50 crossing SMA 200
✓ Works on all markets & timeframes (stocks, forex, crypto, futures)
How to use:
• Bullish signal: Price above SMA 200 + EMA 8 > EMA 21 + SMA 50 > SMA 200
• Bearish signal: Price below SMA 200 + EMA 8 < EMA 21
• Pullback entries: Wait for price to touch EMA 21 in uptrend
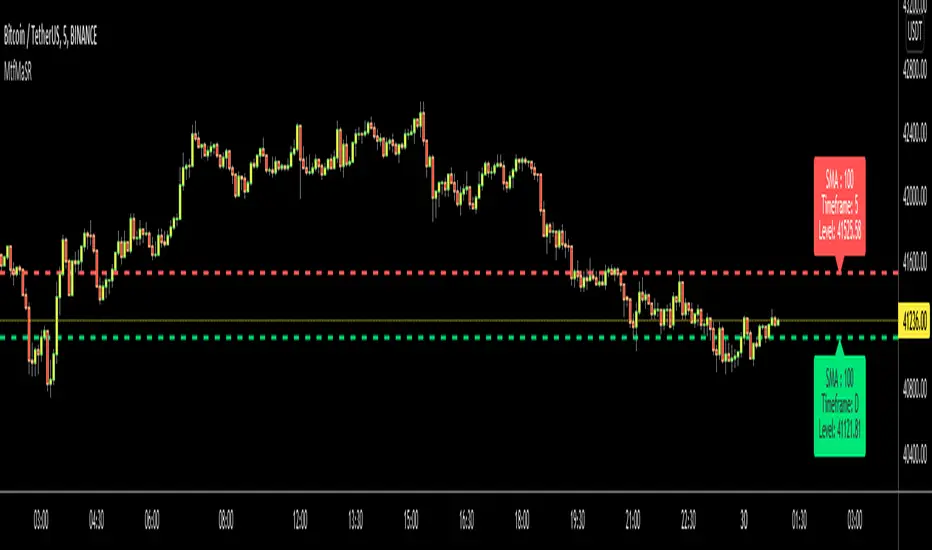
Fixed High Timeframe Moving AveragesFixed High Timeframe Moving Averages (W/D/4H)
Summary
This indicator plots essential, high-timeframe (HTF) Moving Averages onto your chart, **no matter which timeframe you are currently viewing**.
It is designed for traders who need multi-timeframe context at a glance. Stop switching charts to see where the 200-Week or 50-Day MA is—now you can see all critical HTF levels directly on your 5-minute (or any other) chart.
---
Who it’s for
Traders who rely on moving averages but like to work on lower chart timeframes while keeping higher timeframe context in sight. If you scalp on 1–15m yet want Weekly/Daily/4H MAs always visible, this is for you.
---
What it shows
Pinned (“fixed”) moving averages from higher timeframes—Weekly (20/100/200) , Daily (50/100/200/365) and 4H (200) —rendered on any chart timeframe. Your favorite HTF MAs stay on screen no matter what TF you’re currently analyzing.
---
Features
* **MA types:** SMA, EMA, VWMA, Hull.
* **Fully configurable:** toggle each line, set periods, colors, and thickness.
* **Two alert modes (see below):** intrabar vs confirmed HTF close.
* **Works on any symbol & chart TF** using `request.security` to fetch HTF data.
---
Alerts & Modes
This indicator solves the biggest problem with MTF alerts: false signals. You can choose one of two modes:
1. **Intrabar mode** — compares current chart price to the HTF MA. Triggers as soon as price crosses the HTF line; great for early signals but may update until the HTF bar closes.
2. **Confirmed mode** — checks HTF close vs HTF MA. Signals only on the higher-TF bar close; fewer false starts, no intrabar repainting on that TF.
Per-line *Cross Above / Cross Below* conditions are provided for all enabled MAs (e.g., “20W — Cross Above”, “365D — Cross Below”, etc.).
**How to use alerts:** add the script → “Create Alert” → pick any condition from the script’s list.
---
Why this helps
* Keeps Weekly/Daily structure visible while you execute on LTF.
* Classic anchors (e.g., 200D, 20W/100W/200W) are popular for trend bias, dynamic support/resistance, and pullback context.
* Lets you standardize MA references across all your lower-TF playbooks.
---
Notes on confirmation & repainting
* Intrabar signals can change until the higher-TF bar closes (that’s expected with multi-TF data).
* Confirmed mode waits for the HTF close—cleaner, but later. Choose what fits your workflow.
---
Quick setup
1. Pick `MA Type` (SMA/EMA/VWMA/Hull).
2. Enable the HTF lines you want (Weekly 20/100/200; Daily 50/100/200/365; 4H 200).
3. Choose `Alert Mode` (Intrabar vs Confirmed).
4. Style colors/widths to taste and set alerts on the lines you care about.
---
Good practice
* Combine HTF MAs with price action (swings, structure, liquidity grabs) rather than using them in isolation.
* Always validate signals in your execution TF and use a risk plan tailored to volatility.
* Protect your capital: position sizing, stops, and disciplined risk management matter more than any single line on the chart.
---
Disclaimer
For educational/informational purposes only; not financial advice. Trading involves risk—manage it responsibly.

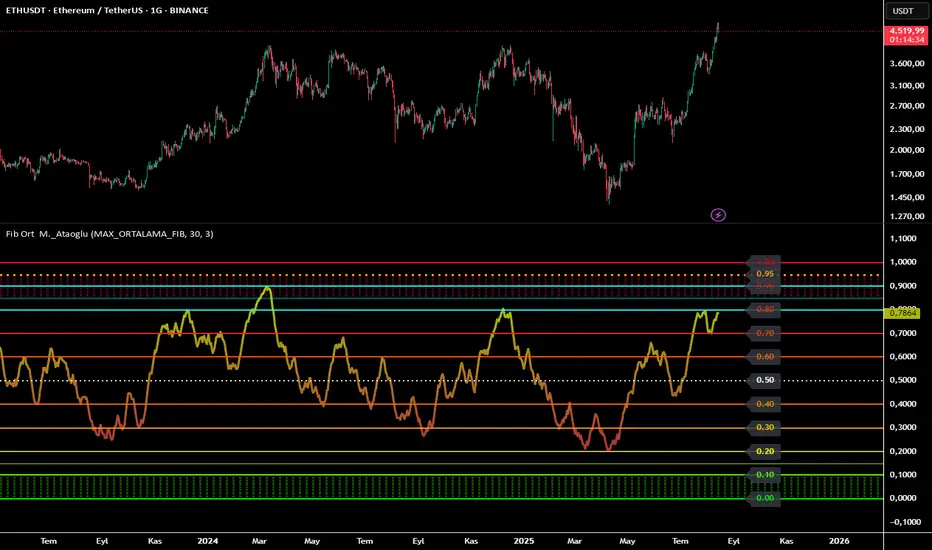
Fibonacci Averages Oscillator M.Ataoglu============================================================================
FIBONACCI AVERAGES OSCILLATOR - TRADINGVIEW DESCRIPTION
============================================================================
📊 Fibonacci Averages Oscillator - Advanced Trend Analysis Tool
This indicator provides comprehensive trend analysis by combining multiple Fibonacci sequence periods into a single oscillator. It calculates trend strength using the mathematical properties of Fibonacci numbers to create a powerful trend detection system.
🔬 HOW IT WORKS:
The indicator uses a sophisticated algorithm that:
• Calculates moving averages for each Fibonacci period individually
• Combines all periods using weighted averaging techniques
• Normalizes the result to a 0-1 scale for easy interpretation
• Applies smoothing algorithms to reduce market noise
• Provides real-time color gradient visualization
📈 KEY FEATURES:
• MAX_ORTALAMA_FIB Mode: Uses average of all 11 Fibonacci periods (recommended)
• Individual Period Selection: Choose specific Fibonacci numbers
• Adaptive Smoothing: Adjustable smoothing parameter (2-70)
• Color Gradient System: Red (bearish) to Green (bullish) progression
• Detailed Level Lines: Precise support/resistance identification
• Neon Cyan Highlights: Special emphasis on key levels
• Performance Optimized: Advanced caching system for smooth operation
🎯 USAGE GUIDE:
• Values above 0.5: Bullish trend strength
• Values below 0.5: Bearish trend strength
• Color changes: Real-time trend strength progression
• Level lines: Key support/resistance identification
• Neon cyan levels: Critical decision points
⚙️ TECHNICAL SPECIFICATIONS:
• Calculation Method: Fibonacci-weighted moving averages
• Timeframe Compatibility: All timeframes (M1 to Monthly)
• Market Compatibility: Forex, Stocks, Crypto, Commodities
• Performance: Optimized for real-time trading
🔧 PARAMETERS:
• Max Fibonacci Number: Select calculation period or use MAX_ORTALAMA_FIB
• Smoothing Level: Adjust trend line smoothness (2-70)
• Trend Color (Low): Customize bearish trend color
• Trend Color (High): Customize bullish trend color
• Trend Line Thickness: Adjust line visibility (1-10)
⚠️ RISK DISCLAIMER:
This indicator is for educational and analysis purposes only. It does not constitute investment advice. Always conduct your own research and consider multiple factors before making trading decisions. Past performance does not guarantee future results.
🔗 CREDITS:
• Fibonacci calculation library: tkarolak
• Developed by: M._Ataoglu
• Version: 1.0
• Pine Script Version: 6
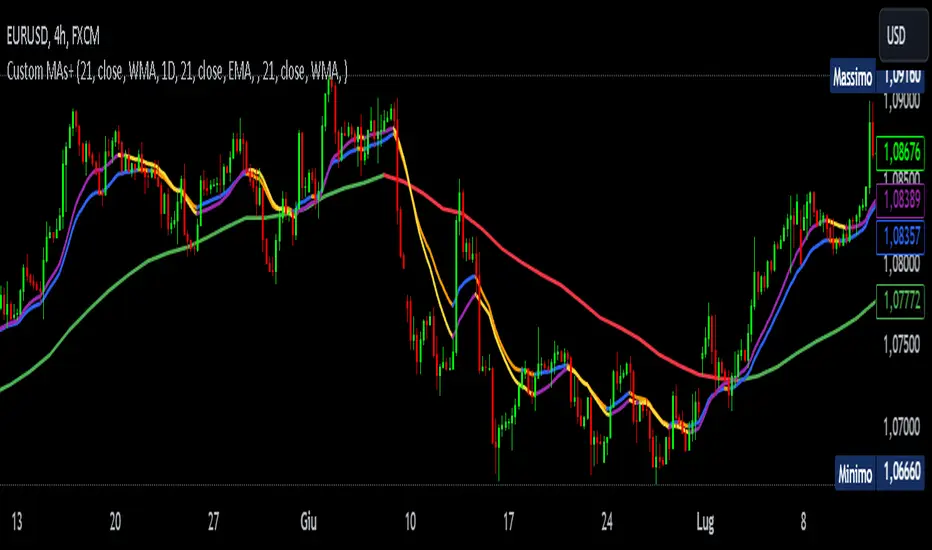
Customizable MTF Multiple Moving AveragesTitle:
Customizable Multiple Moving Averages with Dynamic Colors
Description:
This script allows you to calculate up to three customizable moving averages, offering the flexibility to choose from multiple moving average types:
SMA (Simple Moving Average)
EMA (Exponential Moving Average)
WMA (Weighted Moving Average)
VWMA (Volume Weighted Moving Average)
SMMA (Smoothed Moving Average)
Key Features:
Separate Timeframe for Each Moving Average:
Each moving average can be calculated on a different timeframe. For instance, you can display a 1D moving average while working on a 4H chart.
Dynamic Colors:
Moving averages dynamically change color based on their trend:
Uptrend Color: When the moving average is increasing compared to the previous bar of its timeframe.
Downtrend Color: When the moving average is decreasing.
Full Customization:
Length: Adjust the period for each moving average.
Source: Choose any price data source (e.g., close, open, high, low).
Colors: Set custom colors for uptrend and downtrend behavior.
Perfect For:
Multi-Timeframe Trend Analysis:
Observe trends from higher timeframes without switching your current chart.
Crossover Strategies:
Combine multiple moving averages to identify entry and exit signals.
How to Use:
Load the Script: Apply it to your chart.
Configure Inputs: Adjust each moving average's settings from the input panel.
Analyze Trends: Visualize dynamic trend movements with easy-to-identify colors.
Example Configuration:
Set MA1 to a 50-period EMA on a 4H timeframe.
Set MA2 to a 100-period SMMA on a 1D timeframe.
Set MA3 to a 200-period VWMA on a 1W timeframe.
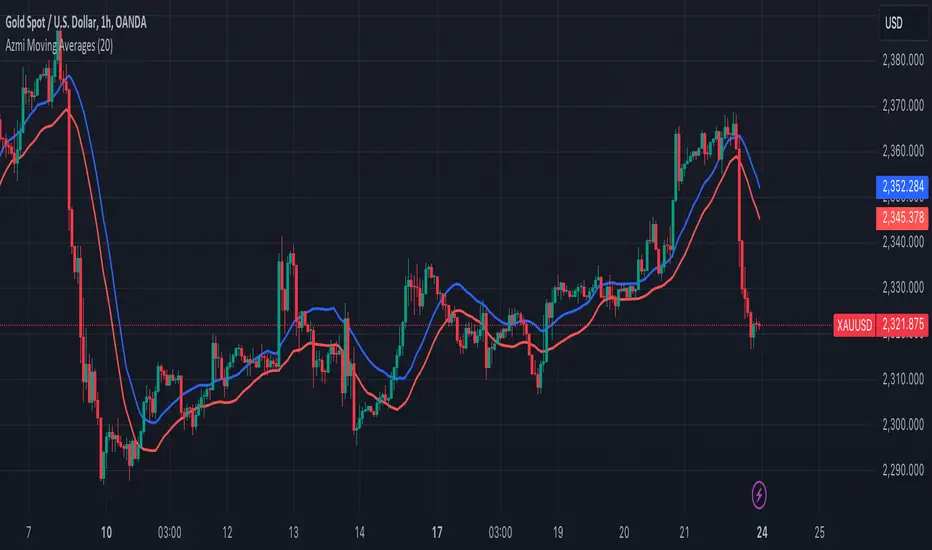
Azmi Moving AveragesThis trading indicator, designed using Pine Script, incorporates two simple moving averages (SMAs) with the same length but different data sources. Here's a detailed description of the indicator:
### Indicator Overview
**Name:** Two Moving Averages
### Inputs
1. **Length (20):** The period over which the moving averages are calculated. Both moving averages use a length of 20 periods.
2. **Source:**
- **High:** The first moving average is calculated using the high prices of the candles.
- **Low:** The second moving average is calculated using the low prices of the candles.
### Calculations
1. **MA High (maHigh):** This is the simple moving average of the high prices over the specified length (20 periods). It smooths the high prices over time, showing the average high price trend.
2. **MA Low (maLow):** This is the simple moving average of the low prices over the same length (20 periods). It smooths the low prices over time, showing the average low price trend.
### Plotting
- **MA High (Blue Line):** This line represents the moving average of the high prices. It is plotted in blue with a line width of 2.
- **MA Low (Red Line):** This line represents the moving average of the low prices. It is plotted in red with a line width of 2.
### Interpretation
1. **Trend Identification:**
- **Bullish Trend:** When the MA High is above the MA Low, it generally indicates a bullish trend, as the average high prices are higher than the average low prices.
- **Bearish Trend:** When the MA High is below the MA Low, it suggests a bearish trend, as the average high prices are lower than the average low prices.
2. **Support and Resistance:**
- The MA High can act as a dynamic resistance level, where the price may face selling pressure.
- The MA Low can act as a dynamic support level, where the price may find buying interest.
3. **Price Channels:**
- The area between the MA High and MA Low creates a channel that can help traders visualize the range within which the price is fluctuating. This channel can be used to identify potential breakout or breakdown points.
### Example Usage
- **Buy Signal:** A potential buy signal may occur when the price crosses above both the MA High and MA Low, indicating a possible upward trend.
- **Sell Signal:** A potential sell signal may occur when the price crosses below both the MA High and MA Low, indicating a possible downward trend.
This indicator provides a visual representation of the average high and low prices, helping traders identify trends, potential support and resistance levels, and price channels for better trading decisions.
Coiled Moving AveragesThis indicator detects when 3 moving averages converge and become coiled. This indicates volatility contraction which often leads to volatility expansion, i.e. large price movements.
Moving averages are considered coiled when the percent difference from each moving average to the others is less than the Coil Tolerance % input value.
This indicator is unique in that it detects when moving averages converge within a specified percent range. This is in contrast to other indicators that only detect moving average crossovers, or the distance between price and a moving average.
This indicator includes options such as:
- % difference between the MAs to be considered coiled
- type and length of MAs
- background color to indicate when the MAs are coiled
- arrows to indicate if price is above or below the MAs when they become coiled
While coiling predicts an increased probability for volatility expansion, it does not necessarily predict the direction of expansion. However, the arrows which indicate whether price is above or below the moving average coil may increase the odds of a move in that direction. Bullish alignment of the moving averages (faster MAs above the slower MAs) may also increase the odds of a bullish break, while bearish alignment may increase the odds of a bearish break.
Note that mean reversion back to the MA coil is common after initial volatility expansion. This can present an entry opportunity for traders, as mean reversion may be followed by continuation in the direction of the initial break.
Experiment with different settings and timeframes to see how coiled MAs can help predict the onset of volatility.

Fibonacci Averages Trend OscillatorOverview:
The Fibonacci Averages Trend Oscillator is a unique technical indicator that leverages Fibonacci numbers to analyze market trends. It calculates the average trend sentiment over periods determined by Fibonacci numbers and smooths the result to create an oscillator.
Key Features:
Uses Fibonacci sequences for trend analysis.
Smooths the trend data to create a clear oscillator.
Offers adjustable oversold and overbought levels for customized analysis.
Inputs:
Max Fib Number: Select the highest Fibonacci number for trend calculation.
Smooth: Adjust the smoothness of the oscillator line.
Using the Oscillator:
A rising oscillator indicates a bullish trend, while a falling oscillator suggests bearish sentiment.
Oversold and overbought levels help identify potential reversal points.
Use the oscillator in conjunction with other indicators for comprehensive market analysis.
Tips for Effective Use:
Adjusting Fibonacci Levels: Experiment with different 'Max Fib Number' settings to find the one that best matches your trading style and the asset's characteristics. Higher Fibonacci numbers consider longer periods, which might be more suitable for long-term trend analysis.
Smoothing Level: The 'Smooth' input helps in reducing noise. A higher smooth level results in a less responsive but smoother line, which can be useful for identifying the overall trend direction.
Interpreting Overbought/Oversold: Watch for the oscillator reaching overbought or oversold levels. These points could signal potential trend reversals or consolidation phases.
Combination with Other Tools: For best results, combine the Fibonacci Averages Trend Oscillator with other technical tools like moving averages, RSI, or MACD to validate the signals and develop a robust trading strategy.
Conclusion:
The Fibonacci Averages Trend Oscillator offers a unique approach to trend analysis by incorporating Fibonacci numbers into its calculation. Its adjustable settings allow for customization to fit various trading styles and market conditions, making it a versatile tool for traders seeking to enhance their technical analysis capabilities.

MTF Moving AveragesThe MTF Moving Averages indicator allows users to plot multiple moving averages on different timeframes within the same chart on TradingView. This indicator supports four different timeframes: daily, weekly, monthly, and intraday.
For each timeframe, users can choose up to four moving averages to plot. They can also select the type of moving average (SMA, EMA, or WMA), the source (e.g., close price), and the length of each moving average. Additionally, users have the option to enable a "Trend Suite" for the second moving average on the daily timeframe. The Trend Suite adds 2 moving averages with source low and high.
In the intraday timeframe, the second moving average is calculated and plotted based on the daily timeframe.
The indicator provides customization options for colors, allowing users to define the colors for each moving average line.
The settings in the indicator are designed in a clear and organized manner.
Have fun

Multiple Exponential Moving AveragesThe "Multiple Exponential Moving Averages" indicator is a custom technical analysis tool created for TradingView. It combines five different Exponential Moving Averages (EMAs) into a single indicator. Each EMA has a user-defined length, and they are plotted on the chart with different colors to differentiate them.
Exponential Moving Averages are commonly used in technical analysis to smooth out price data and identify trends. They give more weight to recent price data, making them more responsive to recent price changes than Simple Moving Averages (SMAs). By combining multiple EMAs with different lengths, TradingView users will no longer have to worry that they will run out of slots when wanting to add new indicators to their chart.

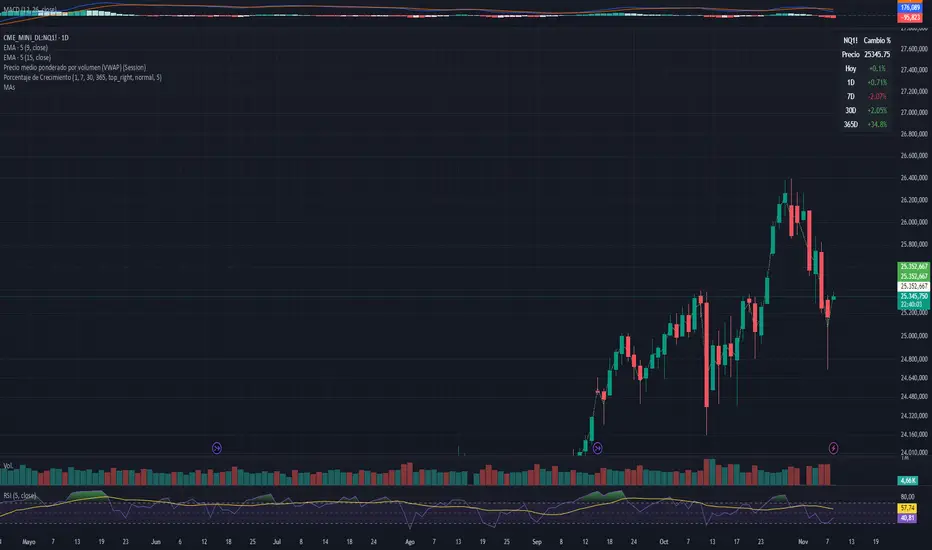
Fibonacci Moving Averages Input(FibMAI) Fibonacci Moving Averages Input is a strategy based on moving averages cross-over or cross-under signals. The bullish golden cross appears on a chart when a stock's short-term moving average crosses above its long-term moving average. The bearish death cross appears on a chart when a stock’s short-term moving average, crosses below its long-term moving average. The general market consensus values used are the 50-day moving average and the 200-day moving average.
With the (FibMAI) Fibonacci Moving Averages Input strategy you can use any value you choose for your bullish or bearish cross. For visual display purposes I have a lot of the Fib Moving Averages 1, 2, 3, 5, 8, 13, 21, 34, 55, 89, 144, 233, 377, 610, 987 shown while hiding the chart candlesticks. But to use this indicator I click on only a couple of MA's to see if there's a notable cross-over or cross-under pattern signal. Then, most importantly, I back test those values into the FibMAI strategy Long or Short settings input.
For example, this NQ1! day chart has it's Long or Short settings input as follows:
Bullish =
FibEMA34
cross-over
FibEMA144
Bearish =
FibEMA55
cross-under
FibSMA144
As you can see you can mix or match 4 different MA's values either Exponential or Simple.
Default color settings:
Rising value = green color
Falling value = red color
Default Visual FibMA settings:
FibEMA's 1, 2, 3, 5, 8, 13, 21, 34, 55, 89, 144, 233, 377, 610, 987, 1597, 2584, 4181
Default Visual MA settings:
SMA's 50, 100, 150, 200
Default Long or Short settings:
Bullish =
FibEMA34
cross-over
FibEMA144
Bearish =
FibEMA55
cross-under
FibSMA144

Moving Averages based on higher TimeframesOVERVIEW
This indicator gives you the possibility to plot up to 10 individually adjustable moving averages on to one chart. You can individualize them based on several criteria.
FEATURES
Type : You can define which type of moving average you want to use. Possible options are EMA, SMA, WMA, HMA, and RMA.
Source : By default, moving averages use the closing price as source, but you can use all OHCL values as source.
Length : Set the length of the moving average.
Timeframe : Select any timeframe the moving average should be based on.
Smooth line : Plot the moving average as a smooth or a stepped line.
Important : This indicator was designed to request values from moving averages of a timeframe higher than the current chart timeframe. It is not recommended to request values from moving averages of a timeframe lower than the current chart timeframe.
If you find errors of any kind or have suggestions to improve this indicator or just want to give some feedback, please feel free to post a comment below.

STD-Stepped, Variety N-Tuple Moving Averages [Loxx]STD-Stepped, Variety N-Tuple Moving Averages is the standard deviation stepped/filtered indicator of the following indicator
Variety N-Tuple Moving Averages is a moving average indicator that allows you to create 1- 30 tuple moving average types; i.e., Double-MA, Triple-MA, Quadruple-MA, Quintuple-MA, ... N-tuple-MA. This version contains 5 different moving average types including T3. A list of tuples can be found here if you'd like to name the order of the moving average by depth: Tuples extrapolated
STD-Stepped, You'll notice that this is a lot of code and could normally be packed into a single loop in order to extract the N-tuple MA, however due to Pine Script limitations and processing paradigm this is not possible ... yet.
If you choose the EMA option and select a depth of 2, this is the classic DEMA ; EMA with a depth of 3 is the classic TEMA , and so on and so forth this is to help you understand how this indicator works. This version of NTMA is restricted to a maximum depth of 30 or less. Normally this indicator would include 50 depths but I've cut this down to 30 to reduce indicator load time. In the future, I'll create an updated NTMA that allows for more depth levels.
This is considered one of the top ten indicators in forex. You can read more about it here: forex-station.com
How this works
Step 1: Run factorial calculation on the depth value,
Step 2: Calculate weights of nested moving averages
factorial(nemadepth) / (factorial(nemadepth - k) * factorial(k); where nemadepth is the depth and k is the weight position
Examples of coefficient outputs:
6 Depth: 6 15 20 15 6
7 Depth: 7 21 35 35 21 7
8 Depth: 8 28 56 70 56 28 8
9 Depth: 9 36 34 84 126 126 84 36 9
10 Depth: 10 45 120 210 252 210 120 45 10
11 Depth: 11 55 165 330 462 462 330 165 55 11
12 Depth: 12 66 220 495 792 924 792 495 220 66 12
13 Depth: 13 78 286 715 1287 1716 1716 1287 715 286 78 13
Step 3: Apply coefficient to each moving average
For QEMA, which is 5 depth EMA , the caculation is as follows
ema1 = ta. ema ( src , length)
ema2 = ta. ema (ema1, length)
ema3 = ta. ema (ema2, length)
ema4 = ta. ema (ema3, length)
ema5 = ta. ema (ema4, length)
qema = 5 * ema1 - 10 * ema2 + 10 * ema3 - 5 * ema4 + ema5
Included:
Alerts
Loxx's Expanded Source Types
Bar coloring
Signals
Standard deviation stepping

STD-Filtered Variety RSI of Double Averages w/ DSL [Loxx]STD-Filtered Variety RSI of Double Averages w/ DSL is a standard deviation step filtered RSI indicator that is calculated using double smoothing. The user can choose from 8 different RSI types and 38 different double smoothing types. This indicator uses Discontinued Signal Lines instead of regular signals and levels. This allows the signals to be more precise in catching early trend breakouts and breakdowns.
Things to note
Double smoothing of the source does not function like DEMA, for example. This double smoothing is just smoothing of smoothing of source
There are two types of smoothing for Discontinued Signals Lines: Regular EMA and Fast EMA
T3 RSI has been added on top of Loxx's Variety RSI library
Contained inside this indicator
Loxx's Moving Averages
Loxx's Variety RSI
Related indicators
Corrected RSI w/ Floating Levels
Adaptive, Jurik-Filtered, Floating RSI
Variety RSI w/ Dynamic Zones
Included
Bar coloring
Alerts
2 types of signals with precision adjustment
Loxx's Variety RSI
Loxx's Moving Averages

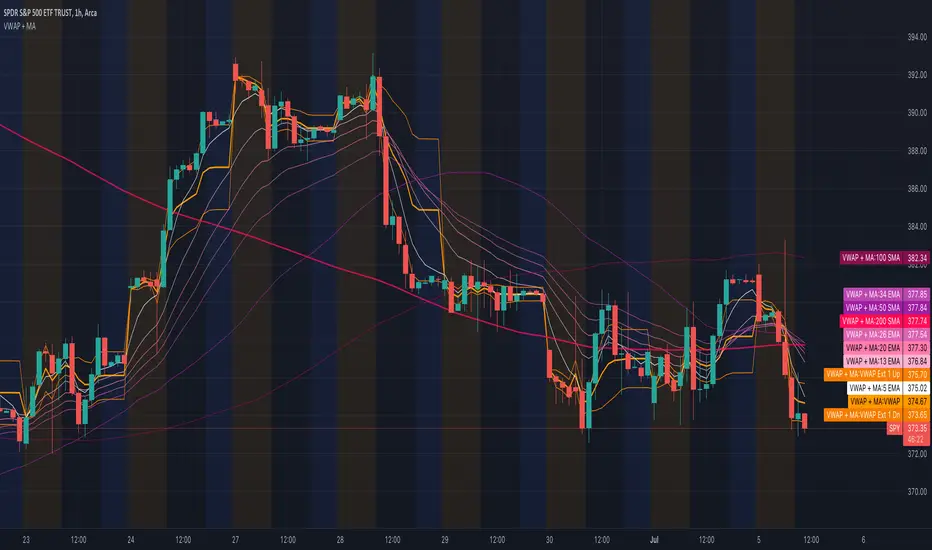
All Moving Averages + VWAPCombines VWAP and Moving Average indicators into one single indicator.
VWAP Indicators
Anchored VWAP (you can change the anchor, default 1 day)
VWAP Standard Deviations (editable, default 1 and 2)
VWAP Fibonacci Deviations (editable, default 61.8% and 161.8%)
Fill Colors for the VWAP extensions to essentially create VWAP channels.
Moving Averages
5 Custom Moving Averages
Moving Average Types for each custom average
Most popular/widely used Moving Averages (algos and others use these most often, backtested. Some disabled by default)
List of most popular Moving Averages
5 EMA
13 EMA
20 EMA
26 EMA
34 EMA
50 EMA
50 SMA
100 EMA
100 SMA
200 EMA
200 SMA
400 SMA
Note: There are 52 weeks in a year, so 26 EMA is half of 52, 13 is half of 26.
Many traders use Moving Average Clouds, which use 5 and 13 for the first, 34 and 50 for the second.
SPY loves 200 SMA
Aggregated Moving AveragesUsers can display moving averages from higher time frame charts and display them on their current chart. This script supports up to 4 moving averages aggregated from a selected time frame. Each plot can be toggled if the user does not wish to have all 4 plots displayed.
Inputs allow user to edit:
Moving average length
Average type
Color
Timeframe input allows user to select which timeframe the moving averages are calculated from.
If you wish to have multiple timeframes across different moving averages, it is recommended you add a separate copies of the indicator for each timeframe you wish to display. Toggle visibility of which plots which you don't need.
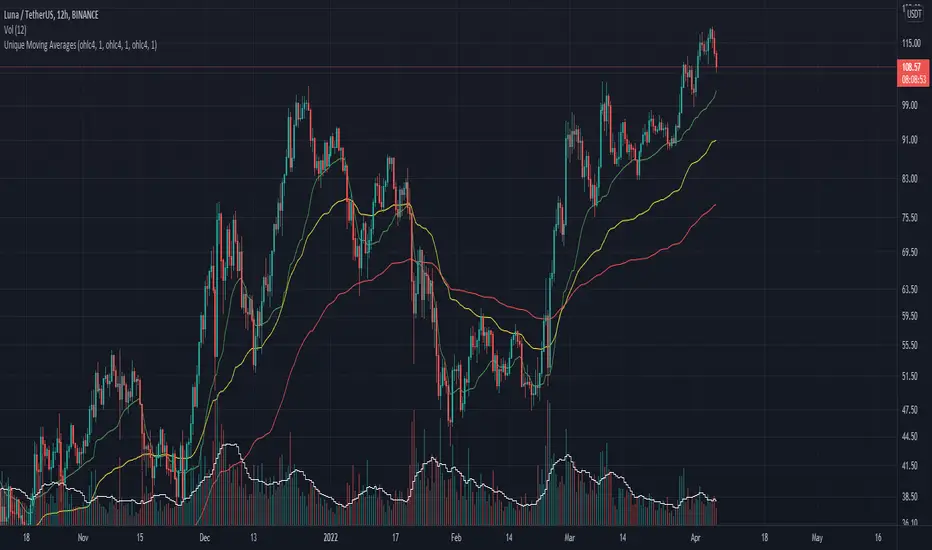
Unique Moving AveragesThese are Unique Variable Moving Averages based off an idea from LazyBear that use volatility in determining a smoothing constant. The twist is that this script uses the extremity of a Volume based RSI reading (of various lengths for each band) to determine the length of each moving average. The potential lengths for each band increase exponentially, meaning the green band will always be faster than yellow, and yellow faster than red.
For this reason I was unable to allow user inputs to control lengths of the averages, but I did give controls to a multiplier for this function. Basically if you want them to move faster, input a value less than 1, and if you want them to move slower input a number larger than 1. I would only recommend that if you are going to change this multiplier then use the same value for all three bands.
In essence, this indicator makes needlessly complex calculations to derive these averages yet is almost overly simple to use. It uses a smoothing constant derived from volatility and then determines how closely to follow price based on volume backed price movement.
I have had success in trading the crossovers, and current backtests look promising. One of my favorite trading methods with this indicator is to pick two of the averages and trade the crossover, then use the quicker average as a trailing stop. For Example, if the yellow crosses above the red; initiate a long trade at which point the yellow line becomes the trailing stop. The same would apply for the yellow / green pair.
Let me know if you find it useful or if you have any ideas for backtesting.
Have a good day!
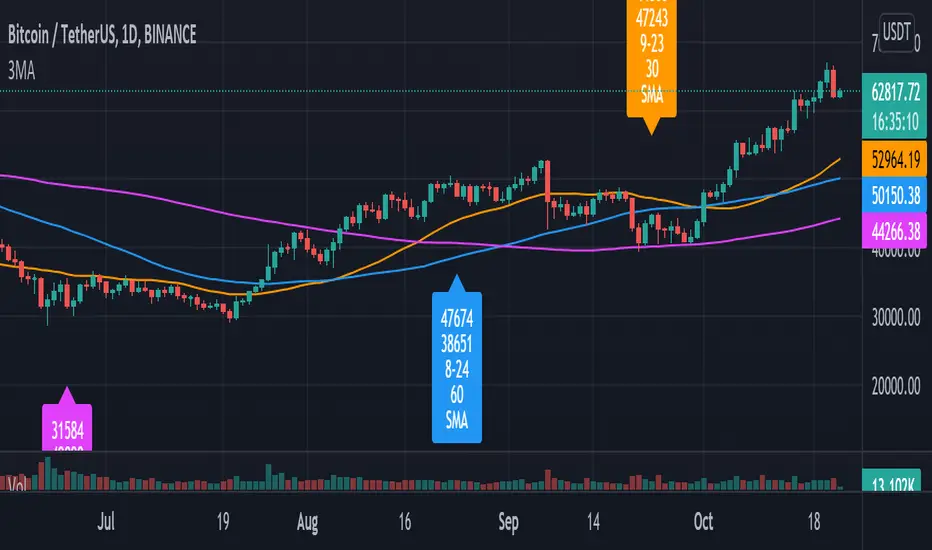
Pulu's 3 Moving Averages
Pulu's 3 Moving Averages
Release version 1, date 2021-09-28
This script allows you to customize three sets of moving averages, turn on/off, set color and parameters. It also tags the start date of the last set of moving average if there is. This, release version 1, supports eight moving average algorithms:
ALMA, Arnaud Legoux Moving Average
EMA, Exponential Moving Average
RMA, Adjusted exponential moving average (aka Wilder’s EMA)
SMA, Simple Moving Average
SWMA, Symmetrically-Weighted Moving Average
VWAP, Volume-Weighted Average Price
VWMA, Volume-Weighted Moving Average
WMA, Weighted Moving Average
The availability and function parameters
Func. Availability Parameters
ALMA
MA1, MA2, MA3
source
length
offset
sigma
EMA
RMA
SMA
VWMA
WMA
MA1, MA2, MA3
source
length
SWMA
VWAP
MA1
source
Parameters
Parameter Description
source the series of values to process. The default is to use the closing price to calculate the moving average.
length an integer value that defines the number of bars to calculate the moving average on. The SWMA and VWAP do not use this parameter.
ALMA offset a floating-point value that controls the tradeoff between smoothness (with a value closer to 1) and responsiveness (with a value closer to 0). This parameter is only used by ALMA.
ALMA sigma a floating-point value that specifies the ALMA’s smoothness. The larger this value, the smoother the moving average is. This parameter is only used by ALMA.
I'm not sure if it is needed, so I do not let the three Moving Averages of the script to have indivial algorithm setting. Because that will involve much complicated condition testing and use up more TradingView script lines limit. If you need to combine different algorithms in the three sets of moving averages, or have other ideas, leave a message to let me know; maybe I will try it in the next update.
我不確定是否需要,所以我沒有讓腳本的三組移動平均線有各別的算法設置。因為這將涉及更多複雜的條件測試,並使用更多 TradingView 腳本列數限制。如果您需要在三組均線中組合不同的算法,或者有其他想法,請留言告訴我;也許我會在下一次更新中嘗試。
Trend System Multiple Moving Averages RatingThis is a trend system made with multiple moving averages designed especially for trending markets such as stocks or crypto.
It can be used with any timeframe.
Its made of multiple moving averages such as
Simple
Weighted
Volume Weighted
Exponential
Double EMA
Arnaud Legoux
Hull MA
Smoothed
Least Squares
Kaufman Adaptive
Triple EMA
Zero Lag
Fractal Adaptive
Variable Index Dynamic Average
Jurik Moving Average
Tillson
Triangular
Avg of all moving averages
It has also a rating, making an avg from all of the moving averages , going from -100 (all ma's are telling to go short ) to 100 ( all ma are telling to go long).
If you have any questions let me know !

Moving Averages as Support Resistance MTFHello Traders!
As most of you know that Moving Averages with the lengths 50, 100, 150 and 200 are very important. We should use these this moving averages to figure out S/R levels, the possible reversals points, trend direction etc. we should check these moving averages on Higher Time Frames as well. for example if you look at the chart with 5mins time frame, you should also check it in 1hour and 4hour time frames to see to big picture and main trend. this is important as trend is your friend and you should not take positions against the trend.
I developed this script to show them clearly and make the chart understandable. 1 resistance line above the price and 1 support line below the price, it shows the moving average type, length, time frame and S/R level.
You have option to show SMA or EMA and to include/exclude current time frame, because you may want to see only MAs from higher time frames. you should set higher time frames accordingly.
if you add all moving averages for current and higher time frame the chart looks very crowded as following example:
The script makes it clear to understand the chart better, here an example:
It can show when S/R was broken and you get alert. here an example:
You have coloring and style options, you can change line style and colors as you wish:
Enjoy!
Uber Moving Averages [UTS]Uber Moving Averages are four highly customisable moving averages to complement your technical analysis.
The optional trend direction visualisation makes it a powerful tool for trend weighted analysis.
Moving Averages
16 different Moving Averages are at your disposal.
Trend Visualisation
If the predominant trend direction is DOWN the moving average is painted red. If the trend direction is UP the moving average is painted in green.
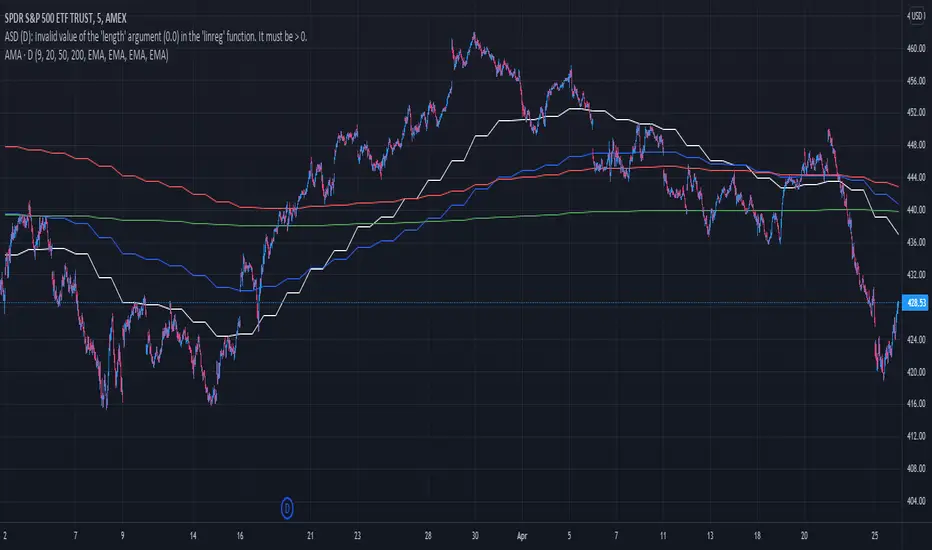
Adaptive Moving AveragesThis script is able to adaptively show different moving averages, depending on the timeframe.
The default values are:
-8 weekly EMA
-20,50,100 and 200 SMA
-4 hourly 50 EMA
-Hourly 50 EMA
-15 minutes 20 SMA
These moving averages are the ones I use the most, and were originally covered in a video by Financial Freedom (Nasir Jones) called " HOW TO USE MOVING AVERAGES- BTC CASE STUDY" (Highly recommended).
Feel free to change the default values. Also, if you don't want to show certain moving averages, go to style and just untick the visibility checkbox of the ones you don't want to see.
