Ergotic TSI Strategy Backtest r - Length of first EMA smoothing of 1 day momentum 4
s - Length of second EMA smoothing of 1 day smoothing 8
u- Length of third EMA smoothing of 1 day momentum 6
Length of EMA signal line 3
Source of Ergotic TSI Close
This is one of the techniques described by William Blau in his book "Momentum,
Direction and Divergence" (1995). If you like to learn more, we advise you to
read this book. His book focuses on three key aspects of trading: momentum,
direction and divergence. Blau, who was an electrical engineer before becoming
a trader, thoroughly examines the relationship between price and momentum in
step-by-step examples. From this grounding, he then looks at the deficiencies
in other oscillators and introduces some innovative techniques, including a
fresh twist on Stochastics. On directional issues, he analyzes the intricacies
of ADX and offers a unique approach to help define trending and non-trending periods.
You can use in the xPrice any series: Open, High, Low, Close, HL2, HLC3, OHLC4 and ect...
You can change long to short in the Input Settings
Please, use it only for learning or paper trading. Do not for real trading.
"algo" için komut dosyalarını ara

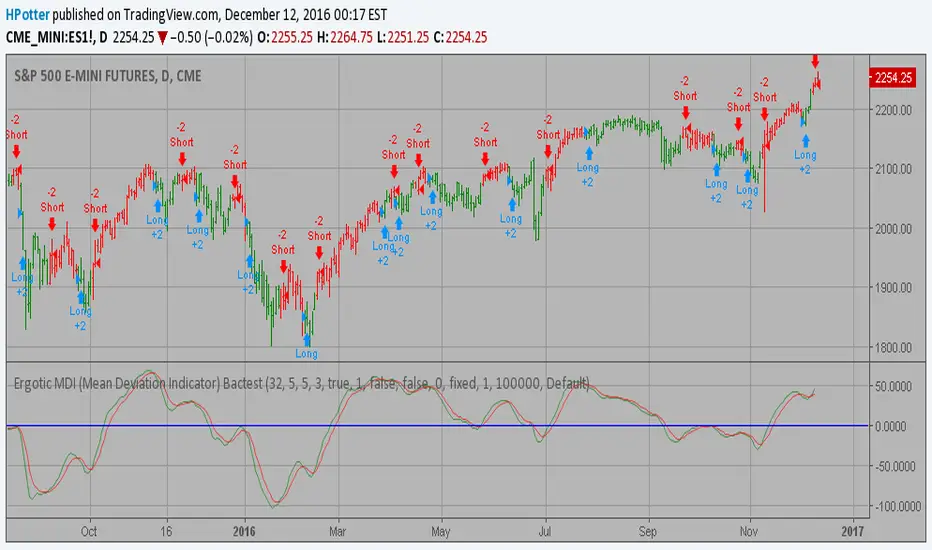
Ergotic MDI (Mean Deviation Indicator) Bactest This is one of the techniques described by William Blau in his book "Momentum,
Direction and Divergence" (1995). If you like to learn more, we advise you to
read this book. His book focuses on three key aspects of trading: momentum,
direction and divergence. Blau, who was an electrical engineer before becoming
a trader, thoroughly examines the relationship between price and momentum in
step-by-step examples. From this grounding, he then looks at the deficiencies
in other oscillators and introduces some innovative techniques, including a
fresh twist on Stochastics. On directional issues, he analyzes the intricacies
of ADX and offers a unique approach to help define trending and non-trending periods.
You can change long to short in the Input Settings
Please, use it only for learning or paper trading. Do not for real trading.
Ergotic MACD Strategy Backtest This is one of the techniques described by William Blau in his book
"Momentum, Direction and Divergence" (1995). If you like to learn more,
we advise you to read this book. His book focuses on three key aspects
of trading: momentum, direction and divergence. Blau, who was an electrical
engineer before becoming a trader, thoroughly examines the relationship
between price and momentum in step-by-step examples. From this grounding,
he then looks at the deficiencies in other oscillators and introduces some
innovative techniques, including a fresh twist on Stochastics. On directional
issues, he analyzes the intricacies of ADX and offers a unique approach to help
define trending and non-trending periods.
Blau`s indicator is like usual MACD, but it plots opposite of meaningof
stndard MACD indicator.
You can change long to short in the Input Settings
Please, use it only for learning or paper trading. Do not for real trading.

Elder Ray (Bull Power) Strategy Backtest Developed by Dr Alexander Elder, the Elder-ray indicator measures buying
and selling pressure in the market. The Elder-ray is often used as part
of the Triple Screen trading system but may also be used on its own.
Dr Elder uses a 13-day exponential moving average (EMA) to indicate the
market consensus of value. Bull Power measures the ability of buyers to
drive prices above the consensus of value. Bear Power reflects the ability
of sellers to drive prices below the average consensus of value.
Bull Power is calculated by subtracting the 13-day EMA from the day's High.
Bear power subtracts the 13-day EMA from the day's Low.
You can use in the xPrice any series: Open, High, Low, Close, HL2, HLC3, OHLC4 and ect...
You can change long to short in the Input Settings
Please, use it only for learning or paper trading. Do not for real trading.

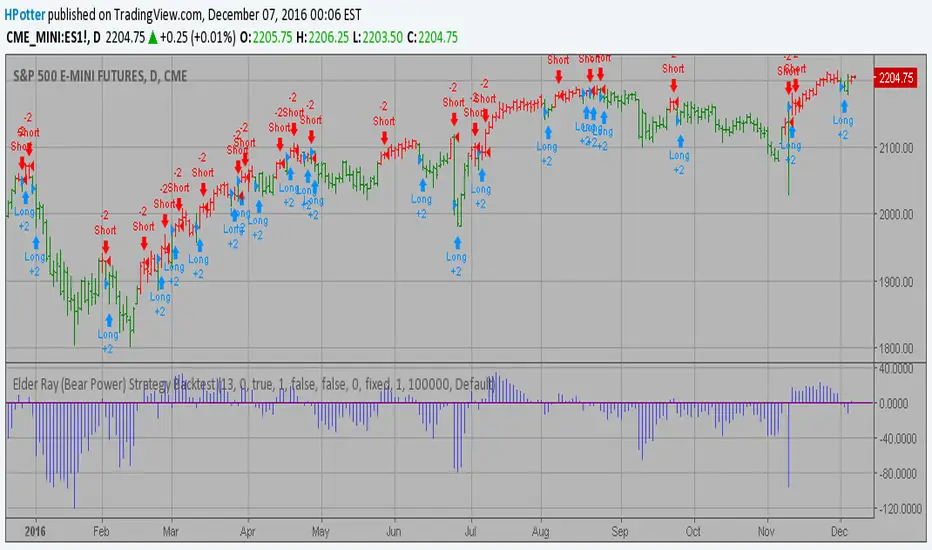
Elder Ray (Bear Power) Strategy Backtest Developed by Dr Alexander Elder, the Elder-ray indicator measures buying
and selling pressure in the market. The Elder-ray is often used as part
of the Triple Screen trading system but may also be used on its own.
Dr Elder uses a 13-day exponential moving average (EMA) to indicate the
market consensus of value. Bear Power measures the ability of sellers to
drive prices below the consensus of value. Bear Power reflects the ability
of sellers to drive prices below the average consensus of value.
Bull Power is calculated by subtracting the 13-day EMA from the day's High.
Bear power subtracts the 13-day EMA from the day's Low.
You can use in the xPrice any series: Open, High, Low, Close, HL2, HLC3, OHLC4 and ect...
You can change long to short in the Input Settings
Please, use it only for learning or paper trading. Do not for real trading.
ECO Strategy Backtest We call this one the ECO for short, but it will be listed on the indicator list
at W. Blau’s Ergodic Candlestick Oscillator. The ECO is a momentum indicator.
It is based on candlestick bars, and takes into account the size and direction
of the candlestick "body". We have found it to be a very good momentum indicator,
and especially smooth, because it is unaffected by gaps in price, unlike many other
momentum indicators.
We like to use this indicator as an additional trend confirmation tool, or as an
alternate trend definition tool, in place of a weekly indicator. The simplest way
of using the indicator is simply to define the trend based on which side of the "0"
line the indicator is located on. If the indicator is above "0", then the trend is up.
If the indicator is below "0" then the trend is down. You can add an additional
qualifier by noting the "slope" of the indicator, and the crossing points of the slow
and fast lines. Some like to use the slope alone to define trend direction. If the
lines are sloping upward, the trend is up. Alternately, if the lines are sloping
downward, the trend is down. In this view, the point where the lines "cross" is the
point where the trend changes.
When the ECO is below the "0" line, the trend is down, and we are qualified only to
sell on new short signals from the Hi-Lo Activator. In other words, when the ECO is
above 0, we are not allowed to take short signals, and when the ECO is below 0, we
are not allowed to take long signals.
You can change long to short in the Input Settings
Please, use it only for learning or paper trading. Do not for real trading.

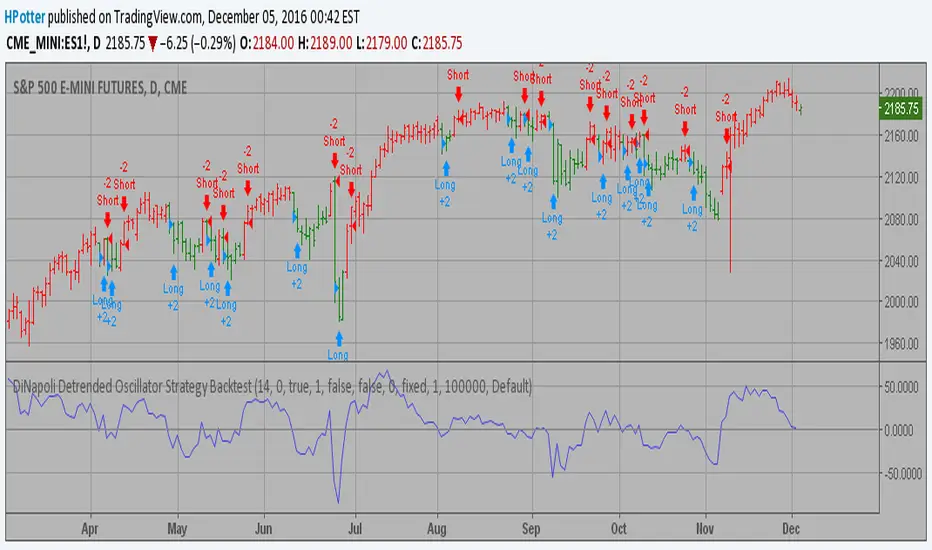
DiNapoli Detrended Oscillator Strategy Backtest DiNapoli Detrended Oscillator Strategy
You can change long to short in the Input Settings
Please, use it only for learning or paper trading. Do not for real trading.
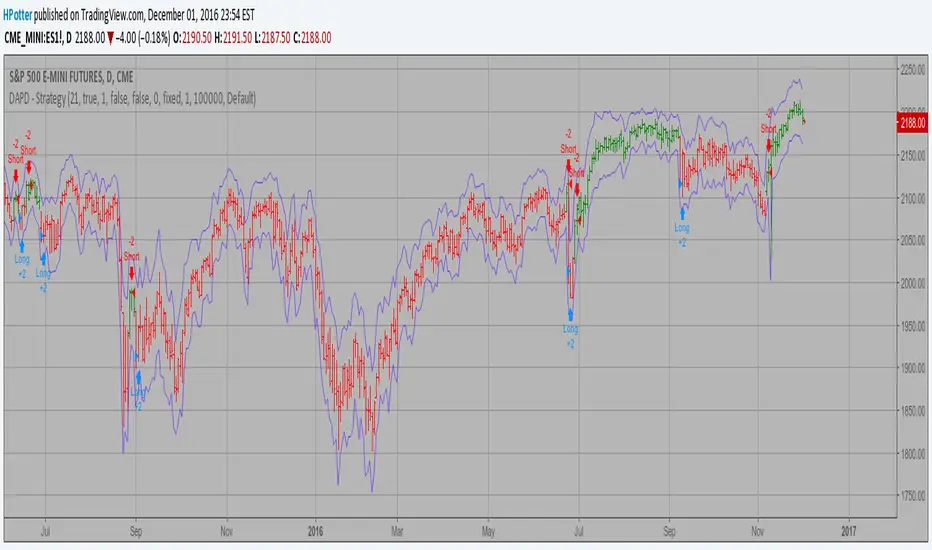
DAPD - Strategy Backtest This indicator is similar to Bollinger Bands. It based on DAPD - Daily
Average Price Delta. DAPD is based upon a summation for each of the
highs (hod) for the 21 days prior to today minus the summation for
each of the lows (lod) for the last 21 days prior to today. The result
of this calculation would then be divided by 21.
It will be buy when high above previos DAPD high and sell if low below previos DAPD low
You can change long to short in the Input Settings
Please, use it only for learning or paper trading. Do not for real trading.
Chaikin Volatility Strategy Backtest Chaikin's Volatility indicator compares the spread between a security's
high and low prices. It quantifies volatility as a widening of the range
between the high and the low price.
You can use in the xPrice1 and xPrice2 any series: Open, High, Low, Close, HL2,
HLC3, OHLC4 and ect...
You can change long to short in the Input Settings
Please, use it only for learning or paper trading. Do not for real trading.

CCI Strategy Reversed Backtest The Commodity Channel Index (CCI) is best used with markets that display cyclical or
seasonal characteristics, and is formulated to detect the beginning and ending of these
cycles by incorporating a moving average together with a divisor that reflects both possible
and actual trading ranges. The final index measures the deviation from normal, which indicates
major changes in market trend.
To put it simply, the Commodity Channel Index (CCI) value shows how the instrument is trading
relative to its mean (average) price. When the CCI value is high, it means that the prices are
high compared to the average price; when the CCI value is down, it means that the prices are low
compared to the average price. The CCI value usually does not fall outside the -300 to 300 range
and, in fact, is usually in the -100 to 100 range.
You can change long to short in the Input Settings
Please, use it only for learning or paper trading. Do not for real trading.

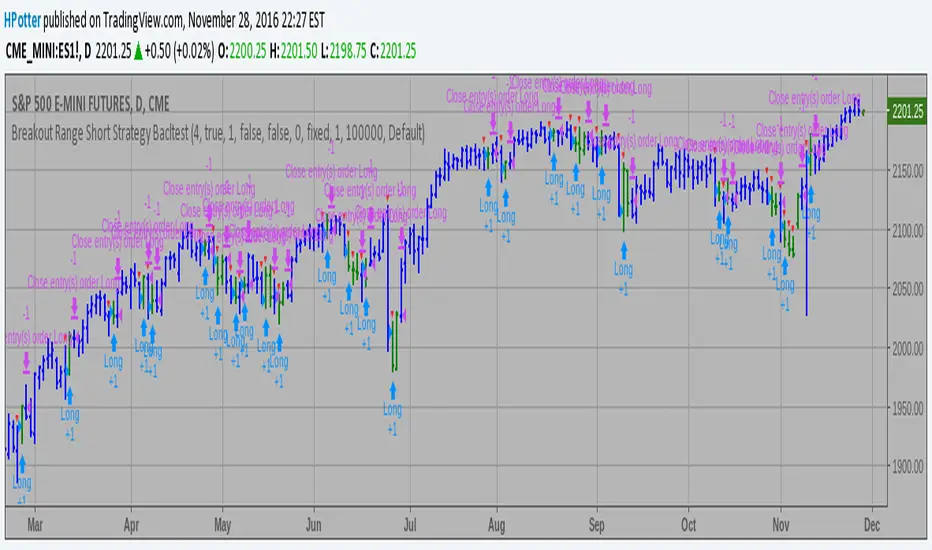
Breakout Range Short Strategy BacktestBreakout Range Short Strategy
You can change long to short in the Input Settings
Please, use it only for learning or paper trading. Do not for real trading.
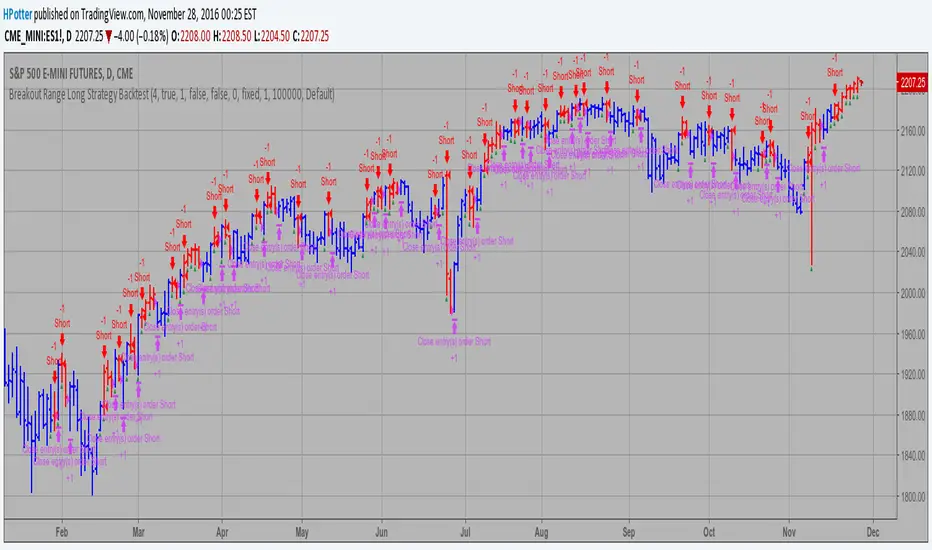
Breakout Range Long Strategy Backtest Breakout Range Long Strategy
You can change long to short in the Input Settings
Please, use it only for learning or paper trading. Do not for real trading.
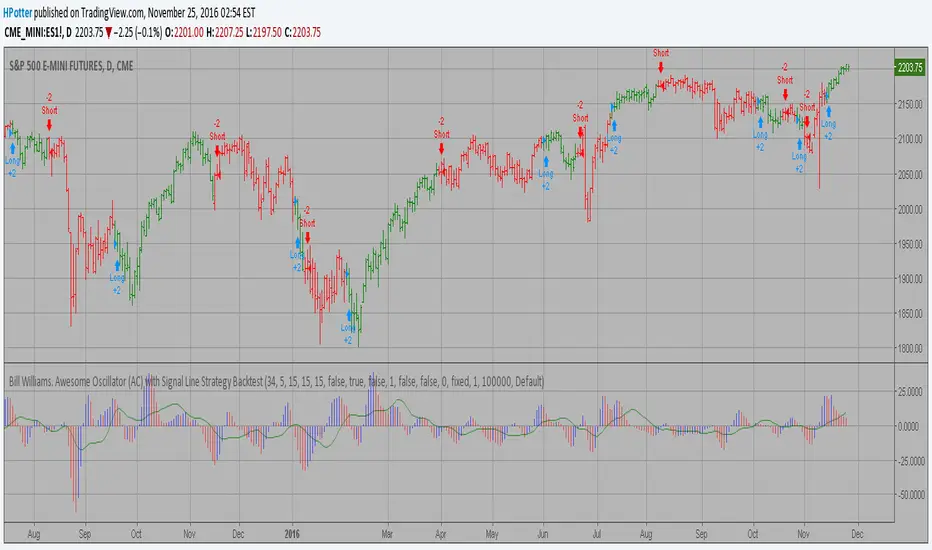
Bill Williams. Awesome Oscillator (AC) Strategy Backtest This indicator plots the oscillator as a histogram where blue denotes
periods suited for buying and red . for selling. If the current value
of AO (Awesome Oscillator) is above previous, the period is considered
suited for buying and the period is marked blue. If the AO value is not
above previous, the period is considered suited for selling and the
indicator marks it as red.
You can make changes in the property for set calculating strategy MA, EMA, WMA
Please, use it only for learning or paper trading. Do not for real trading.
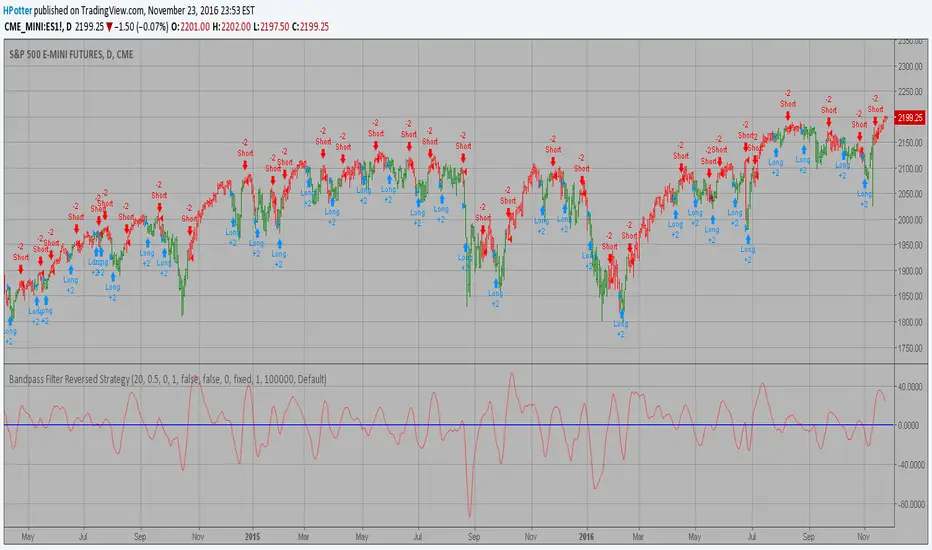
Bandpass Filter Reversed Strategy BacktestThe related article is copyrighted material from
Stocks & Commodities Mar 2010
You can use in the xPrice any series: Open, High, Low, Close, HL2, HLC3, OHLC4 and ect...
Please, use it only for learning or paper trading. Do not for real trading.
Average True Range Reversed Strategy Average True Range Trailing Stops Strategy, by Sylvain Vervoort
The related article is copyrighted material from Stocks & Commodities Jun 2009
Please, use it only for learning or paper trading. Do not for real trading.

3-Bar-Reversal-Pattern Strategy Backtest This startegy based on 3-day pattern reversal described in "Are Three-Bar
Patterns Reliable For Stocks" article by Thomas Bulkowski, presented in
January, 2000 issue of Stocks&Commodities magazine.
That pattern conforms to the following rules:
- It uses daily prices, not intraday or weekly prices;
- The middle day of the three-day pattern has the lowest low of the three days, with no ties allowed;
- The last day must have a close above the prior day's high, with no ties allowed;
- Each day must have a nonzero trading range.
Please, use it only for learning or paper trading. Do not for real trading.

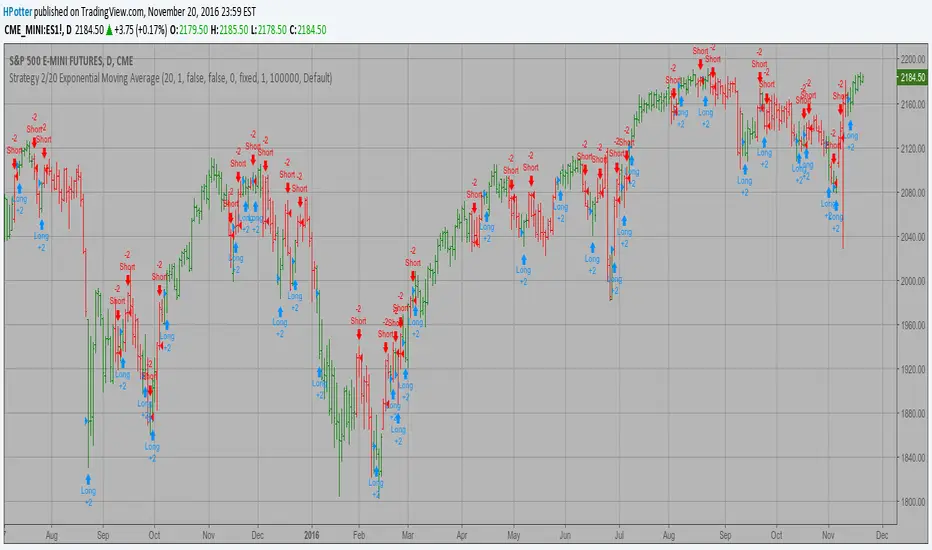
2/20 Exponential Moving Average StrategyThis indicator plots 2/20 exponential moving average. For the Mov
Avg X 2/20 Indicator, the EMA bar will be painted when the Alert criteria is met.
Please, use it only for learning or paper trading. Do not for real trading.
Moving Average Crossover 0001The first strategy for my (also first) Everyday project. During the rest of 2016 I plan to create a new strategy everyday
and I give myself between 15 minutes and 2 hours to complete the idea.
The goal is to improve my knowledge of Pine Script, become a faster strategy coder, and experiment with different strategic trading ideas.
I'm new to strategies and algorithmic trading, and hoping to learn from the community, so any feedback, advice or corrections is very much welcome!
/pbergden

Strategy with VWRSI and SAVE orders Long or Short or BothVWRSI is very powerful indicator coded by Algo Alpha and I Make Strategy of it
But there is no stop loss instate the Strategy is using Save orders to minimize the market manipulation
The best to used is side way market with long and short enable
The Strategy trigger long or short market order -
long - ta.crossover(rsi, 20)
short - ta.crossunder(rsi, 80)
And if is not take profit from the first trade start with the save trades until will do
the sum of the first order - base order and the save order can be adjust from the user
as well the deviation from the first order
IF some user have questions let me know

ONLY FOR EUR/USD : EMA9/EMA20 + RSI + MACD + Fibonacci (v6) FOR PAIRS WHICH HAS A MOMENTUM , trade only using manually not algo , use proper RR.
good luck

Volume Momentum Strategy [MA/VWAP Cross]Deconstructing the Volume Momentum Strategy: An Analysis of MA-VWAP Cross Mechanics
Introduction
The "Volume Momentum Strategy " is a technical trading algorithm programmed in Pine Script v6 for the TradingView platform. At its core, the strategy is a trend-following system that utilizes the interaction between a specific Moving Average (MA) and the Volume Weighted Average Price (VWAP) to generate trade signals. While the primary execution logic relies on price crossovers, the strategy incorporates a sophisticated secondary layer of analysis using the Commodity Channel Index (CCI) and Stochastic Oscillator. Uniquely, these secondary indicators are applied to volume data rather than price, serving as a gauge for market participation and momentum intensity.
The Core Engine: MA and VWAP Crossover
The primary engine driving the strategy's buy and sell decisions is the crossover relationship between a user-defined Moving Average and the VWAP.
1. The Anchor (VWAP): The strategy calculates the Volume Weighted Average Price based on the HLC3 (High, Low, Close divided by 3) source. VWAP serves as the dynamic benchmark for "fair value" throughout the trading session.
2. The Trigger (Moving Average): The script allows for flexibility in defining the "fast" line, offering options such as Simple (SMA), Exponential (EMA), or Hull Moving Averages.
3. The Signal:
o A Long (Buy) signal is generated when the chosen MA crosses over the VWAP. This suggests that short-term price momentum is exceeding the average volume-weighted price of the session, indicating bullish sentiment.
o A Short (Sell) signal is generated when the MA crosses under the VWAP, indicating bearish pressure where price is being pushed below the session's volume-weighted average.
The Role of CCI and Stochastic: Analyzing Volume Momentum
The prompt specifically inquires about how the CCI and Stochastic indicators fit into this process. In standard technical analysis, these oscillators are used to identify overbought or oversold price conditions. However, this strategy repurposes them to analyze Volume Momentum.
1. The Calculation
Instead of using close prices as the input source, the script passes volume data into both indicator functions:
• Volume CCI: Calculated as ta.cci(volume, cciLength). This measures the deviation of current volume from its statistical average.
• Volume Stochastic: Calculated as ta.stoch(volume, volume, volume, stochLength). This gauges the current volume relative to its recent range.
2. The "Volume Spike" Condition
The strategy combines these two indicators to define a specific market condition labeled isVolumeSpike. A volume spike is confirmed only when both conditions are met simultaneously:
• The Volume CCI must be greater than a defined threshold (default: 100).
• The Volume Stochastic must be greater than a defined threshold (default: 80).
3. Integration into the Process
It is critical to note how this script currently applies this "Volume Spike" logic:
• Visual Confirmation: In the current version of the code, the isVolumeSpike boolean is used strictly for visual feedback. When a spike is detected, the script paints the specific price bar yellow and plots a small triangle marker below the bar.
• Strategic Implication: While the code calculates these metrics, the variables long_condition and short_condition currently rely solely on the MA/VWAP crossover. The developer has left the volume logic as a visual overlay, noting in the comments that it serves as a "visual/alert" or a potential filter.
• Potential Alpha: Conceptually, this setup implies that a trader should look for the MA/VWAP crossover to occur coincidentally with—or shortly after—a "Volume Spike" (yellow bar). This would confirm that the price move is backed by significant institutional participation (volume) rather than just retail noise.
Risk Management and Time Constraints
The strategy wraps these technical signals in a robust risk management framework. It includes hard-coded time windows (start/stop trading times) and a "Close All" function to prevent holding positions overnight. Furthermore, it employs both percentage-based and dollar-based Stop Loss and Take Profit mechanisms, ensuring that every entry—whether generated by a high-momentum crossover or a standard trend move—has a predefined exit plan.
Conclusion
The "Volume Momentum Strategy" is a hybrid system. It executes trades based on the reliable trend signal of MA crossing VWAP but informs the trader with advanced volume analytics. By processing volume through the CCI and Stochastic calculations, it provides a "heads-up" display regarding the intensity of market participation, allowing the trader to distinguish between low-volume drifts and high-volume breakout moves.

Trendshift [CHE] StrategyTrendshift Strategy — First-Shift Structural Regime Trading
Profitfactor 2,603
Summary
Trendshift Strategy implements a structural regime-shift trading model built around the earliest confirmed change in directional structure. It identifies major swing highs and lows, validates breakouts through optional ATR-based conviction, and reacts only to the first confirmed shift in each direction. After a regime reversal, the strategy constructs a premium and discount band between the breakout candle and the previous opposite swing. This band is used as contextual bias and may optionally inform stop placement and position sizing.
The strategy focuses on clear, interpretable structural events rather than continuous signal generation. By limiting entries to the first valid shift, it reduces false recycles and allows the structural state to stabilize before a new trade occurs. All signals operate on closed-bar logic, and the strategy avoids higher-timeframe calls to stabilize execution behavior.
Motivation: Why this design?
Many structure-based systems repeatedly trigger as price fluctuates around prior highs and lows. This often leads to multiple flips during volatile or choppy conditions. Trendshift Strategy addresses this problem by restricting execution to the first confirmed structural event in each direction. ATR-based filters help differentiate genuine structural breaks from noise, while the contextual band ensures that the breakout is meaningful in relation to recent volatility.
The design aims to represent a minimalistic structural trading framework focused on regime turns rather than continuous trend signaling. This reduces chart noise and clarifies where the market transitions from one regime to another.
What’s different vs. standard approaches?
Baseline reference
Typical swing-based structure indicators report every break above or below recent swing points.
Architecture differences
First-shift-only regime logic that blocks repeated signals until direction reverses
ATR-filtered validation to avoid weak or momentum-less breaks
Premium and discount bands derived from breakout structure
Optional band-driven stop placement
Optional band-dependent position-sizing factor
Regime timeout system to neutralize structure after extended inactivity
Persistent-state architecture to prevent re-triggering
Practical effect
Only the earliest actionable structure change is traded
Fewer but higher-quality signals
Premium/discount tint assists contextual evaluation
Stops and sizing can be aligned with structural context rather than arbitrary volatility measures
Improved chart interpretability due to reduced marker frequency
How it works (technical)
The algorithm evaluates symmetric swing points using a fixed bar window. When a swing forms, its value and bar index are stored as persistent state. A structural shift occurs when price closes beyond the most recent major swing on the opposite side. If ATR filtering is enabled, the breakout must exceed a volatility-scaled distance to prevent micro-breaks from firing.
Once a valid shift is confirmed, the regime is updated to bullish or bearish. The script records the breakout level, the opposite swing, and derives a band between them. This band is checked for minimum size relative to ATR to avoid unrealistic contexts.
The first shift in a new direction generates both the strategy entry and a visual marker. Additional shifts in the same direction are suppressed until a reversal occurs. If a timeout is enabled, the regime resets after a specified number of bars without structural change, optionally clearing the band.
Stop placement, if enabled, uses either the opposite or same band edge depending on configuration. Position size is computed from account percentage and may optionally scale with the price-span-to-ATR relationship.
Parameter Guide
Market Structure
Swing length (default 5): Controls swing sensitivity. Lower values increase responsiveness.
Use ATR filter (default true): Requires breakouts to show momentum relative to ATR. Reduces false shifts.
ATR length (default 14): Volatility estimation for breakout and band validation.
Break ATR multiplier (default 1.0): Required breakout strength relative to ATR.
Premium/Discount Framework
Enable framework (default true): Activates premium/discount evaluation.
Persist band on timeout (default true): Keeps structural band after timeout.
Min band ATR mult (default 0.5): Rejects narrow bands.
Regime timeout bars (default 500): Neutralizes regime after inactivity.
Invert colors (default false): Color scheme toggle.
Visuals
Show zone tint (default true): Background shade in premium or discount region.
Show shift markers (default true): Display first-shift markers.
Execution and Risk
Risk per trade percent (default 1.0): Determines position size as account percentage.
Use band for size (default false): Scales size relative to band width behavior.
Flat on opposite shift (default true): Forces reversal behavior.
Use stop at band (default false): Stop anchored to band edges.
Stop band side: Chooses which band edge is used for stop generation.
Reading & Interpretation
A green background indicates discount conditions within the structural band; red indicates premium conditions. A green triangle below price marks the first bullish structural shift after a bearish regime. A red triangle above price marks the first bearish structural shift after a bullish regime.
When stops are active, the opposite band edge typically defines the protective level. Band width relative to ATR indicates how significant a structural change is: wider bands imply stronger volatility structure, while narrow bands may be suppressed by the minimum-size filter.
Practical Workflows & Combinations
Trend following: Use first-shift entries as initial regime confirmation. Add higher-timeframe trend filters for additional context.
Swing trading: Combine with simple liquidity or fair-value-gap concepts to refine entries.
Bias mapping: Use higher timeframes for structural regime and lower timeframes for execution within the premium/discount context.
Exit management: When using stops, consider ATR-scaling or multi-stage profit targets. When not using stops, reversals become the primary exit.
Behavior, Constraints & Performance
The strategy uses only confirmed swings and closed-bar logic, avoiding intrabar repaint. Pivot-based swings inherently appear after the pivot window completes, which is standard behavior. No higher-timeframe calls are used, preventing HTF-related repaint issues.
Persistent variables track regime and structural levels, minimizing recomputation. The maximum bars back setting is five-thousand. The design avoids loops and arrays, keeping performance stable.
Known limitations include limited signal density during consolidations, delayed swing confirmation, and sensitivity to extreme gaps that stretch band logic. ATR filtering mitigates some of these effects but does not eliminate them entirely.
Sensible Defaults & Quick Tuning
Fewer but stronger entries: Increase swing length or ATR breakout multiplier.
More responsive entries: Reduce swing length to capture earlier shifts.
More active band behavior: Lower the minimum band ATR threshold.
Stricter stop logic: Use the opposite band edge for stop placement.
Volatile markets: Increase ATR length slightly to stabilize behavior.
What this indicator is—and isn’t
Trendshift Strategy is a structural-regime trading engine that evaluates major directional shifts. It is not a complete trading system and does not include take-profit logic or prediction features. It does not attempt to forecast future price movement and should be used alongside broader market structure, volatility context, and disciplined risk management.
Disclaimer
The content provided, including all code and materials, is strictly for educational and informational purposes only. It is not intended as, and should not be interpreted as, financial advice, a recommendation to buy or sell any financial instrument, or an offer of any financial product or service. All strategies, tools, and examples discussed are provided for illustrative purposes to demonstrate coding techniques and the functionality of Pine Script within a trading context.
Any results from strategies or tools provided are hypothetical, and past performance is not indicative of future results. Trading and investing involve high risk, including the potential loss of principal, and may not be suitable for all individuals. Before making any trading decisions, please consult with a qualified financial professional to understand the risks involved.
By using this script, you acknowledge and agree that any trading decisions are made solely at your discretion and risk.
Do not use this indicator on Heikin-Ashi, Renko, Kagi, Point-and-Figure, or Range charts, as these chart types can produce unrealistic results for signal markers and alerts.
Best regards and happy trading
Chervolino

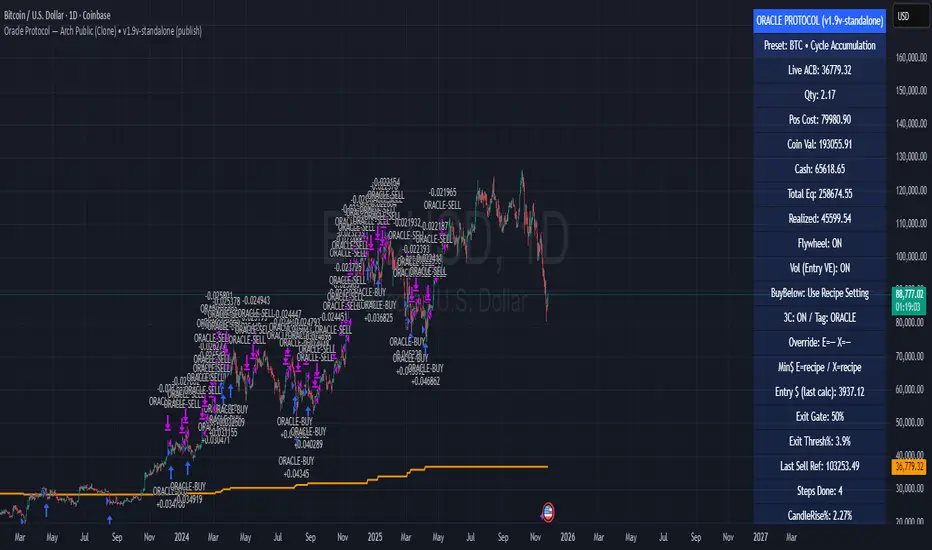
Oracle Protocol — Arch Public (Testing Clone) Oracle Protocol — Arch Public Series (testing clone)
This model implements the Arch Public Oracle structure: a systematic accumulation-and-distribution engine built around a dynamic Accumulation Cost Base (ACB), strict profit-gate exit logic, and a capital-bounded flywheel reinvestment system.
It is designed for transparent execution, deterministic behaviour, and rule-based position management.
Core Function Set
1. Accumulation Framework (ACB-Driven)
The accumulation engine evaluates market movement against defined entry conditions, including:
Percentage-based entry-drop triggers
Optional buy-below-ACB mode
Capital-gated entries tied to available ledger balance
Fixed-dollar and min-dollar entry rules (as seen in Arch public materials)
Automated sizing through flywheel capital
Range-bounded ledger for controlled backtesting input
Each qualifying buy updates the live ACB, maintains the internal ledger, and forms the next reference point for exit evaluation.
No forecasting mechanisms are included.
2. Profit-Gate Exit System
Exits are governed by the standard Arch public approach:
A sealed ACB reference for threshold evaluation
Optional live-ACB visibility
Profit-gate triggers defined per asset class
Candle-confirmation integration (“ProfitGate + Candle” mode)
Distribution only when the smallest active threshold is met
This provides a consistent cadence with published Arch diagrams and PDFs.
3. Once-Per-Rally Governance
After a distribution, the algorithm locks until price retraces below the most recent accumulation base.
Only after re-arming can the next profit gate activate.
This prevents over-frequency selling and aligns with the public-domain Oracle behaviour.
4. Quiet-Bars & Threshold Cluster Control
A volatility-stabilisation layer prevents multiple exits from micro-fluctuations or transient spikes.
This ensures clean execution during fast markets and high volatility.
5. Flywheel Reinvestment
Distribution proceeds automatically return to the capital pool where permitted, creating a closed system of:
Entry sizing
Exit proceeds
Ledger-managed capital state
All sizing respects capital boundaries and does not breach dollar floors or overrides.
6. Automation Hooks and Integration
The script exposes:
3Commas-compatible JSON sizing
Entry/exit signalling via alertcondition()
Deterministic event reporting suitable for external automation
This allows consistent deployment across automated execution environments.
7. Visual Tooling
Optional displays include:
Live ACB line
Exit-guide markers
Capital, state, and ledger panels
Realized/unrealized outcome tracking based on internal logic only
Visual components do not influence execution rules.
Operating Notes
This model is rule-based, deterministic, and non-predictive.
It executes only according to the explicit thresholds, capital limits, and state transitions defined within the script.
No discretionary or forward-looking logic is included.