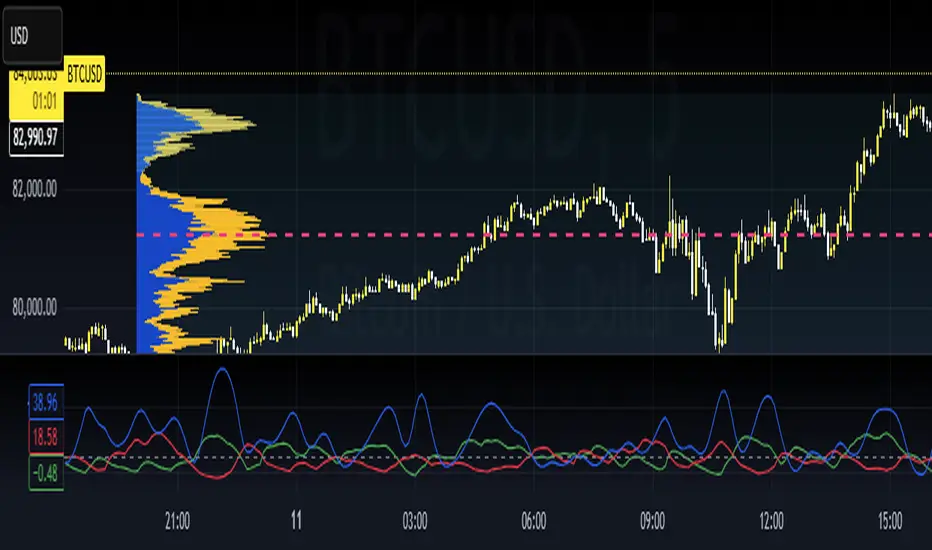
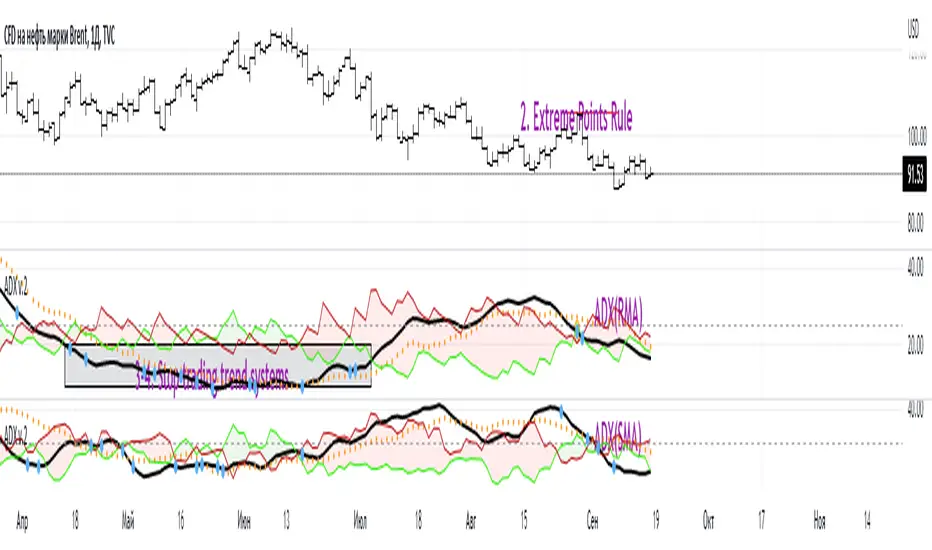
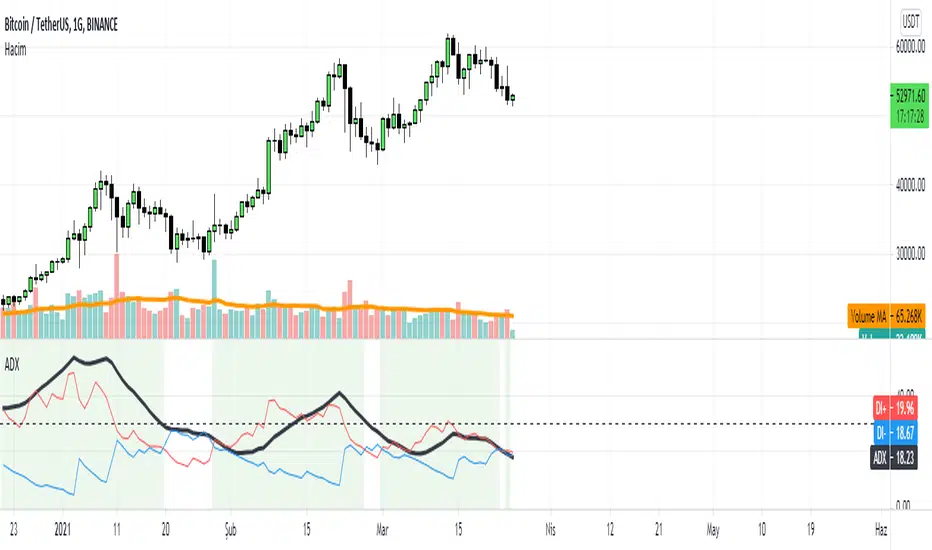
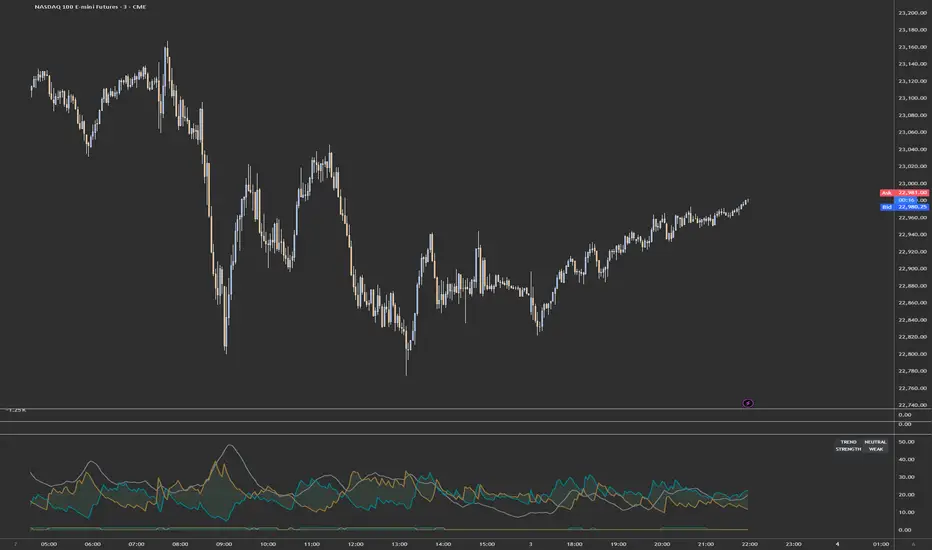
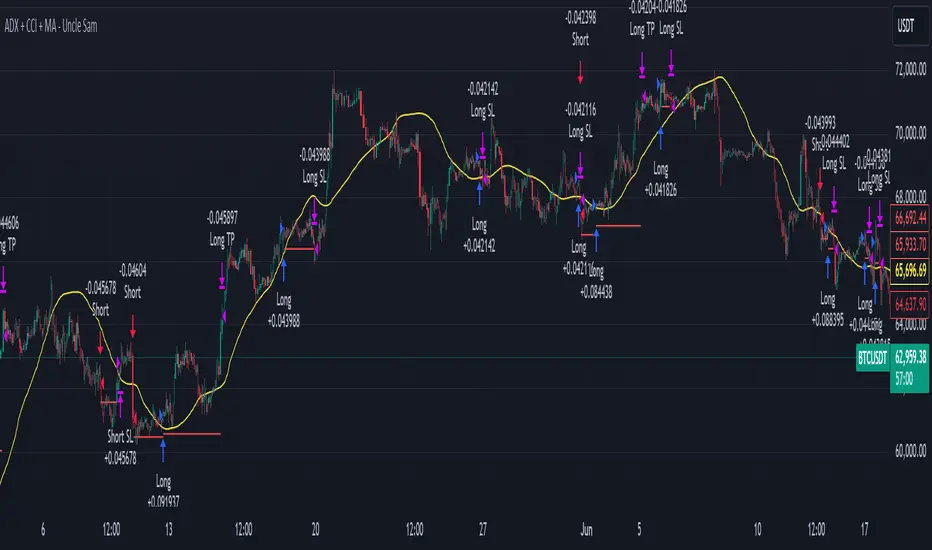
ADX GapperBased on the ADX Gapper strategy described in the book Street Smarts, it looks to exploit retracement to a prevailing trend when there has been a gap away from the trend, giving you multiple potential entries. It uses the ADX to determine a trend and detects when there is a gap to signal an entry day where:
You would enter short if the DI-(red line) > DI+ (green line), ADX (blue area) > 30 indicating a strong trend and if there is a gap up from the previous day. If all the described conditions are met then you would place a short stop at the previous day highs and trail a stop until the end of the day. This strategy is meant to give you trades to hold for 1 day (the day you enter) or 2 days if you consider you should hold it overnight.
Komut dosyalarını "adx" için ara
ADX & DI HistogramThis bad boy shows the same info as a normal ADX & DI but I've endeavoured to remove a lot of the confusion. I also added red/green colour gradients to show how much ADX is trending, the darker the colour, the stronger the trend. This should help to avoid the upsidedowniness and confusion I've always found with the original. I made this a while ago and have made a few changes recently but I can't remember where I go the basic ADX code from, so credit to whoever that was. Enjoy
ADX btw 15-30 and increasingWhen the ADX is between 15-30, it suggests that there’s a trend present but that it isn’t in full-blown momentum mode yet. This gives you the opportunity to enter before the trend becomes extremely strong, allowing for earlier entries in a fresh trend.
An increasing slope of the ADX confirms that the trend is developing into a stronger phase, which provides additional confidence that the trade is likely to continue in the same direction.
This indicator highlights when both of these conditions are met.
ADX w 15 and 30 LinesThis takes the normal ADX with a 15 lookback period and adds horizontal lines at 15 and 30 no matter which ticker you are on. This saves you from having to add the lines to every single instrument.
When the ADX is between 15-30, it suggests that there’s a trend present but that it isn’t in full-blown momentum mode yet. This gives you the opportunity to enter before the trend becomes extremely strong, allowing for earlier entries in a fresh trend.
ADX and DI+ v4.5 OptimizedThis script plots VWMA(ADX) vs EMA(DI+) under pre-set time frame.
Feature:
The Main Strategy is to look for potential BUY opportunity (Intraday trading, Session trading, Swing) when EMA(DI+) colored blue, entering upward into Green zone where ADX counterpart (default colored: Yellow) is also present.
Formula plot is also helpful to understand upcoming downtrend signal when both blue and yellow lines try to make diverted bifurcation like pattern on graph.
Disclaimer - This is an indicator script and not final Buy and Sell advice.
* Originally developed by © BeikabuOyaji and further extended & optimized by Bharat @imbharat to serve above features
ADX SignalsThis script uses the Average Direction Index, On Balance Volume, and Exponential Moving Average, Moving Average Cross, MACD, Donchian Channels and two Parabolic SARs for stop loss, a normal one and a line one.
I tried to make the script as straightforward as possible, Buy when there is a buy signal and sell when there is a sell signal. I like using it on the smaller time-frames because I'm a scalper and I like going in and out quickly, but this indicator can be used on any timeframe and works on any instrument. The buy signal is triggered when the DI+ goes above the 30 level, the ADX is not increasing, on balance volume is at it's lowest, the price is above the lower Donchian Channel and last MACD hist bar is lower than the previous one. The sell signal is triggered when the DI- goes above the 30 level, the ADX is not increasing, on balance volume is at it's highest, the price is below the upper Donchian Channel and last MACD hist bar is upper than the previous one.
If you have any suggestions feel free to leave them in the comments below or Message me directly.
ADX and DI with SMAThe objective of this indicator is to provide a tool to asses if the price is trending ( ADX above SMA ) or range bound ( ADX below SMA ), to decide the type of strategy to apply.
Should be used at a larger time frame than the intended operation time frame.
Moving Average ADXADX Smoothing Trend Color Change on Moving Average and ADX Cross. Use on Hourly Charts - Green UpTrend - Red DownTrend - Black Choppy No Trend
Directional Movement Index + ADX & Keylevel SupportADX and DMI oscillator with the keylevel coded in to the script, set for 23, suggested settings is 23 - 25 any trade with the ADX above the keylevel is a strong indicator that it is trending.
adx efi 50 ema channel, trend pullbackHi so this strategy is based off 50 ema channel and the 15 ma crossing it to generate signals. But with my adjusted strategy it's a 10 rma crossing 50 ema channels and a 5 and 9 wma to help see pullbacks. 50 period bollinger bands to gage volatility a0nd help during range markets. The strategy signals are generated when longer period efi is above 0 and shorter period efi is below zero and price has pulled back near 50 ema to buy long. And the reverse for shorts, I made this to help me trade more mechanically and to trade 1 minute time frame, that's where the strategy seems to Excell the most, I developed it on eur usd but a brief check seems like it still is profitable on gbp usd aud usd usd jpy I only trade the forex market so not sure about stocks and crypto. If you get signals I would place buy stops and sell stops above high and low of respective signal candle and let price take you into trade. Also adx 20 has to be greater than 20 to take trades. Let me know if this is helpful. I've only been coding for a month so it might look sloppy the way it's coded also there are a few other buy and sell conditions left in the source code if you want to switch between different buy and sell triggers, they all produce good results on 1 min timeframe
ADX + RSI Strat// This is a strategy that uses the 7 Period RSI to buy when the indicator is shown as oversold (OS) and sells when
// the index marks overbought (OB). It also uses the ADX to determine whether the trend is ranging or trending
// and filters out the trending trades. Seems to work better for automated trading when the logic is inversed (buying OB
// and selling the OS) wihout stop loss.
ADX+DMI_by_BIMashed together Chris Moody's ADX thing with his DMI thing.
So you can see trend strength + direction
green-ish = uptrend-ish//red-ish = downtrend-ish
Colors can be adjusted though.
below 10 = gray, not much going on
10 - 20 = light green/light red, could be the beginning o something
20 - 40 = bright green / bright red, something is going on
above 40 = dark green, dark red, exhaustion (default is 40, can be adjusted to whatever)
ADX Cross Indicator-dayCoderBased off of the “ADX” indicator, which indicates the strength of the current trend.
ADX & Strength Line 23That line show me if the trend have strength.-
Aveaverage directional index plus 23 Strength Line.
ADX-DI MTF trend indication - JD version 2Version 2 added support for MTF, to see the trend direction on the lower or higher timeframe.
As an example to see the difference, the indicator is added three times, one time for the current TF, one set at the higher and one at the lower TF.
Cudo's to Chris Moody for the MTF-switching-code!!
JD.