OPEN-SOURCE SCRIPT
ADX with Signals
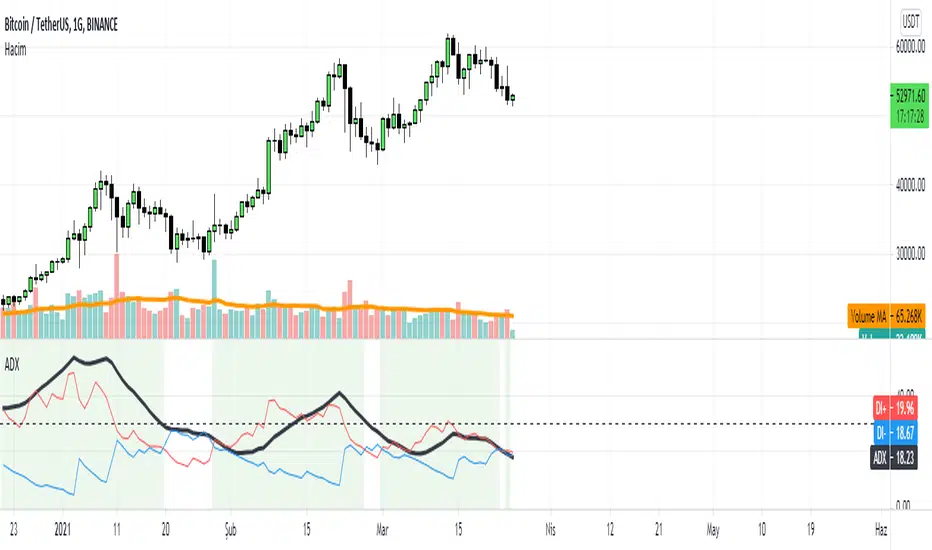
This indicator basicly usind ADX ( Average Directional Index )
ADX can show us how trend is strong
ADX below 20: the market is currently not trending
ADX crosses above 20: signifies that a new trend is emerging. Traders may start placing sell or buy orders in the direction of the price movement.
ADX between 20 and 40: When the ADX is growing between 20 and 40 it is considered as a confirmation of an emerging trend. Traders should use this opportunity to buy or short sell in the trend's direction.
ADX above 40: the trend is very strong.
ADX crosses 50: the trend is extremely strong.
ADX crosses 70: a very rare occasion, which is called a “Power Trend.”
If we use ADX with DI+ and DI+ indactor can tell us to buy.
How can we calculate this all?
Directional Movement (DI) is defined as the largest part of the current period’s price range that lies outside the previous period’s price range. For each period calculate:
+DI = positive or plus DI = High - Previous High
-DI = negative or minus DI = Previous Low - Low
The smaller of the two values is reset to zero, i.e., if +DI > -DI , then -DI = 0. On an inside bar (a lower high and higher low), both +DI and -DI are negative values, so both get reset to zero as there was no directional movement for that period.
The True Range ( TR ) is calculated for each period, where:
TR = Max of ( High - Low ), ( High -PreviousClose ), ( PreviousClose - Low )
The +DI , -DI and TR are each accumulated and smoothed using a custom smoothing method proposed by Wilder. For an n period smoothing, 1/n of each period’s value is added to the total each period, similar to an exponential smoothing:
+DIt = (+DIt-1 - (+DIt-1 / n)) + (+DIt)
-DIt = (-DIt-1 - (-DIt-1 / n)) + (-DIt)
TRt = (TRt-1 - (TRt-1 / n)) + ( TRt )
Compute the positive/negative Directional Indexes, +DI and -DI , as a percentage of the True Range:
+DI = ( +DI / TR ) * 100
-DI = ( -DI / TR ) * 100
Compute the Directional Difference as the absolute value of the differences: DIdiff = | (( +DI ) - ( -DI )) |
Sum the directional indicator values: DIsum = (( +DI ) + ( -DI )) .
Calculate the Directional Movement index: DX = ( DIdiff / DIsum ) * 100 . The DX is always between 0 and 100.
Finally, apply Wilder’s smoothing technique to produce the final ADX value:
ADXt = ( ( ADXt-1 * ( n - 1) ) + DXt ) / n
When indicator tell us to buy?
If when DI+ crosses DI- and ADX is bigger than DI- indicator tell us to buy.
Açık kaynak kodlu komut dosyası
Gerçek TradingView ruhuna uygun olarak, bu komut dosyasının oluşturucusu bunu açık kaynaklı hale getirmiştir, böylece yatırımcılar betiğin işlevselliğini inceleyip doğrulayabilir. Yazara saygı! Ücretsiz olarak kullanabilirsiniz, ancak kodu yeniden yayınlamanın Site Kurallarımıza tabi olduğunu unutmayın.
Feragatname
Bilgiler ve yayınlar, TradingView tarafından sağlanan veya onaylanan finansal, yatırım, işlem veya diğer türden tavsiye veya tavsiyeler anlamına gelmez ve teşkil etmez. Kullanım Şartları'nda daha fazlasını okuyun.