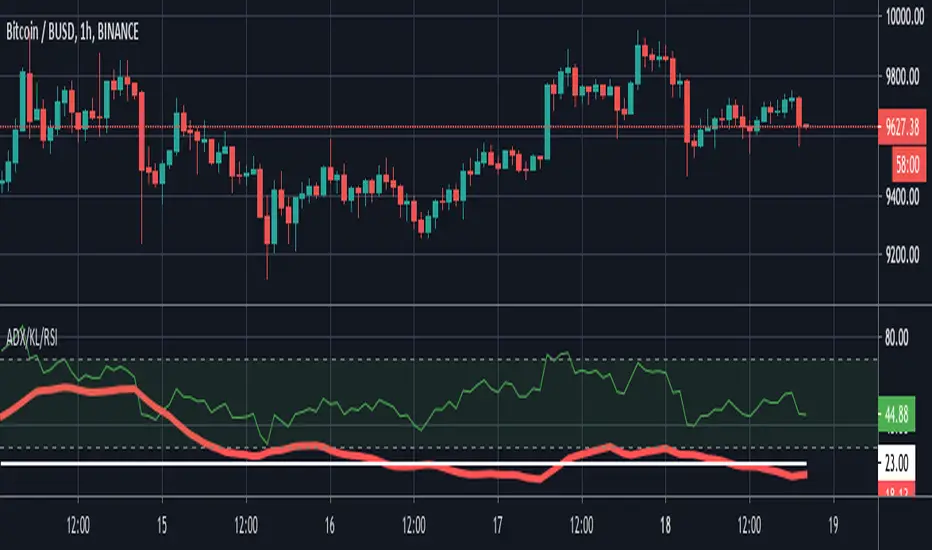
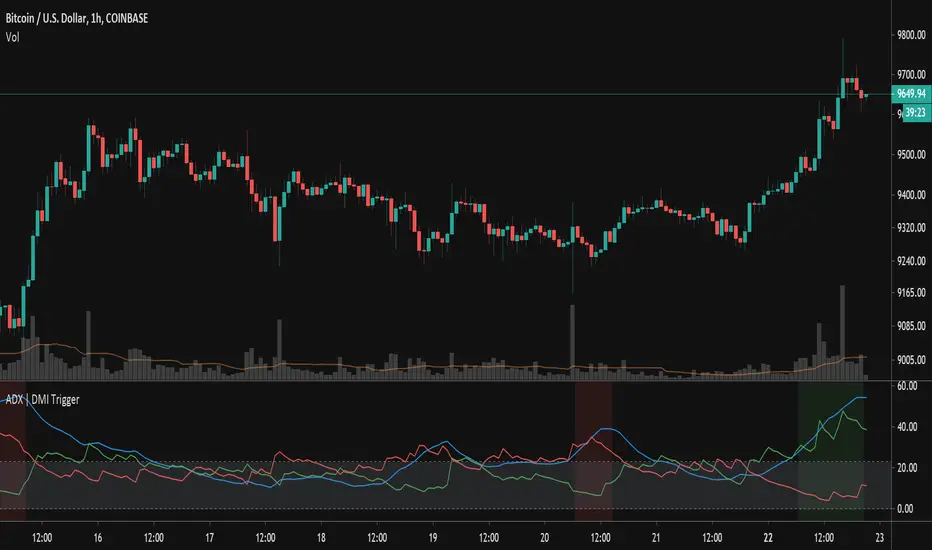
ADX-DI Multi-TimeframePlots the multiple time frame version of the classic ADX-DI indicoator.
ADX
DI+ and DI-
ADX Threshold
DI Histogram difference with 2 threshold lookback values
For a similar multiple time frame indicator see the following scripts. They both use the historical + projection approach to yield non-repainting indicators.
Fisher Transform Multi-Timeframe
Laguerre RSI Multi-Timeframe
"adx" için komut dosyalarını ara

ADX +- DiThis Adx +-Di is just a complete version of what the ADX is supposed to signal.
So you have:
15 (contraction), 20 (threshold), 30 (expansion), 40 (resistance) levels.
Below 20 the price is not trending
Above 30 the price is trending
Below 15 price has been in contraction for too long
Between 20 and 30 price is in a "transition zone".
I finally added a "Resistance" level (40), which has to be adapted to best represent the historical levels where price usually encounters resistance, and where the price can be declared "overtrending", which means a return to lower levels is likely to happen.
I've chosen mild colors, and set the Adx Color to White, because I use black background, you can easily change that.
Enjoy
-Maurice

ADX & DI with Long + Short ConditionsMy version of the ADX & DI Indicator with an extra theshold and adjustable long and short conditions.
A green background (long) will appear when the ADX is rising, the DI+ is falling and the DI+ is below the (new) lower threshold.
A red background (short) will appear when the ADX is rising, the DI- is falling and the DI- is below the (new) lower treshold.
You can adjust the tolerance for the lower threshold in the settings of the indicator.
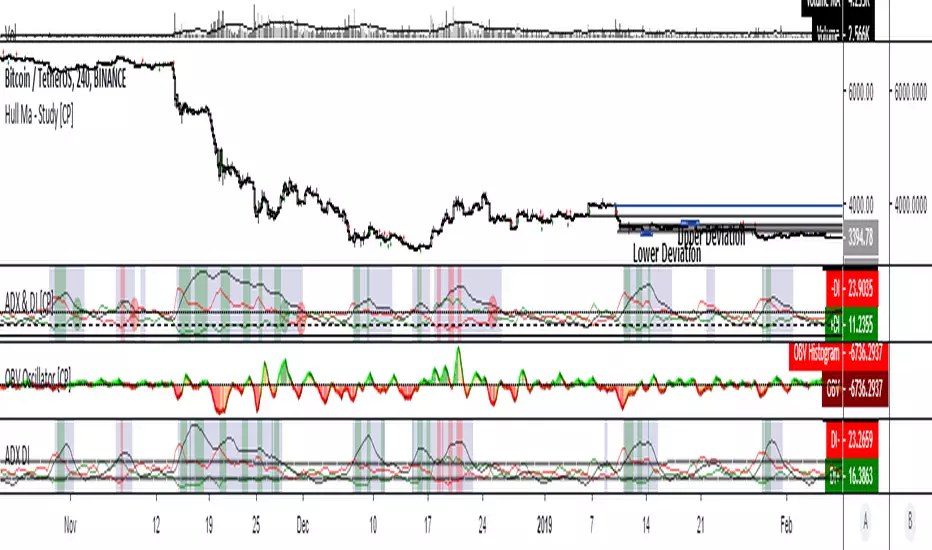
ADX-DI trend indication - JDThis indicator is based on the formulas in the original "ADX and DI" script of Masa Nakamuro
The indicator gives a multiplication of ADX and the DI+ and DI-values, color coded for bullish or bearish momentum.
The indicator was optimised for use with HA-candles, but works with regular candles as well and shows general market direction en divergence in a simpler visual way than the normal ADX-DI lines.
A threshold mask and the actual DI-lines kan be shown or omitted as preferred
JD.

ADX-DI trend indication - JDThis indicator is based on the formulas in the original "ADX and DI" script of Masa Nakamuro
The indicator gives a multiplication of ADX and the DI+ and DI- values, color coded for bullish or bearish momentum.
The indicator was optimised for use with HA-candles, but works with regular candles as well and shows general market direction en divergence in a simpler visual way than the normal ADX-DI lines.
A threshold mask and the actual DI-lines kan be shown or omitted as preferred
JD.

ADX and DI (Average Directional Index) - CORRECT FORMULASo... the popular version of "ADX and DI" shown on tradingview by masanakamura uses some wacky and incorrect formula for DI and uses SMA instead of the Wilder's MA that ADX/DI is supposed to use, and doesn't give the correct ADX and DI values. The Tradingview "Average Directional Index" uses the correct calculation but doesn't show DI+ and DI-. So, here it is with the DI+ and DI- visible. Enjoy!

ADX CornerShows the current ADX value along with the average ADX over the last N candles in a small table on the chart.
It’s meant as a quick reference to see whether the market is generally trending or stuck in chop, without needing a separate indicator pane.

ADX-DI - Made EasyThis indicator is a visually improved version of ADX. It makes it much easier to see what's happening by simplifying those confusing, intersecting lines. With this, you can detect the ADX direction more clearly. All the features are also explained in the tooltips of the input fields. Some extra features are included, such as average top and bottom calculation and divergences.
Please note that the divergences on ADX are just experimental and are based on calculations, so there is no guarantee the direction will change.

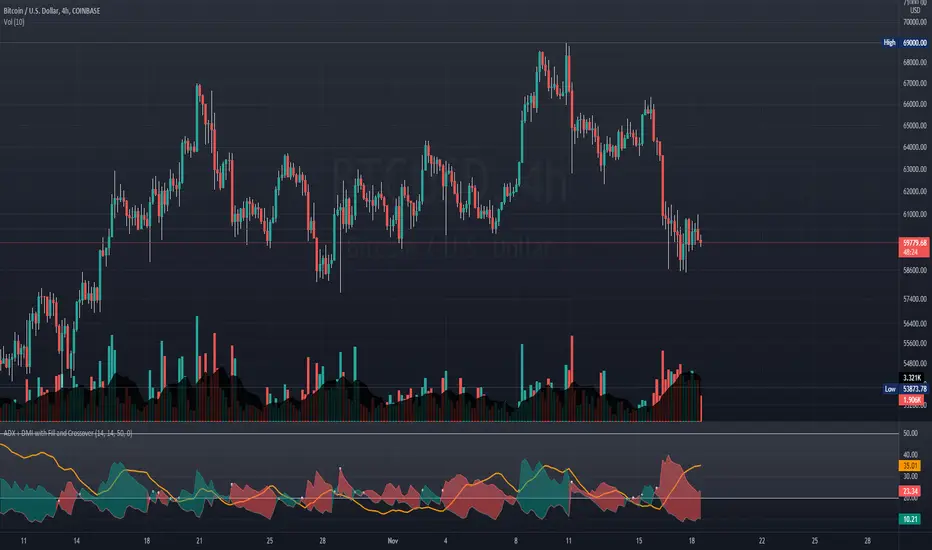
ADX + DMI with Fill and CrossoverBetter visuals for the ADX/DMI technical indicator.
I filled the DI+ and DI- with color to easily track the trend. Also, I added shapes (+) / (x) once the DI+ and DI- crossover each other.
You can also set two horizontal lines so you can easily track where the ADX value is at.
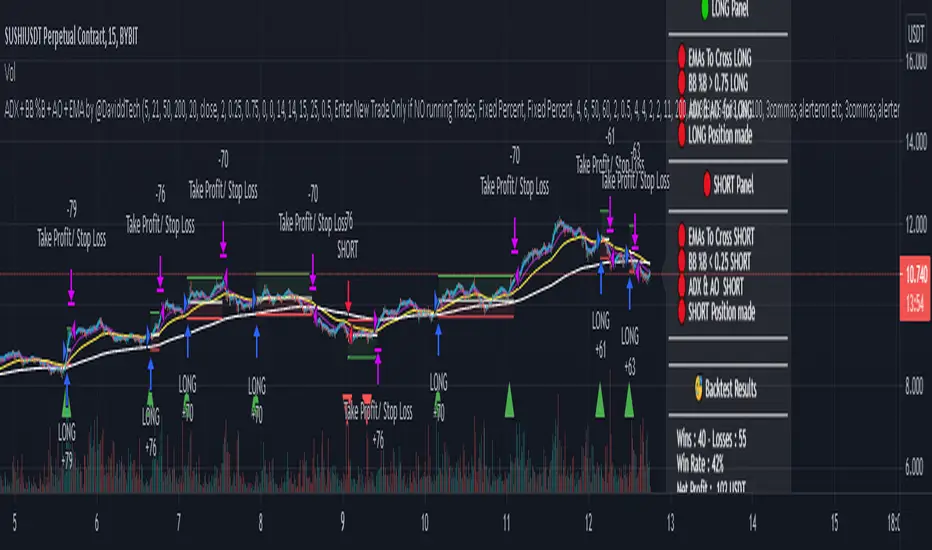
ADX + BB %B + AO + EMA by @DaviddTechThis trading strategy combines different indicators:
1) ADX , Average Directional Movement to make sure we are in a trend.
2) BB %B Bollinger Band %B: to spots relative price position to Bollinger Bands
3) AO Awesome Oscillator for momentum - you will need to configure this to fit the pair.
4) EMA 5, EMA 21, EMA 50, EMA 200: crossovers to get our entry short or long & trend direction
This script was inspired by TraderPro - Crazy 78% Win Rate Proven Trading Strategy Revealed - ADX + BB %B + AO + EMA
My settings are pretty much as default.
- I have added a 10,000 USD default
- 7% of portfolio is used to create the results.
You can of course optimize all of this in the settings.
WARNING:
- For purpose educate only
- Plots EMAs and other values on chart.
- This script to change bars colors.
ADX and DI Advance [SystemAlpha]Our version of ADX DMI indicator with option to show ADX as histogram or line.

ADX TriggerThis script fires off a buy alert when the ADX is rising and above a user-defined value (default 25). It fires off a sell signal when ADX starts sloping downward. The lookback period to determine if it is sloping up/down (in bars) is also configurable by the user. The plot highlights green when there is a "go" signal. Thanks to @9e52f12edd034d28bdd5544e7ff92e for the idea.
ADX Free-The line control represents, if the ADX is greater than the line of 20, the price trend is considered strong, some people increase it to 25
-Dynamic adx color to better differentiate movements

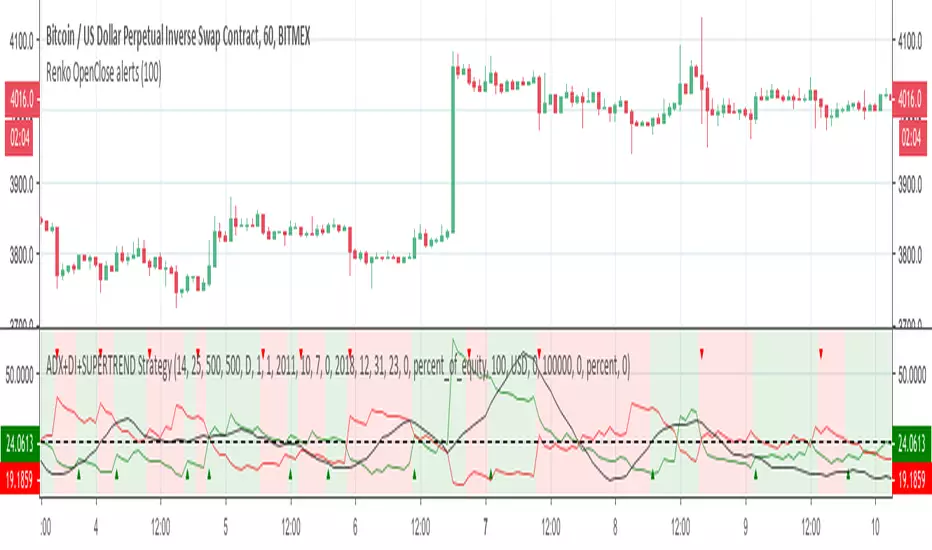
ADX+DI+SUPERTREND StrategyThis strategy is a port of famous script from MasaNakamura ADX and DI.
Here is the exact startegy from original study from MasaNakamura MasaNakamura at
In this version, I added also SUPERTREND as filter!
Scope of this port is to identify corrects inputs to get best results from signals that indicator gives.
I added the possibility to choose stop loss and take profits and to smooth the results also with heikin ashi candles.
Please use comment section for any feedback.
Next improvement (only to whom is interested to this script and follows me): study with alerts on multiple tickers all at one. Leave a comment if you want to have access to study.
********************************** IMPORTANT*******************************
I have developed an expert advisor for metatrader4 (MT4) and for jforex platform: results of expert advisor form 2015-01-01 to 2018-11-25 are very good with low drawdown and good profit.
********************************************************************************
ADX and DI StrategyThis strategy is a port of famous script from MasaNakamura ADX and DI
Original study from MasaNakamura MasaNakamura at
Scope of this port is to identify corrects inputs to get best results from signals that indicator gives.
I added the possibility to choose stop loss and take profits and to smooth the results also with heikin ashi candles.
Please use comment section for any feedback.
Next improvement (only to whom is interested to this script and follows me): study with alerts on multiple tickers all at one. Leave a comment if you want to have access to study.
********************************** IMPORTANT*******************************
I have developed an expert advisor for metatrader4 (MT4) and for jforex platform: results of expert advisor form 2015-01-01 to 2018-11-25 are very good with low drawdown and good profit.
********************************************************************************

ADX Overlap with MACD FilterIt’s a method/study to find trending stocks and cryptocurrencies using two different periods (14, 5) ADX Overlap with a MACD Filter. The MACD filter may or may not be used.
Green shadow implies Trending Uptrend
Red shadow implies Trending Downward
I am a disabled man. Therefore, I am not able to write in detail here today. More Details will follow as time permits. Please let me know if I am missing anything…
Legal Disclaimer: I am not bribed to write here and I am not seeking insider favors. I wrote here so I get replies from fellow viewers to educate myself and for my daily expenses. Hence, if anyone uses this post for making their decisions, I am not responsible for any failures incurred.
Safe Trading!
Kal Gandikota
PS: If you found this script interesting and edifying please follow and upvote.
PS2: Please kindly donate for my daily expenses (atleast as you would on streets) at the following addresses:
'BTC Wallet' - 1NeDC1GvpFa49DFLuT1v28ohFjqtoWXNQ5
ETH Wallet - 0x0450DCB7d4084c6cc6967584263cF6fBebA761D1
'BTS Wallet' - chip-maker
QTUM Wallet - QhqqV3WQV236Tz5ZbPceXXvU8aK2N4i78A
NEO Wallet - AUdiNJDW7boeUyYYNhX86p2T8eWwuELSGr
PS3: To open a cryptocurrency trading account at the brokerage where I trade most for now, please kindly use the following website(with referral code attached):
www.binance.com
PS4: For more information on ADX and MACD, please 'Google' or search here yourself.
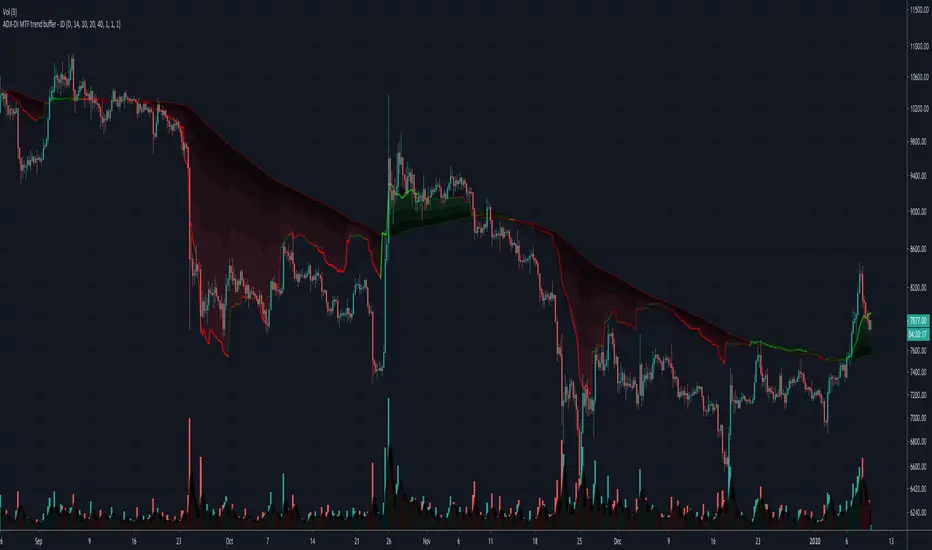
ADX-DI MTF trend buffer - JDThe indicator gives a multiplication of ADX and the DI+ and DI-values, color coded for bullish or bearish momentum
the indicator was optimised for use with HA-candles, but works with regular candles as well
and shows general market direction en divergence in a simpler visual way than the normal ADX-DI lines
a threshold mask can be shown or omitted as preferred
version 3. the indicator is now plotted relative to the 200 ema and can be seen as a "buffer" against price reversal
The timeframe of the indicator can be the current one or custom selected but gives better visual information if a longer timeframe than the current one is used.
The colors can be changed to fit with "Dark mode" or "Light mode"
a scaling option is available to downscale the trend indication relative to the price bars
JD
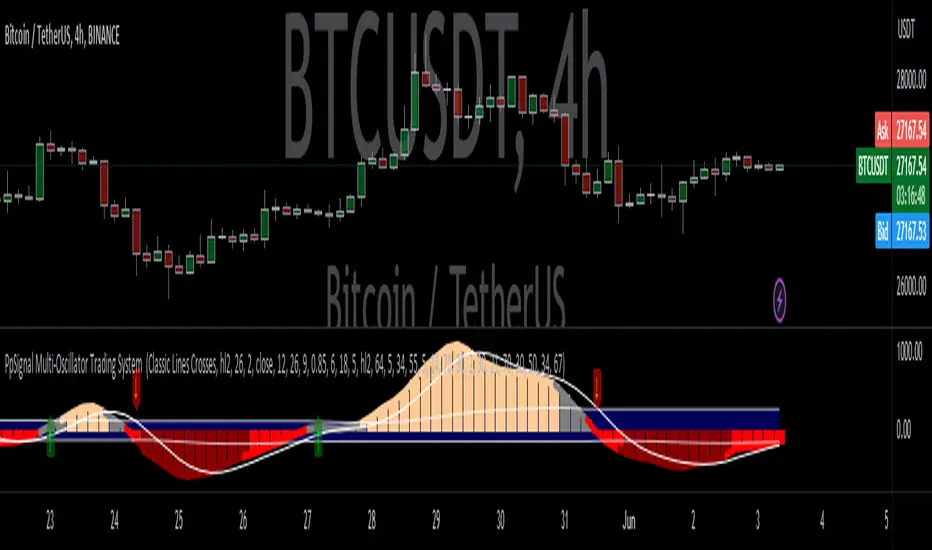
Ppsignal ADXAdx con color de fondo.
Adx indicator with background color.
Bullish trend background lime and line yellow. Bearish trend background red lines red.
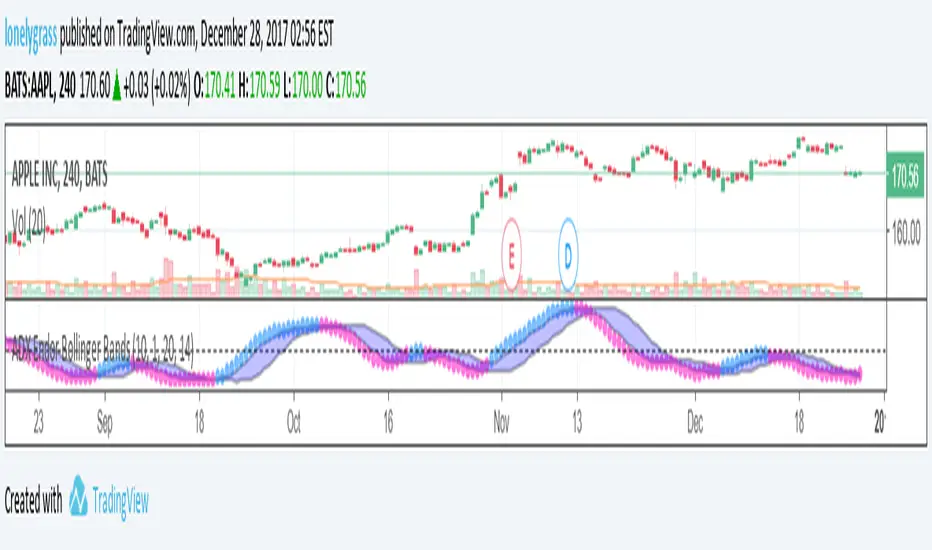
ADX Endor Bollinger BandsThis is a modified version of ADX , and it has a bollinger bands endorsed. An advantage of the indicator is allowing users to capture short term rise or drop of trend strength, particularly useful for scalping.
There are three modes open to users: ADX, DIPlus and DIMinus. Users can simply choose the indicators in their favor. A breach of the upper bollinger band will be in blue, breaching lower band or inside-the-bands signals are painted in pink.
Hope you will enjoy it. Make sure to follow my trading journal and give a thumb up to this post.
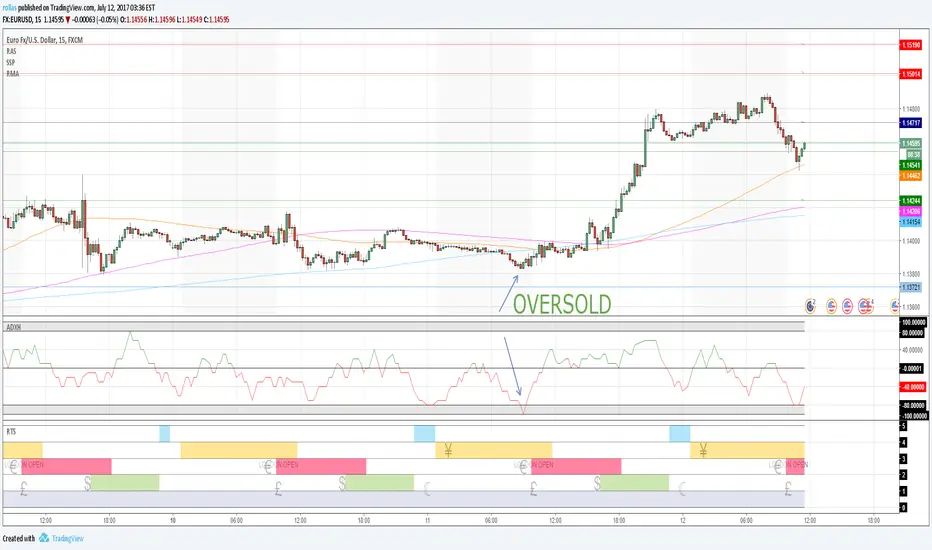
HYPER ADXADX typically shows the strength of a trend. Hyper ADX is specially coded for showing intraday overbought and oversold conditions.
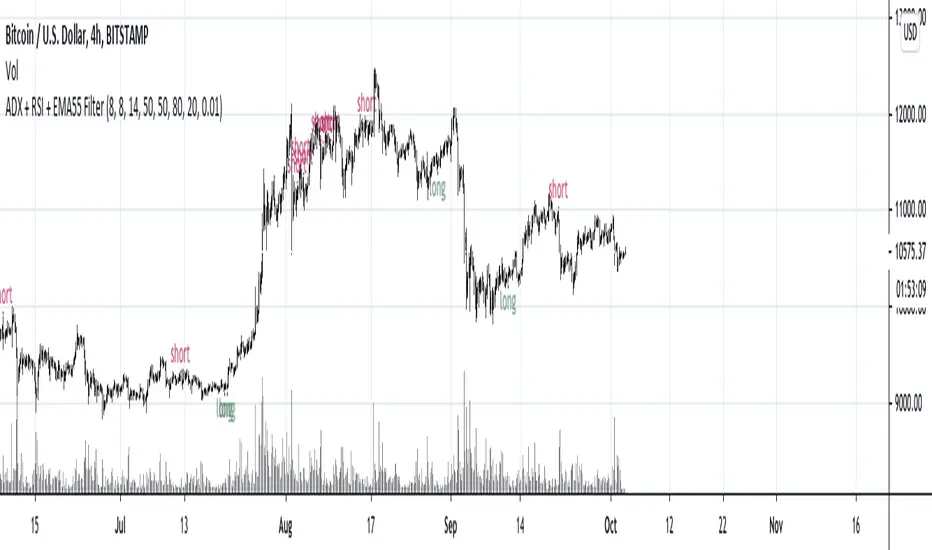
ADX + RSI + EMA55 FilterThis is a kind of trend indicators.
Signal to buy/sell comes when adx surpasses +5/-5 and RSI comes to buy/sell area.
Filtering with distance from ema55 (far above or far below position blocks entries) and with RSI overbought/oversold areas.
Needs to be adjusted for specific timeframes.
Default settings for 4H.
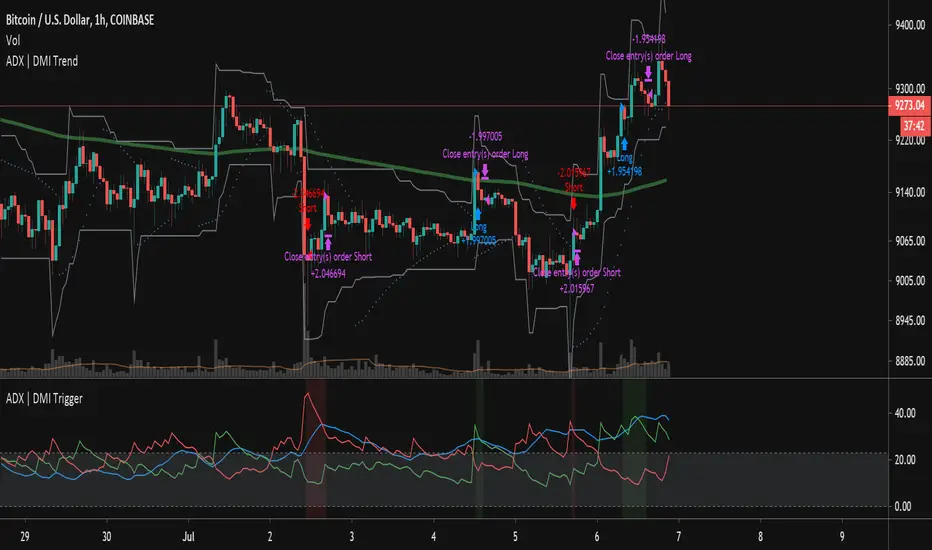
ADX | DMI Trend StrategyThis strategy takes the ADX Indicator I wrote and applies it to a strategy for back testing purposes.
I've also applied a date filter so you can back test specific date ranges and a moving average filter so you can choose whether to filter your longs/shorts based on a moving average.
ADX + Keylevel + RSIThis script is a combination of the Average Directional Movement Index (ADX) help to determine the trend strength with a key level and Relative Strength Index is an oscillator that measures the speed and change of price movements.