Smartos VWAPSmartos VWAP Indicator Description
Smartos VWAP is a versatile and customizable technical analysis tool designed for traders and analysts to gauge the average price of a security based on its trading volume. The indicator calculates the Volume Weighted Average Price (VWAP) over six different customizable periods, allowing users to adapt the analysis to their trading strategies.
Key Features:
Volume Weighted Average Price (VWAP): The Smartos VWAP provides a dynamic measure of the average price at which a security has traded throughout the day, weighted by volume. This makes it a useful reference point for assessing price levels.
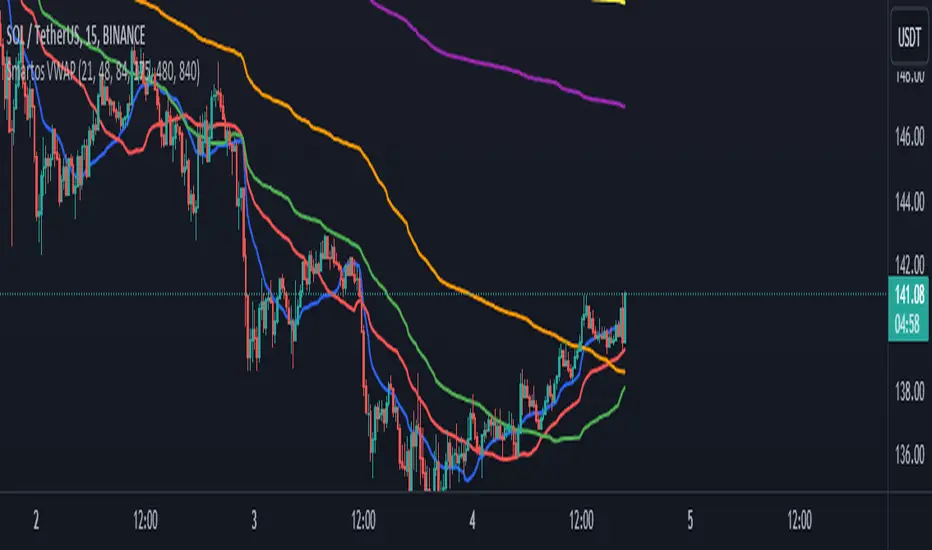
Customizable Periods: The indicator allows users to set six different candle lengths for VWAP calculations, with default values of 21, 48, 84, 175, 480, and 840 candles. Users can easily modify these values to suit their trading preferences.
Multiple VWAP Lines: The indicator plots six distinct VWAP lines on the chart, each representing a different period. This enables traders to observe price action relative to multiple VWAPs, helping identify trends and potential support and resistance levels.
Visual Clarity: Each VWAP line is color-coded for easy differentiation, making it simple for traders to analyze price movements and the relationship between the current price and the average price over the selected periods.
Usage:
Traders can use the Smartos VWAP indicator to make informed decisions regarding entry and exit points, as well as to assess overall market sentiment. By observing the position of the price relative to the VWAP lines, traders can gain insights into potential bullish or bearish trends.
Pine Script® göstergesi