RSI/MFI with Volatility Bands [LazyBear] with names I just add the names of the plots to configure the alerts by knowing the names .
"LazyBear" için komut dosyalarını ara

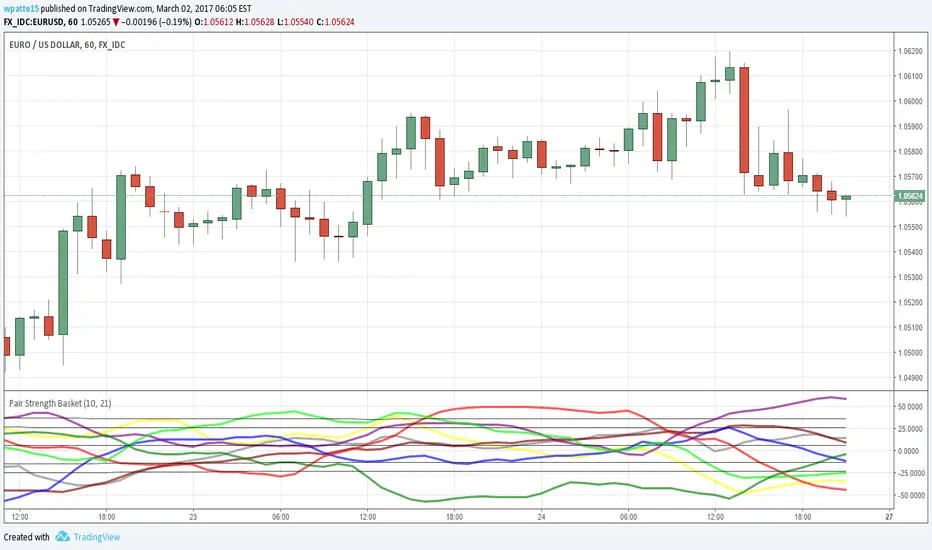
Pair Strength BasketAgain thanks to LazyBear for bringing over the wavetrend indicator and glaz for the idea of the basket of currencies. This is a power index based on the wavetrend indicator, I cut it down to 5 securities per currency since the limit of securities I could call was 40. I like to use to see which pair is the most OB/OS as it likely presents the best profit potential.
AUD = Yellow
CAD = Gray
CHF = Maroon
EUR = Blue
GBP = Red
JPY = Purple
NZD = Lime
USD = Green
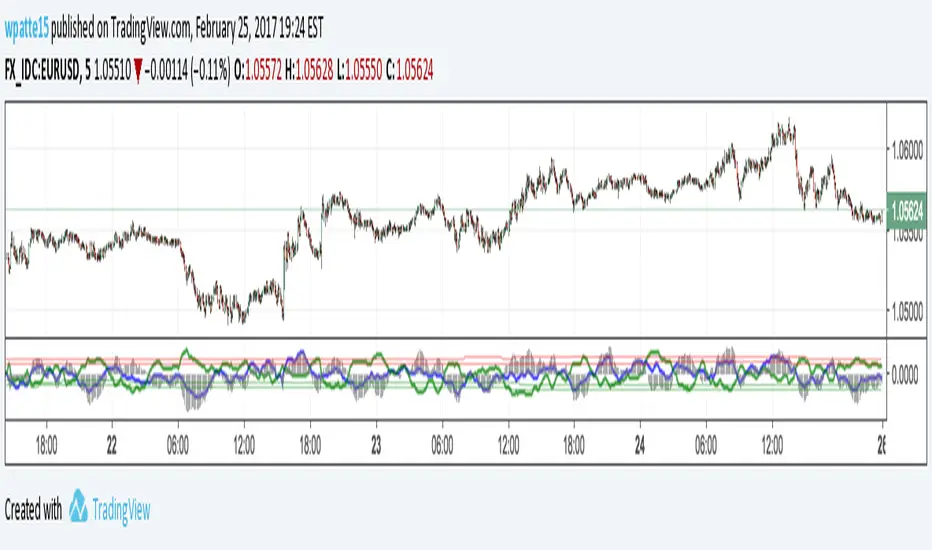
Pair Strength EURUSDThis is an application of the WaveTrend indicator by LazyBear against a basket of the eur and usd to come up with a total eur and usd wt value. You can change the currencies by altering which pairs its run on. As far as changes I removed the lagging 4sma and altered the OB OS to be 2 and 3 standard deviations from a 1000sma just to get a stable view as to where the values tend to rise to. I've had some success using it over the past week or so, when dollar is OB an euro is OS you can expect EURUSD to go up as those reverse and vice versa.
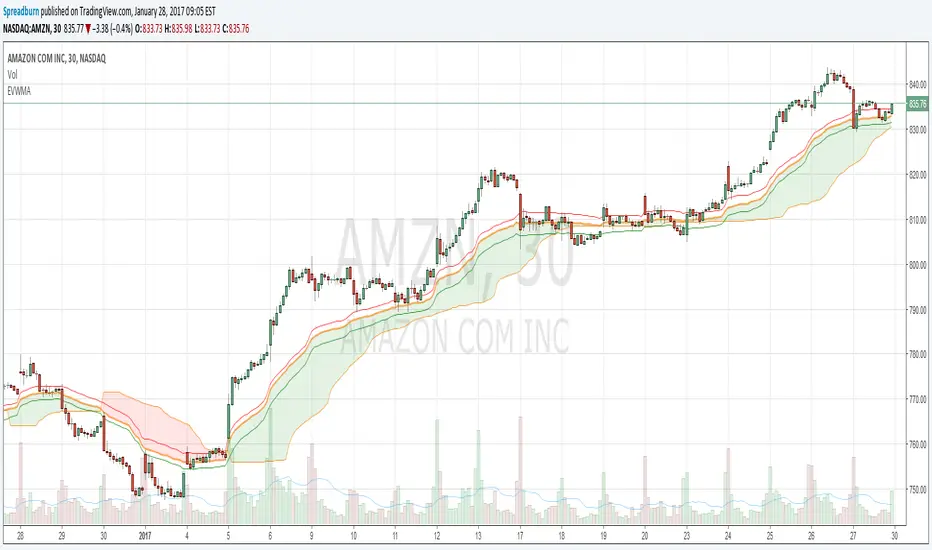
Elastic Volume Weighted Moving Average with Trend and EnvelopesElastic Volume Weighted Moving Average (EVWMA) with Trend and Envelopes.
Original version by LazyBear, trend function by Shizaru, combination by Spreadburn.
Tops/BottomsUsing Modified code from Lazybear's CVI 0.17% indicator and some logic, this script can help identify value buy and sell opportunities at a very early phase. Best used as a confirmation tool. This is a beta, so use it as such. Enjoy.
Sometimes "top" indications in an uptrend mean to look for an opportunity to add to position while "bottom" indications during a downtrend can represent the same thing. The trend is your friend, use it to your advantage!
Red star above bar == potential top
Green star below bar == potential bottom

Chaos 2.0This is pure chaos!
I just wanted 1 thing I can put on a chart to try to get a clearer picture of what is going on (and not take up all the indicator spaces a free user is allowed haha)
Many things going on from so many different users
honestly I'm sorry I cant shout out everyone whose code I have ever read and used in another project just for the sake of learning more about pinescript!
As a way of shouting everyone out! (and giving out my most useful and configurable system)
I give you... CHAOS
I originally got an Alligator, AO, and Fractal script from a user ChaosTrader, then realized I love using averages!
I added the MESA (lazybear?) and the McGinley Dynamic Range (sry idk) and a simple 233 SMA.
I also found about something called the www.prorealcode.com another user had created for Pinescript.
I really liked that script so I adapted it to do the same kind of signal printing for circles and squares (crosses and series)
Check it out tell me what you think and how I can make it better for everyone!
thanks all!
Snoop

Elliot Wave OscillatorEWO Indicator, helps to indentify waves
Similar like LazyBear's Indicator: ElliotWave Oscillator
I extended and changed the following:
Allow custom SMA interval default 5 and 35. Dont use EMAs
Choose input source: default close, f.e. use HL2
Show difference of SMAs in percent based on current candle default "true", this is very useful for historical charts

Candlestick Trend Indicator v0.5 by JustUncleLRequested Update to this Indicator alert project. In this update I have added the option to be able select which Price Action candles you want included in the display and the generated alarm Alert. Other changes also included in this update:
Also added a Price Action candle for "Last Fractal S/R Break", this also a good continuation indication.
Added option to select a different moving average types for directional MA line.
Modified some default settings, using HullMA instead of Zero Lag EMA and standard MACD settings(12,26,9).
Description:
This is a trend following indicator and alert for Binary Options based on Candlestick patterns and trend line -
NOTE: original system was a forex trading system.
This code combines a number of indicators to create an overall trading strategy.
The indicator recognises and displays some useful candle named defined patterns that are used to support trend continuation:
Bearish + Bullish PinBars
Dark Cloud Cover
Piecing Line
Bullish + Bearish Harami
Bullish + Bearish Engulfing Candle
Bullish + Bearish Last Fractal S/R break
Also recognises main Price Action candles from ChrisMoody (CM), the four(4) price action patterns are colored coded bars:
Yellow = Inside Bar - breakout/continuance
Orange = Outside Bar - breakout/continuance
Aqua/Fuschia = Up/Down Shaved Bars - Buying/Selling pressure
Red/Green = Possible reversal PinBars - Reverse Down / reverse Up
The highlighted candles (maroon and darker green) represent the defined PA patterns that have been confirmed following the current trend direction that is indicated by the Hull MA(20) line (can select a different type of MA, or even disable) and confirmed by MACD direction (can be disabled). The confirmed Alerts are indication by green (buy) and red (sell) dots at the bottom of the chart. An alert is generated from this selection for the alert condition of the alarming system.
The fractal upper/lower break lines are also draw, if the (optional) last fractal break line is broken by a highlighted bar then this indicates a stronger trend conformation.
The MACD indicator MACD DEUTER 2 colour(12,26,9) you can visually see the MACD histogram colours with MACD direction - needs "MACD DEUTER 2 colour" indicator.
This multi-indicator set up is suitable for 1hr, 4hr and daily charts with 1-4 candle expiry.
References and Inspiration from:
Fractal Levels by RicardoSantos
Almost Zero Lag EMA
Candlestick Patterns With EMA by rmwaddelljr
CM_Price-Action-Bars by ChrisMoody
www.forexstrategiesresources.com
"Scalp Jockey - MTF MA Cross Visual Strategizer by JayRogers"

STEEMSBD WaveTrendWaveTrend-Oscillator over synthetic STEEM/SBD based on STEEM/BTC and SBD/STB from Poloniex.
WaveTrend part is based on LazyBear's port of TS/MT indicator.

Squeeze Momentum with different time frameSqueeze Momentum from LazyBear with the option to change time frame

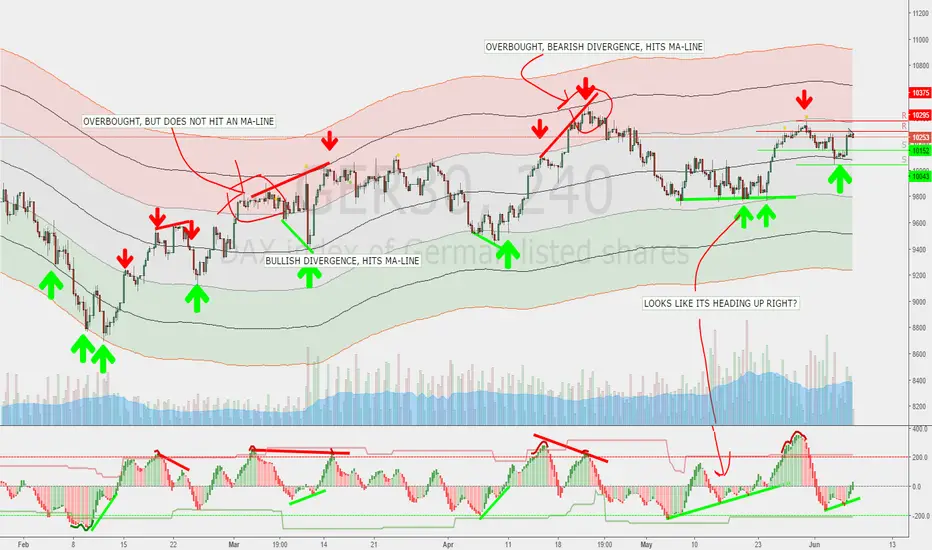
Yacine MA Bands ModMashed together the ema-bands from IvanLabrie with some moving average script stuff from ChrisMoody and LazyBear and this is the result. Credit goes to them, 'cause I don't know to how to code tbh. Just copy/pasted stuff untill I got the result I wanted.
Bands work as support/resistance among other things. You can use them to trade breakouts or reversals or whatever.
Combining them with a momentum indicator would probably be useful for timing divergence or OB/OS and stuff like that.
Included moving average types;
SMA
EMA
RMA
WMA
VWMA
HullMA
TilsonMA
TEMA
Not sure if all of them works as they should... y'know since I cant code/script. Looks good to me though.¨
Default should work pretty good for the DAX, But you'll probably want to fiddle a bit with the settings.
Here's a pic of how they can be used. Ofc everything looks simple in hindsight, but you get the point.
Squeeze Momentum Indicator [AJ]Modified LazyBear's indicator to display on top of price. This makes visualizing it much easier and allows you to clearly focus on price action along with the squeeze.


Kay_StochasticRSIThis is a different version of Stochastic RSI. the only difference is the use of variable moving average by Lazybear instead of regular sma for K smoothing.
Its purely an experiment. I am not a professional trader but an enthusiastic programmer trying different indicator combination to see different results.
Criticizing and negative comments will be gracefully accepted. :)
Appreciation will be even more. :)
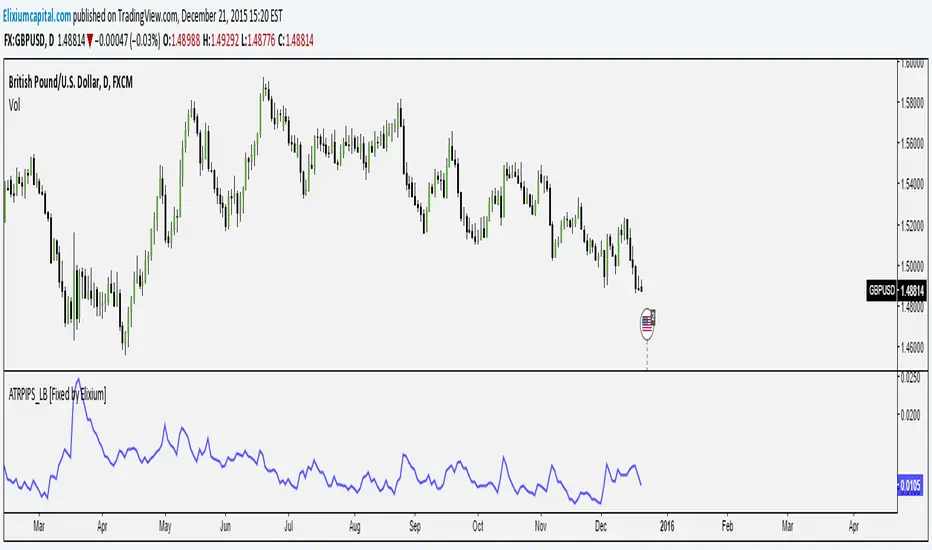
ATR Pips [LazyBear] [Fixed by Elixium]This is ATR in pips. This was requested by user @ElixiumCapital on Twitter. ATRPIPs in his words:
How to use: Change the chart to the Daily time frame. The indicators value e.g. 0.0105 means that the average daily range of the past 5 trading days is 105 pips. (On standard pairs like EURUSD, GBPUSD)
"ATR PIPs is useful for finding markets with your desired amount of volatility, for example I prefer to trade forex pairs with the highest amount of volatility in the past 5 days, setting the length parameter to 5 days. And setting my stop loss at 25% to 33% of the the indicators value."
Fixed: Default parameters and a critical bug.
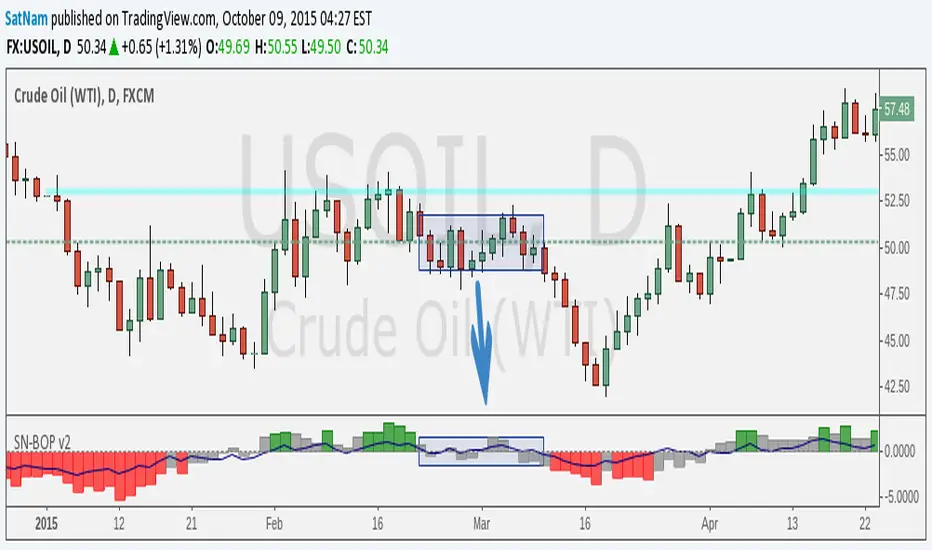
SN Smoothed Balance of Power v2Hi all,
here is an updated version of the indicator script I published yesterday.
The goal of this indicator is to try and find darkpool activity. The indicator itself is not enough to fully identify darkpool but it should be able to detect quiet accumulation. What makes this Balance of Power different from others on TV is that it is smoothed by using a moving average.
Notes:
- The values that are default are completely arbitrary except for the VWMA length (a 14-day period for the 1D chart is the norm). For instance the limit where it shows red/green I picked because it works best for the 1D chart I am using. Other TF's and charts will need tweaking of all the values you find in the options menu to get the best results.
- I modified the indicator such that it is usable on charts that do not show volume. HOWEVER, this chart is default to NYMEX: CL1!. To get different volume data this needs to be changed in the option menu.
- I am in no way an expert on darkpool/HFT trading and am merely going from the information I found on the internet. Consider this an experiment.
Credits:
- Lazybear for some of the plotting-code
- Igor Livshin for the formula
- TahaBintahir for the Symbol-code (although I'm not sure who the original author is...)
Smoothed Balance of PowerSmoothed BOP to try and find dark pool activity. Only works in charts with working volume!
Credits go to LazyBear for some coding on the plotting and Igor Livshin for the formula.

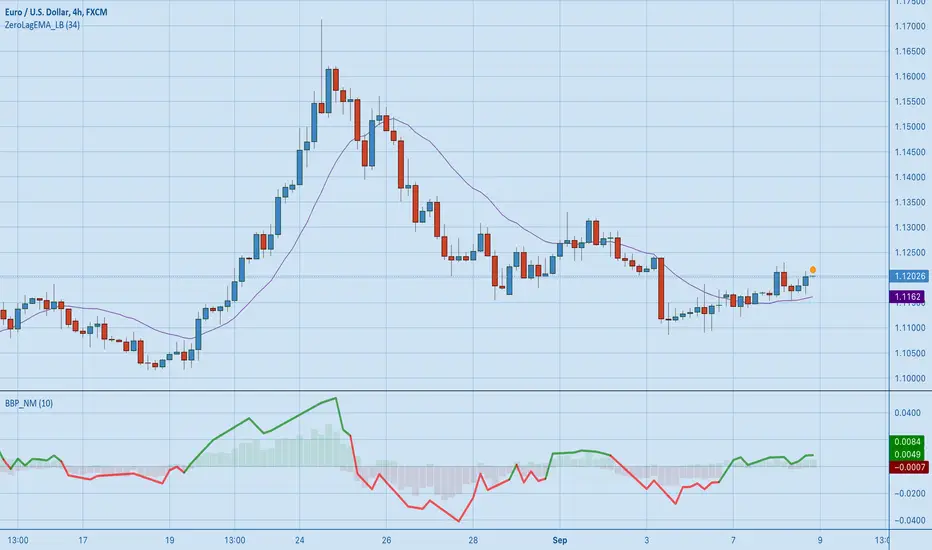
[RS][NM]Improved Linear Regression Bull and Bear Power v01The base code for this indicator was created by RicardoSantos
What I added is a signal line that indicates when to buy and when to sell.
Advised use :
Combine with a zero-lag indicator like ZeroLagEMA_LB by LazyBear (suggested period = 34)
Then use the following Rules of engagement :
Current price > ZLEMA & Signal line of BBP_NM is green : BUY
Current price < ZLEMA & Signal line of BBP_NM is red : SELL Please click the like button if you dig this indicator !
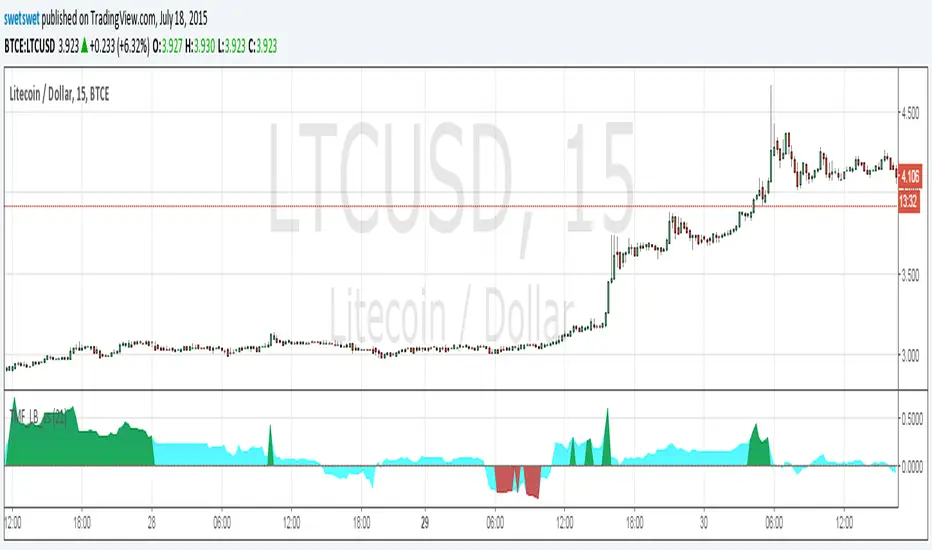
Twiggs Money Flow_LB [SwetSwet]The modified indicator Twiggs Money Flow more convenient. The critical value is colored in green or red.
KK_Price Action Channel (TDI BH)Hey guys,
this little script is an addition to another one I will release right after this.
This is the Price Action Channel. The bands are calculated using a smoothed moving average of the highs/lows. I have taken the smoothed moving average script from the public library in order to create this, so all props to whoever created that one.
I am fairly new to creating scripts so use it with caution and let me know what you think!
EDIT: Here is the script I have written this one for:

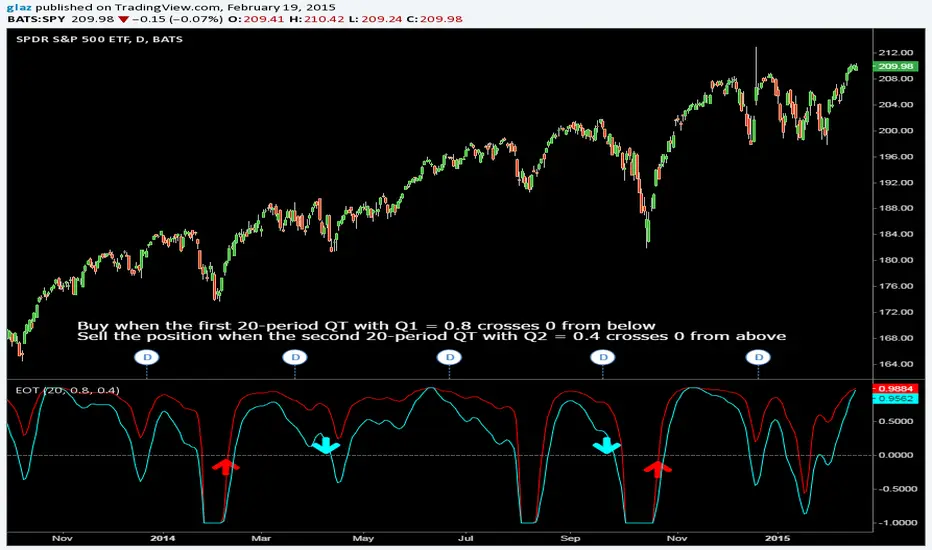
Ehlers Early Onset TrendIn his article in this issue, “The Quotient Transform,” author John Ehlers introduces the quotient transform (QT), a zero-lag filter that can be used for the purpose of timely trend detection. The QT is an advancement of the technique he presented in his January 2014 S&C article, “Predictive And Successful Indicators.” This time, the output of a roofing filter (which includes applying a high-pass filter and SuperSmoother filter) is normalized.
Code and other platforms www.traders.com
Pinescript code Glaz and LazyBear
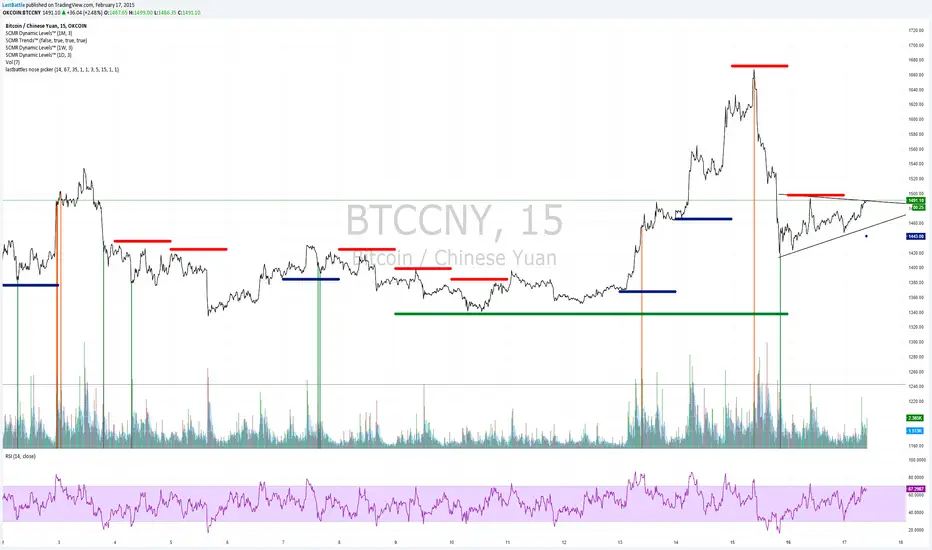
[Bitcoin] Lastbattle's nose pickerI've been working on a top and bottom picker script over the past couple of weeks, based on RSI of multiple timeframe closing price. It've been a pretty good trading system that's tested over the last meteoric rise from 220~270 and back down to 230 right now, and I think it should be released to the community.
Sure, I'm not worried about this strategy not working anymore after it is being used by the majority. Everyone have a different view of the market, and this is more towards psychology. It'll likely to hold for as long as there are still humans trading Bitcoins. Bitcoin market is full of emotions, you'll never run out of it.
So why does it work?
If you take a look at the live charts offered by Bitcoinwisdom and Cryptowatch, they only offer 1, 3, 5, and 15 minute timeframe by default with no other option to switch.
Naturally more traders will look at these levels for oversold and overbought condition.
The same indicator does not work for the broader commodities market such as Gold and Silver.
How does it work?
As long as the RSI levels of 1, 3, 5, and 15 minute fulfills the oversold/overbought level, a signal will be given.
The overbought/oversold level gets compensated the higher volatility the market is in.
Note: **
-This is only for exit strategy. If you're on long, consider reducing or exiting your position when it displays a red. On the other hand if you're short, consider reducing or covering your shorts if it shows a green.
-It may give false signal in a trending market, use your trading experience and judgement to filter them out. (eg: uptrend usually have more than 1 legs AND after a long consolidation, RSI gets to oversold/overbought easily... the market will tend to test the support/resistance again.)
-This is tuned for the 15m interval, the script won't work beyond this. I use it for scalping futures. Feel free to change or remove this line 'plot(interval == 15 and '
-Even if it shows a signal, it may not be the true top/bottom. Sometimes there may be a weak diverged leg aka 'last fart', so that's one reason I dont use this for entry until more confirmation is given via other indicators.
** If your chart is zooming all the way down to 0, right click on the price at the right and select 'Scale price only'
Go ahead and try this out with willy, etc and see what works better :D
Credits:
-LazyBear for the volatility switcher script
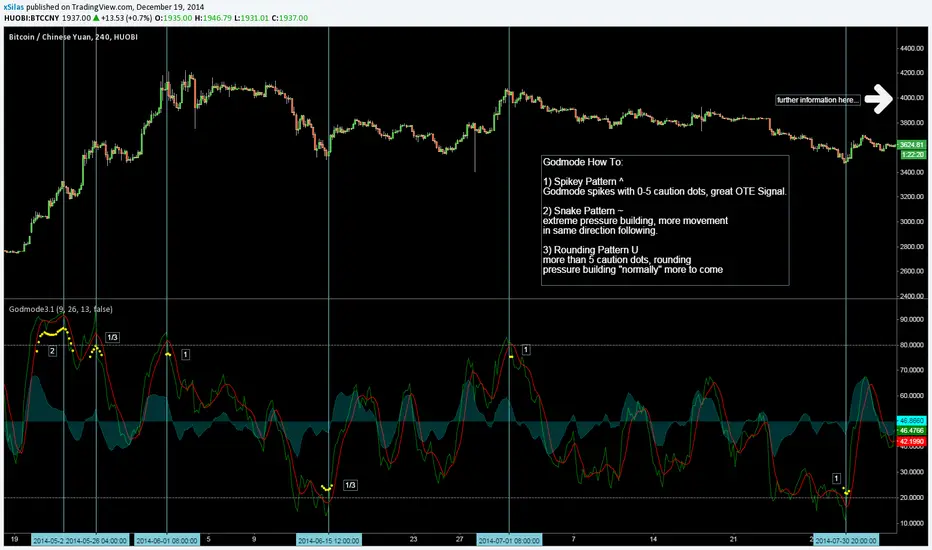
Godmode Oscillator, fresh bread generator, free to use!Greetings Mates,
!!! If you want to use this tool for free you have to to following steps:
1) say thanks to LEGION who coded the first version.
2) say thanks to LAZYBEAR cause we ripped some code snippets from him.
3) say thanks to Ni6HTH4wK who coded the latest version.
4) say thanks to xSilas who gave the idea.
5) I know i said its a FREE Tool and you dont need to donate me cause i have Godmode :), but lets have a litte thought on all the people that are a bit poorer than us. It would be really great if we get some DOLLARS for a great charity action for children.
6) Feel free to spend some Bitcoins to this Address: 1BNjs1Prsux8YQawVWYfiYoxzoKzfReckX
(i start and going to spend 1 BTC) (! the spended amount is revealed at the end!)
7) If you know said thankyou to everybody and may spend some dollars we can go on with Godmode trading.
8) Enjoy the Tool, merry Xmas and cheers for another great volatile bitcoin year :).