OPEN-SOURCE SCRIPT
Güncellendi [RS][NM]Improved Linear Regression Bull and Bear Power v01
The base code for this indicator was created by RicardoSantos
What I added is a signal line that indicates when to buy and when to sell.
Advised use :
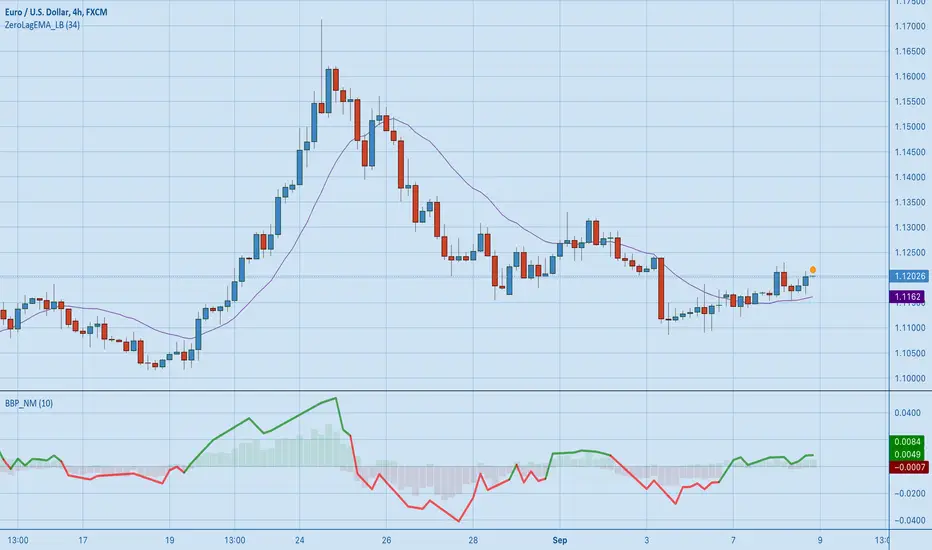
Combine with a zero-lag indicator like ZeroLagEMA_LB by LazyBear (suggested period = 34)
Then use the following Rules of engagement :
Current price > ZLEMA & Signal line of BBP_NM is green : BUY
Current price < ZLEMA & Signal line of BBP_NM is red : SELL Please click the like button if you dig this indicator !
What I added is a signal line that indicates when to buy and when to sell.
Advised use :
Combine with a zero-lag indicator like ZeroLagEMA_LB by LazyBear (suggested period = 34)
Then use the following Rules of engagement :
Current price > ZLEMA & Signal line of BBP_NM is green : BUY
Current price < ZLEMA & Signal line of BBP_NM is red : SELL Please click the like button if you dig this indicator !
Not
I have found a little calculation error in this script where if there is no data for either bull or bear volume, the indicator will not plot. This has been corrected in version 2 ![[NM]Improved Linear Regression Bull and Bear Power v02](https://s3.tradingview.com/g/GQZct22g_mid.png)
Açık kaynak kodlu komut dosyası
Gerçek TradingView ruhuna uygun olarak, bu komut dosyasının oluşturucusu bunu açık kaynaklı hale getirmiştir, böylece yatırımcılar betiğin işlevselliğini inceleyip doğrulayabilir. Yazara saygı! Ücretsiz olarak kullanabilirsiniz, ancak kodu yeniden yayınlamanın Site Kurallarımıza tabi olduğunu unutmayın.
Check out my FREE indicator scripts:
► tradingview.com/u/Profit_Through_Patience/
► tradingview.com/u/Profit_Through_Patience/
Feragatname
Bilgiler ve yayınlar, TradingView tarafından sağlanan veya onaylanan finansal, yatırım, işlem veya diğer türden tavsiye veya tavsiyeler anlamına gelmez ve teşkil etmez. Kullanım Şartları'nda daha fazlasını okuyun.