"3 ema" için komut dosyalarını ara

Volume (D)EMAA simple yet configurable indicator that shows recent traffic volumes.
The time period is specified as weeks/days/hours/minutes, not as bars.
Set the volume period to non-zero if you want to use a generalized double EMA instead of plain.
The "ratio" option will show the size of the current volume compared to the average volume as computed for the specified time period; say hello to fat tails and goodby to "standard" and "normal" and "average". With the "together" option, it compares the current volume to the both sides together (buy+sell), otherwise it compares it to just its respective side.
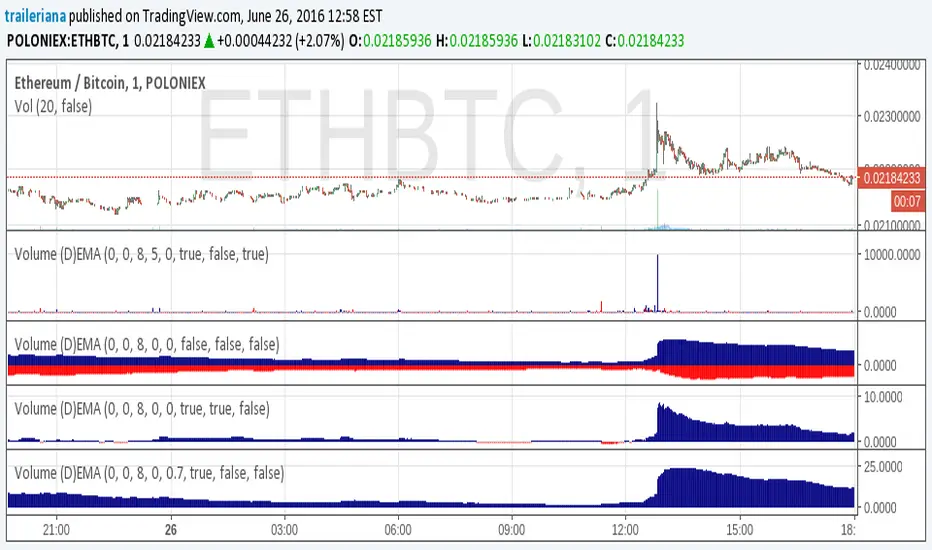
Volume (D)EMAA simple yet configurable indicator that shows recent traffic volumes.
The time period is specified as weeks/days/hours/minutes, not as bars.
Set the volume period to non-zero if you want to use a generalized double EMA instead of plain.
The ratio option will show the size of the current volume compared to the volume in the specified time period (expect to see something very non-Gaussian, say goodby to trusting your ATR and stddev, and say hello to fat tails.) With the "together" option, it compares the current volume to the both sides together (buy+sell), otherwise it compares it to just its own.


Ichimoku EMA BandsSome find Ichimoku Clouds bit complicated. This simplified version is combined with EMA Bands may be profitable. Give a try!. I recommend hourly timeframe for good results. Aye! :D

[JR] Multi Bollinger Heat Bands - EMA/Breakout optionsA little, yet hopefully useful update over my previous "Multi Bollinger Heat Bands". For those who like quick visual cue's.
In short: It's your Basic Bollinger Bands, but 3 of them, and some pointy things.
In full:
Three stacked SMA based Bollinger Bands designed just to give you a quick visual on the "heat" of movement.
Set inner band as you would expect, then set your preferred additional multiplier increments for the outer 2 bands.
Option to use EMA as alternative basis, rather than SMA.
Breakout indication shapes, which have their own multiplier (but still tied to same length/period as the BB's) so you can make them pop on their own separate "band".

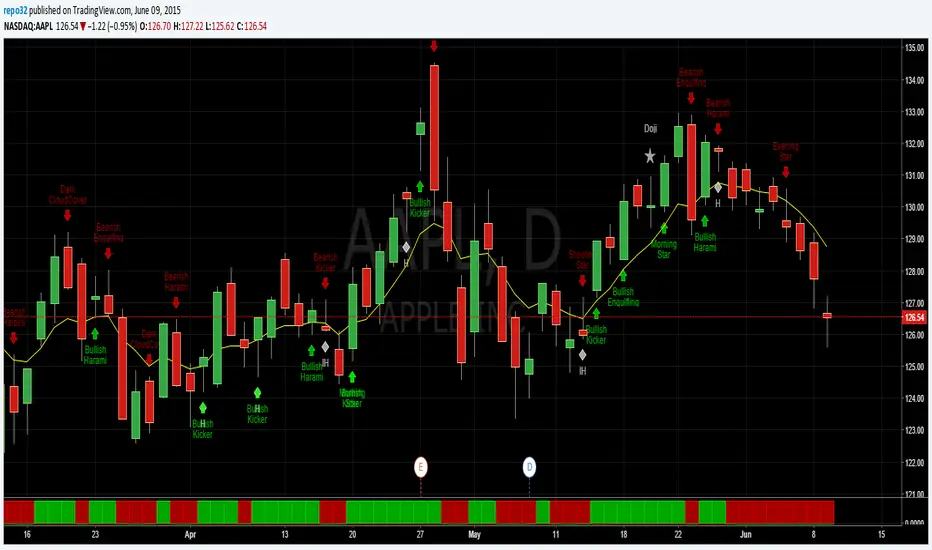
Candlestick Patterns With EMA and Stochastic6/11/15, Corrected barcolor errors.
Candlestick patterns identified and color coded according to position above or below 8EMA(TLine).
Special thanks to repo32, DavidR, and Chris Moody for coding ideas.
Bullish candlestick buy signals have a greater probability of success when Stochastics are oversold. Bearish ones have a
greater probability of success when overbought. Stack as many factors in your favor as possible. A candlestick signal by itself is of little value unless you apply additional information with it. An 8 EMA is coded also to help with buy/sell signals. Some of the videos by Steven Bigalow are on the Web to see how he uses it.
www.youtube.com
Regardless of systems and strategies used, make your second trade first: Know when you're going to exit. Risk management rules. Good luck and good trading.

Price above/below EMAThis script will give you red/green columns to indicate if price is above or below a certain EMA. With Candlestick charting, we are looking for price in relation to the 8 ema Trigger Line (T-Line). You can adjust this indicator to fit your need. Simple, but nice to quickly see.
Oops. Last line's title should be "Sell". Doesn't affect display though.


EMA 9×20 Multi-TF Scanner — M/W/DThis scrip will facilitate for swing trade based on momentum achieved in monthly weekly and daily


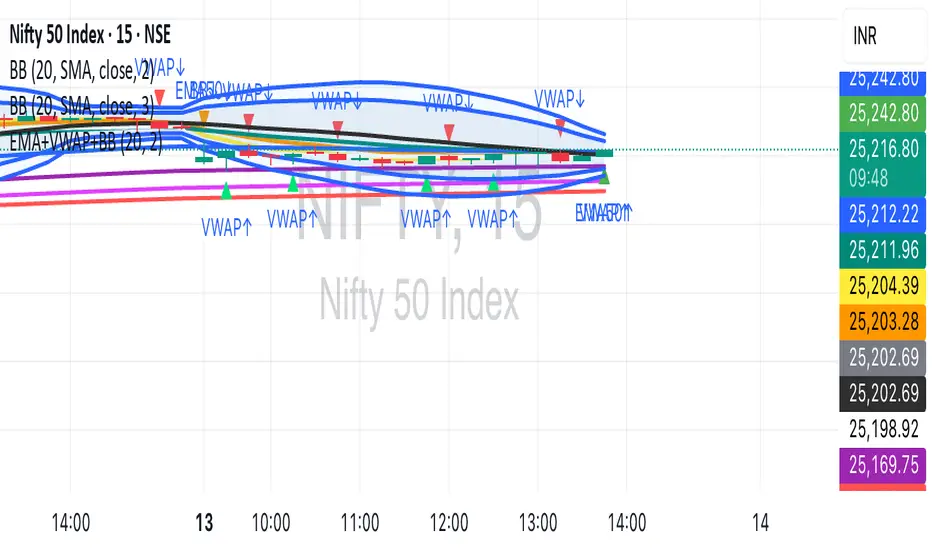
EMA (5, 10, 20, 50, 100, 150, 200)+VWAP+BBEMA Cluster + VWAP + Bollinger Bands + Alerts + Visual Signals (Fixed)
EMA/SMA Zones 9, 21, 30, 50, 100, 200 + othersMeant for swing trading on the daily chart, feel free to copy and remove/add sections as you wish (Used chatGPT for a lot of it).

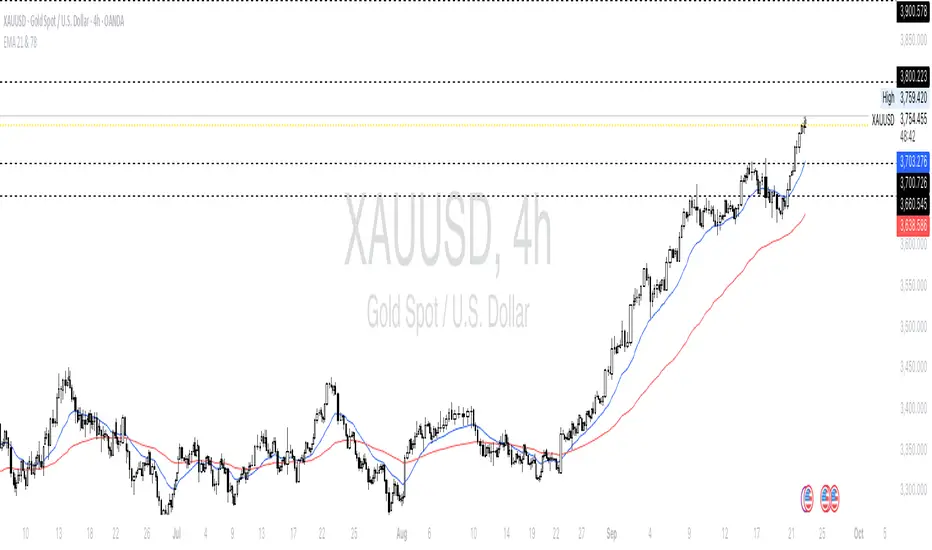
EMA 21 & 78 - With Instrument Nameonly add EMA21 and 78, I saw the 21 and 78 period is the most favor period when trading with gold
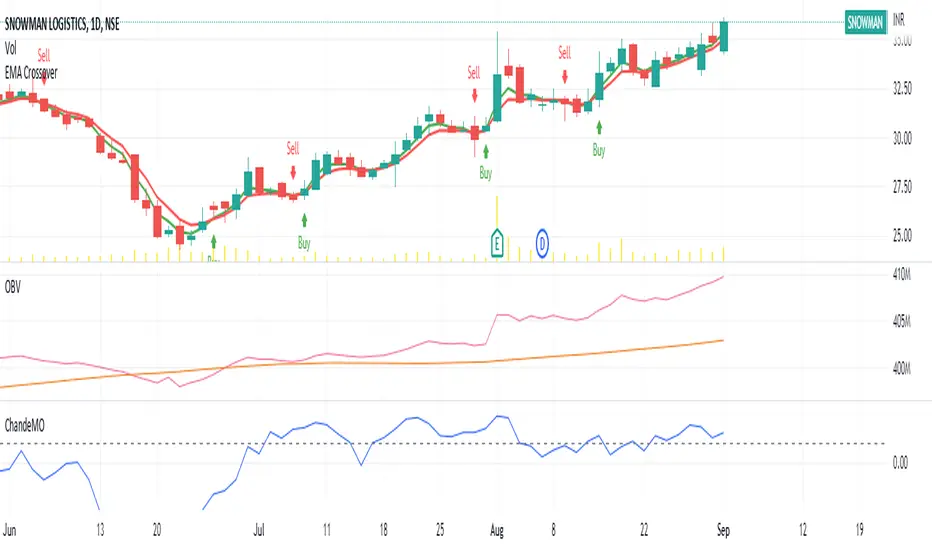
EMA band 12/60/150/200EMA band consisting of 12/60/150/200
Specifically for Indian stock market, can be used for other trading scripts after testing.
Best use case : on Daily TF.
Bull run entry criteria, Not bear market or Bottom catching.

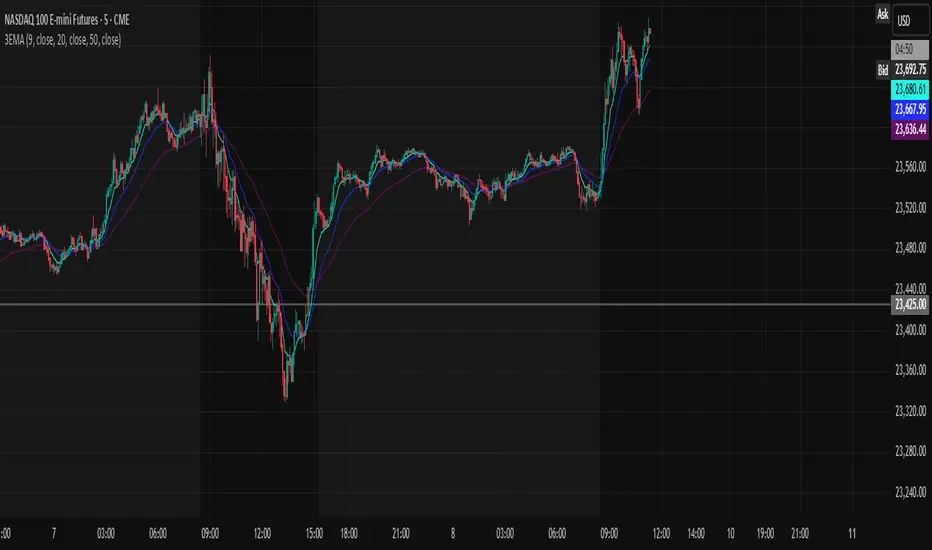
EMA 9, 20, 50Exponential Moving Averages of 9, 20, and 50. Used to gauge buy and sell opportunities in trending markets.
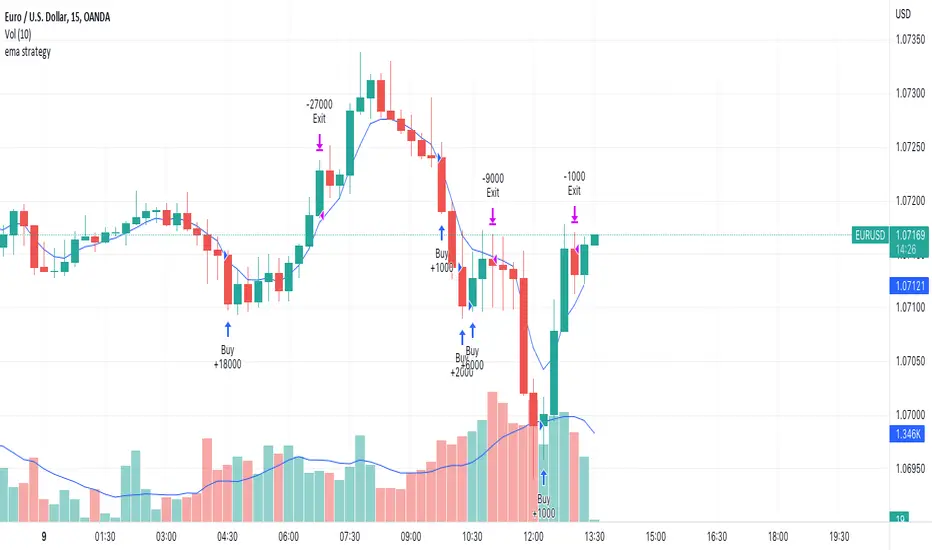
ema strategyEMA STRATEGY Scalping with staggered buy and profit Booking
try and like if you get profitable
EMA Price Distance TrackerThis simple indicator tracks the distance that the price is from a moving average. This can be helpful when looking for reversals based on historical informaiton.

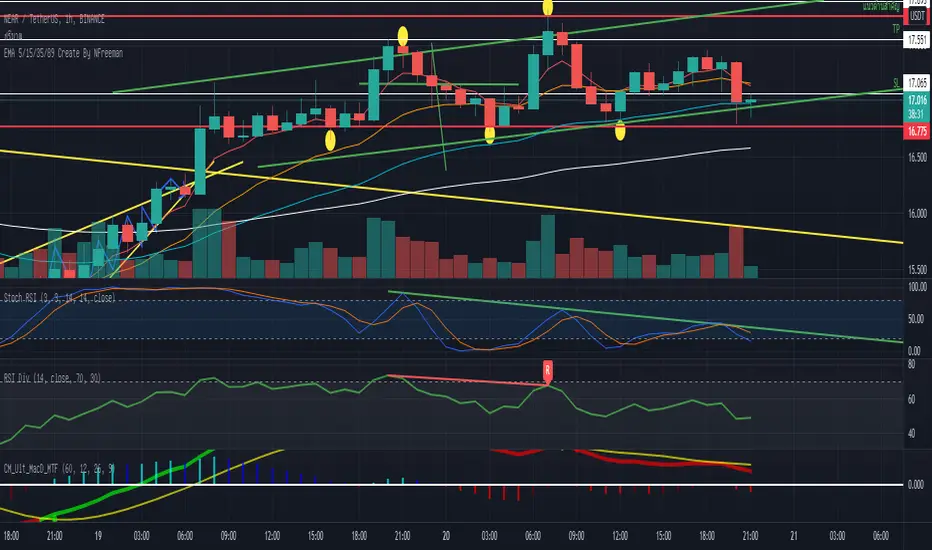
EMA 5/15/35/89 Create By NFreeman (Technical by CJ.SuperTrader)How to Use
เงื่อนไขการเล่นคือ UPTrend และดูแบบ TF1Day
-จังหวะการเข้าซื้อคือช่วงที่พักตัวลงมาระหว่าง EMA35-EMA89
-จังหวะที่ต้องบริหารความเสี่ยงคือช่วงหลุด EMA89
ขอให้ทุกคนเทรดได้ และมีความสุข