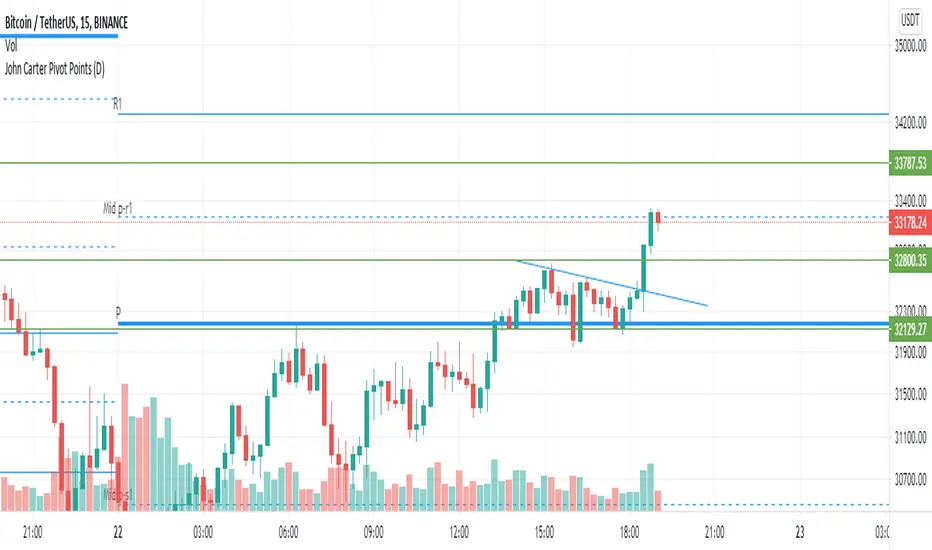
John Carter Pivot Points
This script is based on John Carter Mastering The Trade book. Pivot calculation is based on the previous day high, low, and close.
What Are the Trading Rules for Pivot Buys on Trending Days?
Sells are reversed.
1. Each day I update the appropriate pivot levels on the charts to reflect the previous day’s action. On Mondays, I also
update the weekly pivots, and on the first trading day of a new month, I update the monthly pivots.
2. The first pivot play is done in conjunction with the gap, if there is one. If there is a gap down, then I buy a decline into
the closest pivot level. If there isn’t a playable gap (more than 10 YM points or 1 ES point), then I will wait until
9:45 a.m. eastern to initiate the first play.
3. If the volume on the five-minute ES chart is more than 25,000 contracts, then I’ll wait for the markets to penetrate a
pivot level and move up at least a quarter of the way to the next pivot level. Once this happens, I will then set up a
bid to buy the first retracement back to the violated pivot level.
4. I enter my trades with limit orders only. I place orders “just in front of” the pivot. For the YM, I use 3 points; for the
ES, 0.25 point; for the NQ, 0.50 point; for the TF, 0.20 point; and for individual stocks, 5 cents. For example, if I’m
trading the YM and the pivot level is 10,000, then I would buy a decline to 10,003 and short a rally to 9997
.Sometimes the pivot will be an odd number, such as 1117.38 on the ES. In this case, I always round in the direction of
the trade. So, if I’m bidding for a long, I will round 1117.38 to 1117.50, and my bid will be 1117.75. If I’m offering a
short, I will round 1117.38 down to 1117.25 and place my offer at 1117.00. My stops and targets, then, would be “just
in front of” these appropriate long and short levels.
5. Once filled, I place an order to close the first half at the next pivot level and the second half at the pivot level after
that, using the same “just in front of” parameters.
6. I place a stop at 20 points for the YM, 2 points for the ES, 4 points for the NQ, and 1.50 points for the Russell. For
stocks, I will use a stop based roughly on the price of the stock. If the stock is under $10 a share, I will use a stop of
20 cents. If it is between $10 and $20, I will use a stop of 30 cents; if it is between $20 and $30, I will use a stop of
40 cents, and so on, adding another 10 cents for each $10 increment in price. (A $75 stock would have an 80-cent
stop, for example.)
7. If the first target is hit, I will then move up the stop to my entry-level pivot, minus the “just in front of” fractions
discussed in rule 3. For example, if I get in a YM long at 10,003 and the pivot is at 10,000, then my new stop would
be 9997 once the first target is hit.
8. If I am in a trade at the market close and neither my stop nor my target has been hit, I will close out my position “at the
market” at 4:10 p.m. eastern for futures, and at 3:58 p.m. eastern for stocks.
9. I don’t initiate any new positions after 3:30 p.m. eastern, but I will manage existing positions into the close.
10. The markets rarely have a sustained move above R3 or below S3. If I trade to those levels, I will always fade the
move.
11. After two losers in a row, I’m done with pivots for the day.
What Are the Trading Rules for Pivot Buys on Choppy Days?
Once again, sells are the same, just reversed. The rules for choppy days are identical except for the targets. On choppy days, I
just focus on the YM and the ES. My first target is mechanical: 10 points for the YM and 1 point for the ES on half of my
position. Once this is hit, I will trail up my stop in the same way I would for a trending trade. The second target becomes the
“just in front of” level for the actual next pivot level
Komut dosyalarını "沪深主板45度上升的股票" için ara
Strategy- Double Decker RSIThis Strategy was LIVE coded during a webinar conducted by the author on 16-Jan-21 titled Backtesting in Tradingview. The system is named " Double Decker RSI ".
The rules of this strategy are:
LONG - RSI(5)>70 and RSI(14)>50 -- EXIT: RSI(5)<55
SHORT - RSI(5)<40 and RSI(14)<50 -- EXIT: RSI(5)>45
Instrument - BANKNIFTY - 1 HR Chart
The code is open source for you to edit and make changes as needed. For details on the strategy and webinar, you can refer to the website in signature of this strategy.

Multiple Time Frames Moving Averages (x3)This indicator is a set of 3 moving averages for which you can configure the type of the moving averages , their length , and of course the time frame . The moving averages you can choose from are:
- Simple Moving Average ( SMA )
- Exponential Moving Average ( EMA )
- Weighted Moving Average ( WMA )
- Running Moving Average (RMA)
- Hull Moving Average ( HMA )
- Volume Weighted Moving Average ( VWMA )
- Arnaud Legoux Moving Average ( ALMA )
The time-frames you can choose from - minutes (1, 3, 5, 15, 45), hours (1, 2, 3, 4, 12), days (1, 3), weekly or monthly .
Overall, it is a minimalistic indicator. No major improvements or trading logic like some of my other indicators, but I did make it slightly easier to use and visually appealing. The MAs' colors change from light to dark green/blue/red depending on the trend - bullish or bearish respectively. Initially, those were changing from green to red (based on direction) but it became a bit confusing when they started crossing each other. Anyway, feel free to change those colors to whatever you like.
If you have suggestions on how to improve this indicator or ideas about new ones, please drop me a line. Thanks.

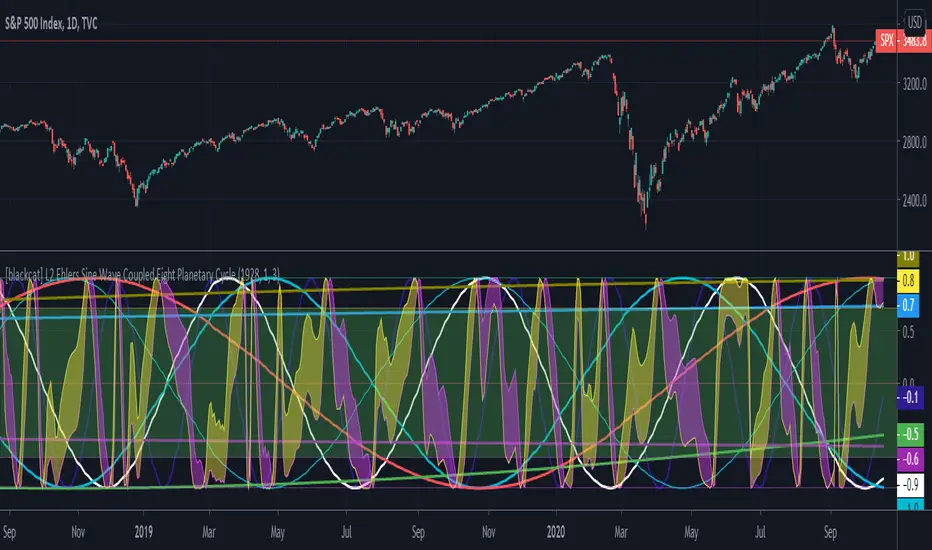
[blackcat] L2 Ehlers Sine Wave Coupled Eight Planetary CycleLevel: 2
Background
Have you considered that factors outside the Earth will be related to macro market trends? Let’s discuss the relationship between the planetary movement in the Galaxy and the market movement on Earth today! Although I said that, you may have laughed out in front of the screen, but the calculations in this script are entirely based on astronomical data and mathematical relationships.
Your next question may be why you compare the movements of the eight planets and the laws of the market on the earth together? My answer comes from a Cybernetic Sine Wave indicator proposed by Dr. John F. Ehlers.
Function
L2 Ehlers Sine Wave Coupled Eight Planetary Cycle first converts the astronomical data of the eight major planets into planetary aspects/phases through mathematical relationships. Planetary aspects/phases can provide the historical and current relative positions of each planet in the mathematical triangle relationship. We can use a simple mathematical sine formula to constrain the planet's trajectory between -1 and 1, which is what we often call a sine wave.
The relationship between the sine wave and the market can be extracted from the theory of John F. Ehlers. In Ehlers' theory, market price can be modeled by the trend and cycle modes. And in his works, there are many indicators of how to completely remove the trend in the market price and only leave the cycle mode data. The Cybernetic Sine Wave indicator is exactly the cycle mode data after the market trend is stripped, and expressed in the form of a sine wave.
If you can read to here with patience, you must also be aware of the premise that the trajectories of the eight planets and the laws of the earth market can be coupled: the trajectory of the sine wave mode. Therefore, this indicator is a tool for comparing and analyzing the two in the same chart. I hope you like it.
Finally, in order to benchmark the trajectories of the eight planets and the specific market on the earth, a starting point in time is particularly important. This is the base date of the market index to be analyzed. It is the year, month, and day data specified by the index, which needs to be input by the user when analyzing a specific stock index. For example, the base date of the S&P 500 index is January 3, 1928. This date needs to be entered into the indicator to analyze the SPX500.
Key Signal
Mercury_trail ---> smoothed Mercury orbit sine wave
Venus_trail ---> smoothed Venus orbit sine wave
Earth_trail ---> smoothed Earth orbit sine wave
Earth_mirror ---> smoothed Earth mirrored orbit sine wave
Mars_trail ---> smoothed Mars orbit sine wave
Jupiter_trail ---> smoothed Jupiter orbit sine wave
Saturn_trail ---> smoothed Saturn orbit sine wave
Uranus_trail ---> smoothed Uranus orbit sine wave
Neptune_trail ---> smoothed Neptune orbit sine wave
Aspect 0, 45, 90, 225, 270 deg ---> key planet aspects
ehlersine ---> Ehlers Cybernetic Sine Wave
ehlerslsine ---> Ehlers Cybernetic Lead Sine Wave
Pros and Cons
This is a technical indicator that I have come up with on a whim, and the laws of planetary operation and the operation of the Earth market are still being explored. Hope that interested friends will share your new discoveries.
Remarks
To celebrate I released the 50th technical indicator script on TV!
Courtesy of @sal157011 John Ehlers "Cybernetic Sine Wave" indicator, I converted it from pine v2 to pine v4 in this script.
Readme
In real life, I am a prolific inventor. I have successfully applied for more than 60 international and regional patents in the past 12 years. But in the past two years or so, I have tried to transfer my creativity to the development of trading strategies. Tradingview is the ideal platform for me. I am selecting and contributing some of the hundreds of scripts to publish in Tradingview community. Welcome everyone to interact with me to discuss these interesting pine scripts.
The scripts posted are categorized into 5 levels according to my efforts or manhours put into these works.
Level 1 : interesting script snippets or distinctive improvement from classic indicators or strategy. Level 1 scripts can usually appear in more complex indicators as a function module or element.
Level 2 : composite indicator/strategy. By selecting or combining several independent or dependent functions or sub indicators in proper way, the composite script exhibits a resonance phenomenon which can filter out noise or fake trading signal to enhance trading confidence level.
Level 3 : comprehensive indicator/strategy. They are simple trading systems based on my strategies. They are commonly containing several or all of entry signal, close signal, stop loss, take profit, re-entry, risk management, and position sizing techniques. Even some interesting fundamental and mass psychological aspects are incorporated.
Level 4 : script snippets or functions that do not disclose source code. Interesting element that can reveal market laws and work as raw material for indicators and strategies. If you find Level 1~2 scripts are helpful, Level 4 is a private version that took me far more efforts to develop.
Level 5 : indicator/strategy that do not disclose source code. private version of Level 3 script with my accumulated script processing skills or a large number of custom functions. I had a private function library built in past two years. Level 5 scripts use many of them to achieve private trading strategy.
CC - Consolidated Interval Display (CID)Ever wish you didn't have to rapidly flip between 6 different intervals to get the full picture?
Yeah, me too. Do you also wish that you kind of understood how the shift / unshift function works for arrays?
Yeah, I did too. Both of those birds are taken care of with one stone!
The Consolidated Interval Display uses the new Array structure and security to display data for 5m, 15m, 45m, 1h, 4h and 1d intervals SIMUTANEOUSLY! Regardless of which interval you're looking at you can get the full picture of numerical data without flipping around to get it.
This is my first script trying to use arrays. It basically shows the following for the given ticker:
ATR14, RSI7, RSI14, SMA50, SMA200 and VWAP at the 5 minute level.
ATR14, RSI7, RSI14, SMA50, SMA200 and VWAP at the 15 minute level.
ATR14, RSI7, RSI14, SMA50, SMA200 and VWAP at the 45 minute level.
ATR14, RSI7, RSI14, SMA50, SMA200 and VWAP at the 1 hour level.
ATR14, RSI7, RSI14, SMA50, SMA200 and VWAP at the 4 hour level.
ATR14, RSI7, RSI14, SMA50, SMA200 and VWAP at the 1 day level.
To make it more or less busy, I've allowed you to toggle off any of the levels you wish. I've also chosen to leave this as open source, as it's nothing too experimental, and I hope that it can gain some traction as an Array example that the public can use! If you don't like the different values that are shown, use this source code example as a spring-board to put values that you do care about onto the labels.
If this code has helped you at all please drop me a like or some constructive criticism if you do not think it's worth a like.
Good luck and happy trading friends.
If this gets traction, I will post something similar for a combination of SPY, VIX, GOLD, QQQ, IWM and TLT.

3 Higher High Price & Vol - BTST next day Gap up1) Price & Volume forms Higher High in the last 45 min
2) Volume is above Avg (20 MA Vol)
3) Indicates EOD buying next Gap up will happen
4) BTST strategy
5) Scanner available

21/55 EMA Cloud w/ Optional RibbonThis indicator behaves like a traditional EMA ribbon by using the 21, 25, 30, 35, 40, 45, 50, and 55 bar exponential moving averages. In this particular indicator, the traditional EMA ribbon lines are turned off by default leaving only a filled in area between the 21 and 55 bar averages. The filled in area is green when the 21 bar average is greater than the 55 and red otherwise. Additionally, the 9, 100, and 200 exponential moving averages are available for reference.

Price Action Movements by RPThis is the Indicator which will enhance finding Buying and Selling opportunity on any market.
Mostly suited for day Trading and some indicator can be used for signalling stock on longer time frame.
Indicators used to create this strategy is as follows:
- Exponential Moving Average (EMA)
- Supertrend
- Volume Weighted Average Price (VWAP)
- Exponential Moving Average of Volume Weighted Average Price (MVWAP)
- Previous Day Volume Weighted Average Price (PVWAP)
- Previous Day High, Low and Close (PDH, PDL, PDC)
- And Current Day Support and Resistance points based on Previous day Price Movement.
This will indicate where to buy and Sell with Indicator based on Following criteria,
Buy Signal given,
- When Close is above Exponential Moving Average 9
- When Close is above Exponential Moving Average 21
- RSI above 55
- Supertrend is positive
- Volume is above 300 moving Average
- Close is above Volume Weighted Average Price
Sell Signal given,
- When Close is below Exponential Moving Average 9
- When Close is below Exponential Moving Average 21
- RSI below 45
- Supertrend is negative
- Volume is above 300 moving Average
- Close is below Volume Weighted Average Price
Trades can use this Study according to their need of the Indicator.
Users can Tick the indicator which they want to add on Charts to study.
Only Exponential Moving Average indicator can be used.
Only Supertrend can be used.
Volume Weighted Average Price, Previous Day Volume Weighted Average Price, Exponential Moving Average of Volume Weighted Average Price and Previous Day High, Low and Close can be used as a particular study.
Support and Resistance can be used along with Previous Day High and Previous Day Low as a particular study.
This is multipurpose Study which will help Trading Society immensely.
Thank You.

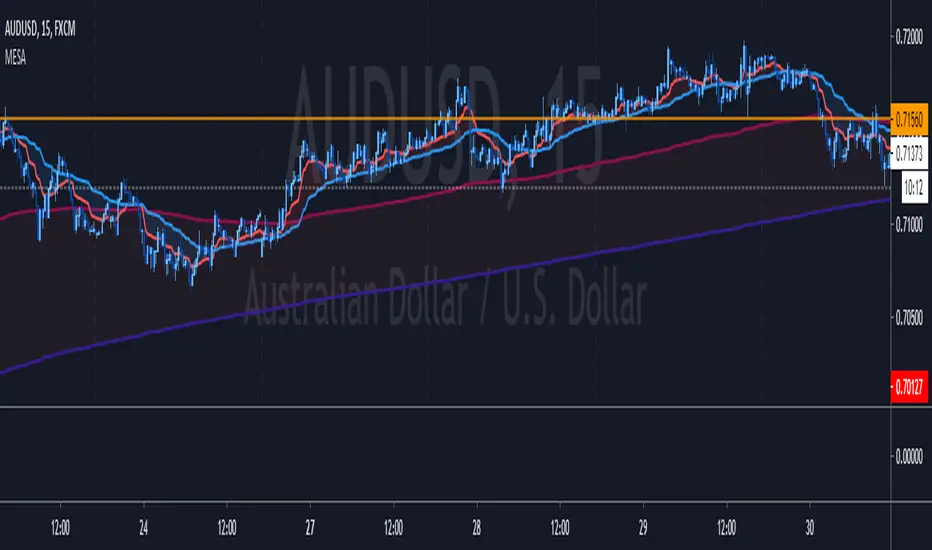
MESA Adaptive Moving Average - Improved MTFThis indicator is a huge upgrade to my original MTF MESA
Plots are now extremely smooth and accurate on all timeframes **
Missing data points are automatically filled with the "best fit"
This is a Trend indicator and should be used to trade "top-down" aka:
Start with the Daily chart to confirm a trend
Move to 4H
2H
Etc...
Use your favorite entry method or simply watch for wicks forming when the price gets near the MESA adaptive moving average.
This is one of the few indicators that I've been using for years with success. Being able to plot both the current & higher timeframe MESA
can sometimes feel like cheating.
Due to the nature of the recursive calculation, you may notice slight differences between this version of MESA and others that either
approximate higher timeframes with fewer samples or make use of the latest "Resolution" argument in Pinescript V4. Both of which are
fine, until you start looking at M5 charts while plotting the Daily MESA.
As always, happy trading!
** Currently supports
M 1,3,5,15,30,45
H 1,2,3,4
Day 1
Week 1
Month 1
Adaptive Relative StrengthAdaptive Relative Strength shows a line of relative strength with a moving period in relative to Nifty 500 for Indian Market,
by default its 45 days but you can change as per your need or change relative symbol as per your need.

RDX ScoreModified TradingView script for @bankniftydoctor's RDX strategy. Original script idea credits to @TheProfessorDev
- I have modified the code to reflect core RDX strategy score, instead of the simplified one
- Every bar (including ones in RSI 45-55) will display its RDX score.
p.s .For the uninitiated, these number generated by this script are used for the RDX strategy devised by @bankniftydoctor. There's an anchored note at the upper right corner, which briefly summarises the RDX score & the positions to be taken accordingly.

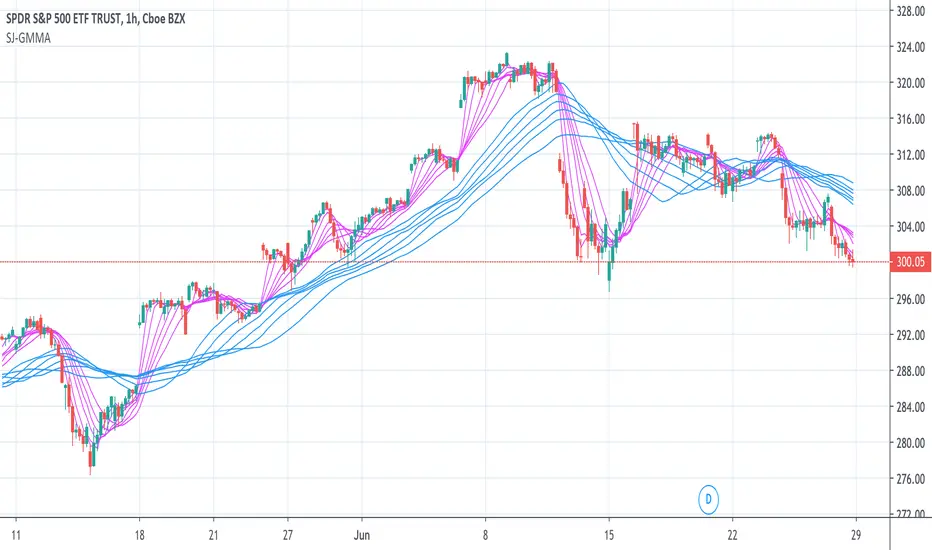
JSun - Guppy Multiple Moving AverAgeThe Guppy Multiple Moving Average (GMMA) is a technical indicator that identifies changing trends, breakouts, and trading opportunities in the price of an asset by combining two groups of moving averages (MA) with different time periods. There is a short-term group of MAs, and a long-term group of MA. Both contain six MAs, for a total of 12. The term gets its name from Daryl Guppy, an Australian trader who is credited with its development.
Key Takeaways:
1. The Gruppy Multiple Moving Average (GMMA) is applied as an overlay on the price chart of an asset.
2. The short-term MAs are typically set at 3, 5, 8, 10, 12, and 15 periods. The longer-term MAs are typically set at 30, 35, 40, 45, 50, and 60.
3. When the short-term group of averages moves above the longer-term group, it indicates a price uptrend in the asset could be emerging.
4. When the short-term group falls below the longer-term group of MAs, a price downtrend in the asset could be starting.
5. When there is lots of separation between the MAs, this helps confirm the price trend in the current direction.
6. If both groups become compressed with each other, or crisscross, it indicates the price has paused and a price trend reversal is possible.
7. Traders often trade in the direction the longer-term MA group is moving, and use the short-term group for trade signals to enter or exit.
Elder Impulse SnapshotNASDAQ:AMZN
I've always been intrigued by the Elder Impulse System but found it labour intensive with its flipping back and forth between daily and weekly charts. I also wasn't fond of the way it repainted the candlesticks. So I set out to build a version where you could get every trade signal filtered down in one chart and still see the real price action.
This article provides a decent overview of the original system: www.investopedia.com
Elder Impulse Snapshot uses two EMAs and two MACDs, one of each to process both the daily and weekly data. The daily data gets an EMA of 13 periods and the standard MACD settings. For the weekly info, the EMA is set to 65 periods and all the MACD values are also multiplied by five (60, 130, 45). Buy signals are generated when both EMAs and both MACD histograms are rising. When all four of these elements are falling, sell signals are generated. If any of the indicators disagree, no signal is generated and entering any trade is not advised.
The blue and red arrows are the buy and sell signals. From my reading, it appears Dr. Elder recommended exiting the trade as soon as the system no longer generated a signal, though the case could be made for taking partial profit and moving up your stop loss to ride the trend out longer provided you haven't been stopped out yet.

DARYL GUPPY'S MMA (MULTIPLE MOVING AVERAGES)This script plots 2 separate bundles of moving averages, consisting of 6 different MAs each, with the goal to avoid some false signal provided by individual MAs, and was designed by Daryl Guppy, an Australian trader.
The first bundle consists of 6 "fast" MAs (default width: 3, 5, 8, 10, 12, 15 periods) and is highlighted in blue. The second consists of 6 "slow" MAs (default width: 30, 35, 40, 45, 50, 60 periods) and is highlighted in orange. However I made it possible to modify the width for each MA. The original Daryl Guppy's MMA is made of EMAs, however this script also includes the possibility to plot SMAs instead.
From an operational point of view, those bundles act like individual MAs. So the trader should watch for crosses, convergences and divergencies between the 2 bundles and between the individual averages.

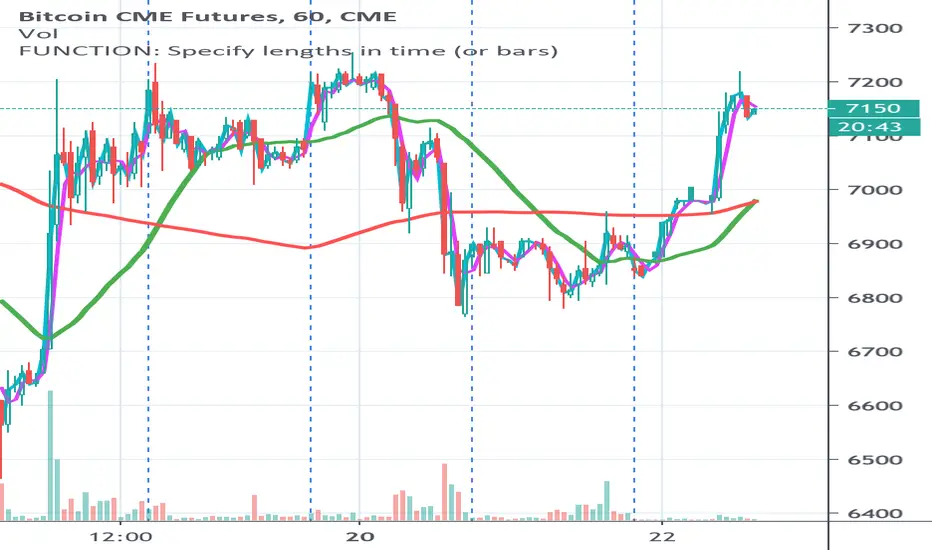
FUNCTION: Specify lengths in time (or bars) This is a function to give measures in time rather than bars...
I often want to measure in things in time rather than bars and change the sample rate (the candle size)
without reconfiguring my settings. This is a handy function for setting you input lengths in time units
(or bars when you want that)
For example
I want a 3 hour moving average, regardless of whether I have 5 minute candles or 30 min candles...
I want a 200 day moving average, regardless of whether I have 1 day or 1 week candles...
This is designed for you to put in your own scripts for your own purpose, but you can use this as is for time constant moving averages
or as an indicator on an indicator.
This shows the same moving averages 45 min / 3 hours in aqua / fuchsia and 1 day / 1 week in red / green
First row: On an extended session chart with 10m, 30m and 60m candles (all of them use the same settings (day length is 16 hours) everything else default.
Second row: On a standard session chart with 10m, 30m and 60m candles (all of them use the same settings everything else default.
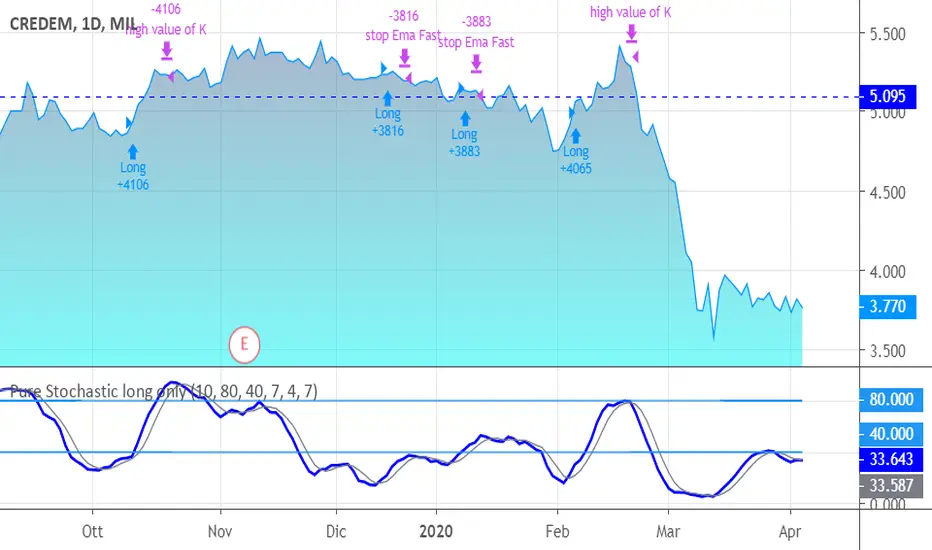
Pure Stochastic long onlyJust a stochastic for giving you a smart and quick signals of entering and exiting.
Your enter is K>D in the low band and close > last bar's high.
An Ema has been added for targeting and stops.
You exit also in case of high values of K or in case D crosses over K but in the "upper".
Length, periods and level of bands are personalized.
The system goes long only, because it fits at best for shares only; I leave you the attemp of writing code for other classes and for going short, in particular.
SUGGESTIONS:
Keep Oversold period high (> 20, also 40-45)
Keep Emaperiodfast higher (> 5)
Stochastic Pop and Drop by Jake Bernstein v1 [Bitduke]I found a simple strategy by Jake Bernstein, modified it a little and created a strategy with Risk Management System (SL+TP); After that I test it on the different cryptocurrency pairs.
About the Indicator
Basically it's the strategy of 2 indicators: Stochastic Oscillator to define the bias and Average Directional Index to confirm it.
One again, It uses Stochastic Oscillator to define the trading bias. In particular, the trading bias was deemed bullish when the weekly 14-period Stochastic Oscillator was above some default value (in him paper - 50) and rising and vice versa.
Once the trading bias is established, Steckler used the Average Directional Index (ADX) to define a slowdown in the trend. ADX measures the strength of the trend and a move below 20 signals a weak trend.
Modifications
I didn't implement Average Directional Index (ADX) and test just different sources for data, oscillator periods and different levels in relation to the crypto market.
So, it shows good results with two tight thresholds at 55 and 45 level.
The bar chart below the defining the bullish and bearish periods (green and red) and gives a signal to enter the trade (purple bars).
Backtesting
Backtested on XBTUSD , BTCPERP (FTX) pairs. You may notice it shows good results on 3h timeframe.
Relatively low drawdown
~ 10% (from 2019 to date) FTX
~ 22% (4 years from 2016) Bitmex
I backtested on the different altcoin pairs as well, but the results were just not good.
Relatively good results were shown by some index pairs from the FTX exchange ( FTX:SHITPERP ), but I think there is a few data for backtesting to be asure in them.
Bitmex 3h (2017 - 2020) :
i.imgur.com
FTX 3h (2019 - 2020):
i.imgur.com
Possible Improvements
- Regarding trading algorithm it would be good to check with strategy with ADX somehow. Maybe for the better entries
- As for Risk Management system, it can be improved by adding trailing stop to the strategy.
Link: school.stockcharts.com

Nasimarus EMAHey,guys! I have a gift for you. It's Nasimarus EMA. If you use this, you can check 200,100,45,9 EMAs.

ANN BTC MTF CM Sling Shot SystemHi all, this script was created as a result of ANN training in all time frames of bitcoin data.
Trained data is built on Chris Moody's Sling Shot system.
CM Sling Shot System :
This system automatically generates the ANN output for all time periods.
Therefore, it has multi-time-frame feature.
Artificial Neural Networks training details:
Average Errors
1 minute = 0.005570
3 minutes = 0.006674
5 minutes = 0.007067
15 minutes = 0.010000
30 minutes = 0.009398
45 minutes = 0.010000
1 Hour = 0.006848
2 Hours = 0.006901
3 Hours = 0.009608
4 Hours = 0.009774
1 Day = 0.010000
1 Week = 0.010000
The results look good (All Average Error <= 0.01 ), the Sling Shot Method is also good, but you can also refer to historically slower period averages to filter these arrows a bit more. I leave the decision to you.
Best regards.

(JS)DMI BarsAlright - so this is my own version of John Carter's "10x Bars"... I have done multiple things that are different from his version so they are slightly different..
So first of all the main indicator is based off of the ADX and the DMI;
For those who aren't familiar with it, Directional Movement is what you'd pull up under "built-in's" from the indicators tab (if you want to check it out).
The standard interpretation of this however, is when the ADX is above 20 that suggests the trend is strong, whereas under 20 suggests it is weak.
Also, when the D+ is above the D- that suggests a bullish trend, and D- above D+ suggests a bearish trend.
These bars take away the need to have it at the bottom of your screen, and places the data on the bars on your chart instead.
=========================================================================================================================================
So here's what the colors stand for -
Yellow - The ADX is under 20, no strength in trend
Shades of green occur when the ADX is above 20 and there's a bullish trend (D+ higher than D-)
Bright Green (Lime) - Bullish trend, D+ above 30
Green - Bullish Trend
Yellow Green - Bullish trend, D+ below 15
Shades of red occur when the ADX is above 20 and there's a bearish trend (D- higher than D+)
Bright Red - Bearish trend, D- above 30
Red - Bearish Trend
Orange - Bearish trend, D- below 15
=========================================================================================================================================
I have also added multiple time frame labels (label script used is the one created by Ricardo Santos)
These labels are color coded the same as the bars/candles, and they appear off to the right of your screen using every built in time increment from TradingView.
The purpose is to show you in real time, and on any chart resolution, what the current trend is on every individual time frame.
So using just one single chart you'll see your current resolutions candles, but also on the labels you'll see:
1 Minute
3 Minute
5 Minute
15 Minute
30 Minute
45 Minute
1 Hour
2 Hour
3 Hour
4 Hour
Daily
Weekly
Monthly
There is an input I added that allows you to adjust where your labels appear on the side of your screen as well!
=========================================================================================================================================
Now onto the volume spike portion of the indicator. This will plot a blue dot under each bar that has a spike in volume which meets your specified criteria.
I have 500% as the default setting.
What that means is that this indicator looks back and gets the 50 bar volume average and then applies dots where volume is 500% above average.
=========================================================================================================================================
Now finally, the reversal arrows. This is another simple to understand concept that I first read in John Carter's book "Mastering the Trade" that he calls "HOLP/LOHP".
I have added the ability to change the look back period you'd like the indicator to watch for highs and lows on.
What that stands for is 'High of Low Period' and 'Low of High Period', and it is used like this-
Whenever a bar makes a new high the indicator watches the low on that highest bar. Then when a bar afterwards makes a lower low then the one on the high bar,
a reversal arrow is given. Apply this same concept in the other direction in for the highs on the lowest bars.
=========================================================================================================================================
Now, I didn't want to make a "set" or have a bunch of different indicators out there that are all intended for the same package, so I took the time to put them together,
and if there's a part of it you don't care for they can easily be turned off in the settings.
Enjoy!

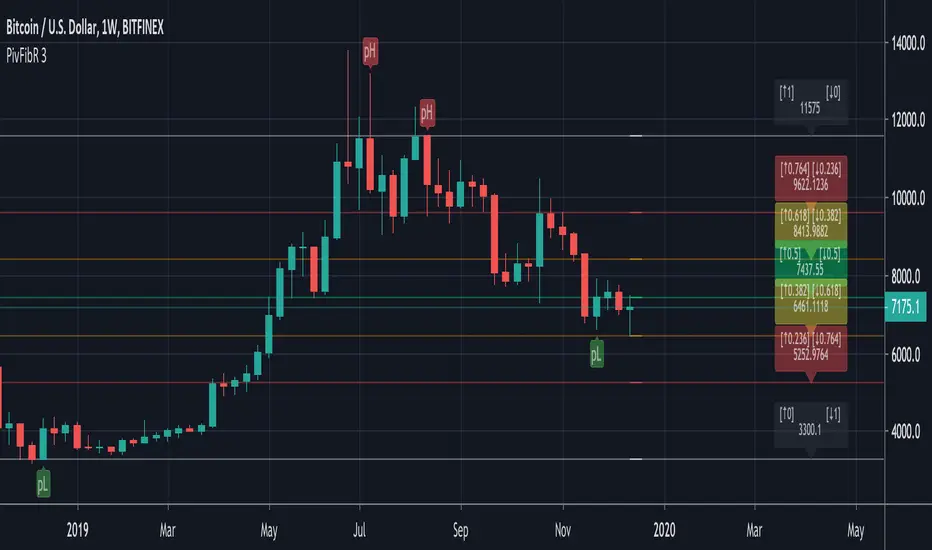
Pivots Fibonacci RetracementThis is a Fibonacci Retracement indicator based on Pivots.
The Fibonacci lines are always drawn between the LAST High Pivot (Red Triangle Down) and the LAST Low Pivot (Green Triangle Up)
Every time a new High or Low Pivot is found, the Fibonacci lines changes.
"RightBars" & "LeftBars" from Pivots are kept the same > "Bars"
In this example (BTCUSDT) the "Bars" are set as 10 (= period "Left" & "Right" where "Highs" & "Lows" are found):
This is the bigger picture:
If the settings are changed, for example "Bars" > 30, the Fibonacci lines are placed on different points:
If we need to take the previous "Low" Pivot ("Bars" > 45):
You see you need to change the "Bars" a bit to get what you want.
The extended Fibonacci levels (1.618 & 2) and (-0.618 & -1) are also included,
these can be used for future "Target-lines":
IF there is a NEW Pivot ("High" or "Low") which is visible because the Fibonacci lines HAVEN'T passed the "Red Triangle Down" or "Green Triangle Up" YET,
please WAIT until the close of that period, otherwise the "Triangle" possibly could still disappear again.
The dashed coloured lines and coloured Fibonacci numbers at the right are for easier readings and interpretation.
ANN MACD : 25 IN 1 SCRIPTIn this script, I tried to fit deep learning series to 1 command system up to the maximum point.
After selecting the ticker, select the instrument from the menu and the system will automatically turn on the appropriate ann system.
Listed instruments with alternative tickers and error rates:
WTI : West Texas Intermediate (WTICOUSD , USOIL , CL1! ) Average error : 0.007593
BRENT : Brent Crude Oil (BCOUSD , UKOIL , BB1! ) Average error : 0.006591
GOLD : XAUUSD , GOLD , GC1! Average error : 0.012767
SP500 : S&P 500 Index (SPX500USD , SP1!) Average error : 0.011650
EURUSD : Eurodollar (EURUSD , 6E1! , FCEU1!) Average error : 0.005500
ETHUSD : Ethereum (ETHUSD , ETHUSDT ) Average error : 0.009378
BTCUSD : Bitcoin (BTCUSD , BTCUSDT , XBTUSD , BTC1!) Average error : 0.01050
GBPUSD : British Pound (GBPUSD,6B1! , GBP1!) Average error : 0.009999
USDJPY : US Dollar / Japanese Yen (USDJPY , FCUY1!) Average error : 0.009198
USDCHF : US Dollar / Swiss Franc (USDCHF , FCUF1! ) Average error : 0.009999
USDCAD : Us Dollar / Canadian Dollar (USDCAD) Average error : 0.012162
SOYBNUSD : Soybean (SOYBNUSD , ZS1!) Average error : 0.010000
CORNUSD : Corn (ZC1! ) Average error : 0.007574
NATGASUSD : Natural Gas (NATGASUSD , NG1!) Average error : 0.010000
SUGARUSD : Sugar (SUGARUSD , SB1! ) Average error : 0.011081
WHEATUSD : Wheat (WHEATUSD , ZW1!) Average error : 0.009980
XPTUSD : Platinum (XPTUSD , PL1! ) Average error : 0.009964
XU030 : Borsa Istanbul 30 Futures ( XU030 , XU030D1! ) Average error : 0.010727
VIX : S & P 500 Volatility Index (VX1! , VIX ) Average error : 0.009999
YM : E - Mini Dow Futures (YM1! ) Average error : 0.010819
ES : S&P 500 E-Mini Futures (ES1! ) Average error : 0.010709
GAZP : Gazprom Futures (GAZP , GZ1! ) Average error : 0.008442
SSE : Shangai Stock Exchange Composite (Index ) ( 000001 ) Average error : 0.011287
XRPUSD : Ripple (XRPUSD , XRPUSDT ) Average error : 0.009803
Note 1 : Australian Dollar (AUDUSD , AUD1! , FCAU1! ) : Instrument has been removed because it has an average error rate of over 0.13.
The average error rate is 0.1850.
I didn't delete it from the menu just because there was so much request,
You can use.
Note 2 : Friends have too many requests, it took me a week in total and 1 other script that I'll share in 2 days.
Reaching these error rates is a very difficult task, and when I keep at a low learning rate, they are trained for a very long time.
If I don't see the error rate at an average low, I increase the layers and go back into a longer process.
It takes me 45 minutes per instrument to command artificial neural networks, so I'll release one more open source, and then we'll be laying 70-80 percent of the world trade volume with artificial neural networks.
Note 3 :
I would like to thank wroclai for helping me with this script.
This script is subject to MIT License on behalf of both of us.
You can review my original idea scripts from my Github page.
You can use it free but if you are going to modify it, just quote this script .
I hope it will help everyone, after 1-2 days I will share another ann script that I think is of the same importance as this, stay tuned.
Regards , Noldo .
