OPEN-SOURCE SCRIPT
Güncellendi Pivots Fibonacci Retracement
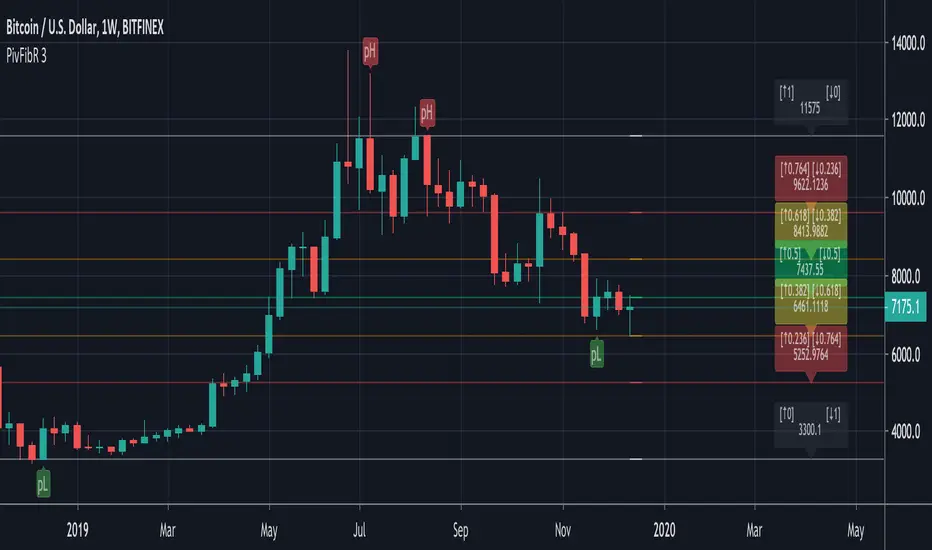
This is a Fibonacci Retracement indicator based on Pivots.
The Fibonacci lines are always drawn between the LAST High Pivot (Red Triangle Down) and the LAST Low Pivot (Green Triangle Up)
Every time a new High or Low Pivot is found, the Fibonacci lines changes.
"RightBars" & "LeftBars" from Pivots are kept the same > "Bars"
In this example (BTCUSDT) the "Bars" are set as 10 (= period "Left" & "Right" where "Highs" & "Lows" are found):

This is the bigger picture:

If the settings are changed, for example "Bars" > 30, the Fibonacci lines are placed on different points:

If we need to take the previous "Low" Pivot ("Bars" > 45):

You see you need to change the "Bars" a bit to get what you want.
The extended Fibonacci levels (1.618 & 2) and (-0.618 & -1) are also included,
these can be used for future "Target-lines":

IF there is a NEW Pivot ("High" or "Low") which is visible because the Fibonacci lines HAVEN'T passed the "Red Triangle Down" or "Green Triangle Up" YET,
please WAIT until the close of that period, otherwise the "Triangle" possibly could still disappear again.

The dashed coloured lines and coloured Fibonacci numbers at the right are for easier readings and interpretation.
The Fibonacci lines are always drawn between the LAST High Pivot (Red Triangle Down) and the LAST Low Pivot (Green Triangle Up)
Every time a new High or Low Pivot is found, the Fibonacci lines changes.
"RightBars" & "LeftBars" from Pivots are kept the same > "Bars"
In this example (BTCUSDT) the "Bars" are set as 10 (= period "Left" & "Right" where "Highs" & "Lows" are found):
This is the bigger picture:
If the settings are changed, for example "Bars" > 30, the Fibonacci lines are placed on different points:
If we need to take the previous "Low" Pivot ("Bars" > 45):
You see you need to change the "Bars" a bit to get what you want.
The extended Fibonacci levels (1.618 & 2) and (-0.618 & -1) are also included,
these can be used for future "Target-lines":
IF there is a NEW Pivot ("High" or "Low") which is visible because the Fibonacci lines HAVEN'T passed the "Red Triangle Down" or "Green Triangle Up" YET,
please WAIT until the close of that period, otherwise the "Triangle" possibly could still disappear again.
The dashed coloured lines and coloured Fibonacci numbers at the right are for easier readings and interpretation.
Sürüm Notları
Just changed the TEXT of the Fibonacci lines so ALERTS are much more easier set (just look at the "numbers" now)Sürüm Notları
First of all, a "Resolution" script is added > Settings > Inputs > "Resolution ON/OFF"- When ON, you can choose the Resolution/ Time-frame (1', 3', 5', 15', 30', 60', 120', 180', 240', D, W, M)
so you can see the W data while looking at a 1h chart for example.
- When OFF, the values are of presently used Time-frame.
For example > BTC/USDT "D" (Day), "Resolution" OFF
And here > BTC/USDT "D" (Day), "Resolution" ON > "M" (Month)
The lines at the right are adjusted, they can be removed (Settings > Inputs > "Show Last" = OFF, "Show All" = ON):
Otherwise the Fib lines can be disabled as well, only leaving the lines at the right visible (Settings > Inputs > "Show Last" = ON, "Show All" = OFF),
here the last 5 values (= adjustable > Settings > Inputs > "Show Last - Period", defval=5) are shown (offset=0 in this case):
Here with the last 10 values:
Here with the last 20 values:
The Offset is also adjustable, here the last 10 values are shown with an offset of 10
(since the calculation was with 10 (Right & Left)Bars):
And here the offset is 0, shifting the lines to the present candles,
so a better interpretation can be made:
Be aware, shifting these last lines (to the right) could possible cause wrong conclusions,
if the offset is the same as the "Bars" period, it is correct,
if the offset is less then the "Bars" period, those lines are not calculated for these latest bars
and should only be used as a visibility - interpretation aid!
Thank you!
Sürüm Notları
Created 2 Alerts - Pivot High Alert
- Pivot Low Alert
Now you can just choose:
"Condition" > "PivFibR" > "Pivot High Alert" or "Pivot Low Alert"
Sürüm Notları
I've seen that some like to put their Fibonacci lines on the highest/lowest candles WITHOUT the WICK,hence I added this extra feature, hope you like it!
- when "'NO WICK' [ON = high/low WITHOUT WICK] [OFF = high/low]"
= ON > as you might have guessed :-) > Calculations ignores the wick
= OFF > calculations made with the highest/lowest (wick) prices
Sürüm Notları
Hi!Thanks to the help of “JJosuke” I have a better understanding what is seen as “repainting”
Although there is NO repainting, I understand now it is very easy to see this as repainting.
I’m going to explain further how this script works, and hope this will help!
Every “Bar” will compare itself against “Bars” at the “Left” and at the “Right”. Why?
Because it needs to be sure it is the “Highest” or “Lowest” in its “terratorium”.
Let’s say every new “Bar” will compare itself against 10 “Bars” at the “Left” (= ”LeftBars”) and 10 “Bars” at the “Right” (=”RightBars”).
Normally at the “Left” there are more than enough “Bars” to compare with (= history),
so every “Bar” can instantly see if it is the “Highest” or “Lowest” of them all! IF this “Bar” is the “Highest” or “Lowest” compared to the “Left” side, it still needs to be compared against the 10 “Bars” at the “Right”! BUT immediately at the “Right” (= future) of this NEW “Bar” there are no 10 “Bars”, now every “Bar” needs to WAIT until there are 10 “Bars” to compare with. Only then, IF this “Bar” still is the “Highest” or “Lowest” compared to the “Left” AND “Right” side, this “Bar” is sure it is the “Highest” or “Lowest” of them all, and ONLY THEN it may produce THE SIGNAL.
During “Bar Replay” or “live”, this is why the signal will be plotted only after 10 “Bars” has appeared after the spoken “Bar”…
Really hope this helps!
Now, why not use less “Bars” at the “Right”, so the signal will appear more quickly?
Well, if this period is too short, for instance only 1 or 2 “Bars”, you’ll get way too many signals. Especially when you do this with the first settings, where the amount of “LeftBars” and “RightBars” always were the same, so in this case 1 or 2 “Bars” at the “Left” and at the “Right”. The “Terratorium” is way too small and signals will pop way too much.
"2 Bars":
The Fibonacci lines will be all over the place.
"1 Bar":
In this new update I tried to fix this, you now can adjust each side separately.
In the default settings I’ve kept the “RightBar” (= future) side short, 3 “Bars” and at the “LeftBar” (= history) side longer, 17 “Bars”, in total 20 “Bars” (“large” enough “Territorium”).
If you like the previous settings, where the amount of “RightBars” equals the ”LeftBars” you can enable the "[xLeftBars = xRightBars] > Only change 'LeftBars'" button.
Then you only have to adjust the amount of “LeftBars” and the amount of “RightBars” automatically will be the same.
Of course, change every setting as you like.
I do suggest:
- about 3-5 "RightBars" and 15-17 "Leftbars"
or
- about 10 "RightBars" & 10 "LeftBars"
I also changed the “labels” of the “Pivot” “High” and “Low” since the "Triangle Up/ Down" are easily seen as “go Long” or “go Short” signals, which isn’t the primary function.
The primary function is only to show where the “Highest” and “Lowest” points are in an area, so you can see where the Fibonacci lines came from, it makes it easier to adjust the “Bars” period and get the Fibonacci lines you want (from 'this' or 'that' “Pivot High/Low").
Sürüm Notları
Latest update (2019/12/02):Added the "most recent occurence pH" and "most recent occurence pL" > Default = '0' (= takes values of "most recent occurence")
It is an easy way to use previous Pivot points, for instance:
You want to see the Fibonacci lines between the most recent "Pivot low" (pL) and the "Pivot high" (pH) 2 "highs" earlier
Then you leave the "most recent occurence pL" at '0' (= most recent occurence of "Pivot low" (pL))
But you change the "most recent occurence pH" from '0' to '2', then you'll see the Fib lines between these 2 points at the right side of the chart and that's it! ;-)
Standard:
Adjusted:
Sürüm Notları
Latest Update: 2019 Dec 8- Every Fibonacci level is now adjustable, each with its symmetrical counter level,
for example changing [↑0.618] to [↑0.786] will automatically change its counter level [↑0.382] to [↑0.214]
Changing [↑1] will also change [↑0], [↑0.764] will also change [↑0.236], [↑0.618] will also change [↑0.382],
the same with the 2 Fib Extensions levels, [↑1.618] changes [↓1.618] and [↑2] changes [↓2]
- Easier interpretation: for example, instead of just "0.618" visible at the right it is now [↑0.382][↓0.618]
If there is a new pL (Lowest Pivot Point) the retracement goes UP, then look only for the "↑ numbers", for example [↑0.382] = 38.2 retracement from Bottom to Top.
The same for a new pH (Highest), retracement goes DOWN, look only for the "↓ numbers", for example [↓0.618] = 61.8% retracement from Top to Bottom.
When the levels are changed, the label numbers will change as well
- The labels at the right can be moved by the "Fib labels offset" setting
Sürüm Notları
Now you can choose a custom "High" - "Low" Pivot pointFor example "WAN" (3D), there is not yet a pivot High:
Now you can add it, just enable "Custom 'High'" and fill in, for example here "High" = '0.500000 BTC'
The same with the "Custom 'Low':
You can combine as well, for example a Custom High with an existing pL,
Cheers!
Sürüm Notları
- Latest Fib Line price is now placed in Labels- Size Labels can now be adjusted
Sürüm Notları
Thank you!Sürüm Notları
Added Darkmode:Darkmode ON:
Darkmode OFF:
Sürüm Notları
It is now possible to show just straight Fib lines ("Show 2" & "Show 3" need to be enabled, see bottom of settings), is set as default.Here used without "wick":
Açık kaynak kodlu komut dosyası
Gerçek TradingView ruhuna uygun olarak, bu komut dosyasının oluşturucusu bunu açık kaynaklı hale getirmiştir, böylece yatırımcılar betiğin işlevselliğini inceleyip doğrulayabilir. Yazara saygı! Ücretsiz olarak kullanabilirsiniz, ancak kodu yeniden yayınlamanın Site Kurallarımıza tabi olduğunu unutmayın.
Who are PineCoders?
tradingview.com/chart/SSP/yW5eOqtm-Who-are-PineCoders/
TG Pine Script® Q&A: t.me/PineCodersQA
- We cannot control our emotions,
but we can control our keyboard -
tradingview.com/chart/SSP/yW5eOqtm-Who-are-PineCoders/
TG Pine Script® Q&A: t.me/PineCodersQA
- We cannot control our emotions,
but we can control our keyboard -
Feragatname
Bilgiler ve yayınlar, TradingView tarafından sağlanan veya onaylanan finansal, yatırım, işlem veya diğer türden tavsiye veya tavsiyeler anlamına gelmez ve teşkil etmez. Kullanım Şartları'nda daha fazlasını okuyun.