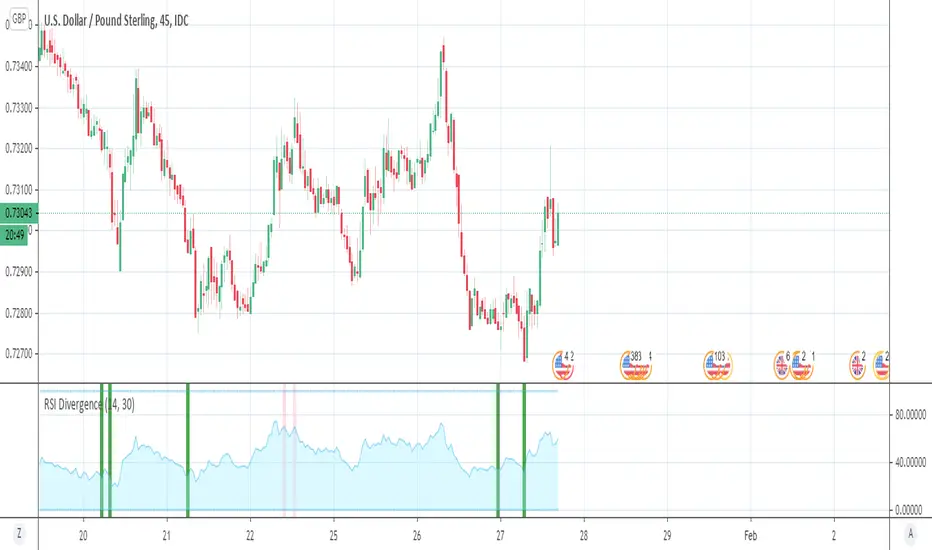
RSI Divergence (Pine v4)Summary
Script highlights the divergences in RSI worth taking notice of. By comparing current envionment to relative sample we can see more than
the standard divergences that many catch through analysis. This framework aims to remove the bias or noise many see when looking for any supporting
evidence to their given emotion on a market.
Step-by-Step Walkthrough
Calculates RSI
Sets Divergence Framework
-------> a. Defining variable values, mandatory in Pine 4)
-------> b. Identify Divergences --> "If bar with lowest / highest is current bar, use it's value"
Compare high of current bar being examined with previous bar's high --> "If curr bar high is higher than the max bar high in the lookback window range"
Finds pivot point with at least 2 right candles with lower value
Finds pivot point with at least 2 right candles with lower value
Plot
Set Alerts
This RSI Script is intended for public use and can be shared / implemented as needed
Questions? I do not monitor my TradingView inbox. See email address in signature at the bottom of this page for contact information.
Rsidivergence

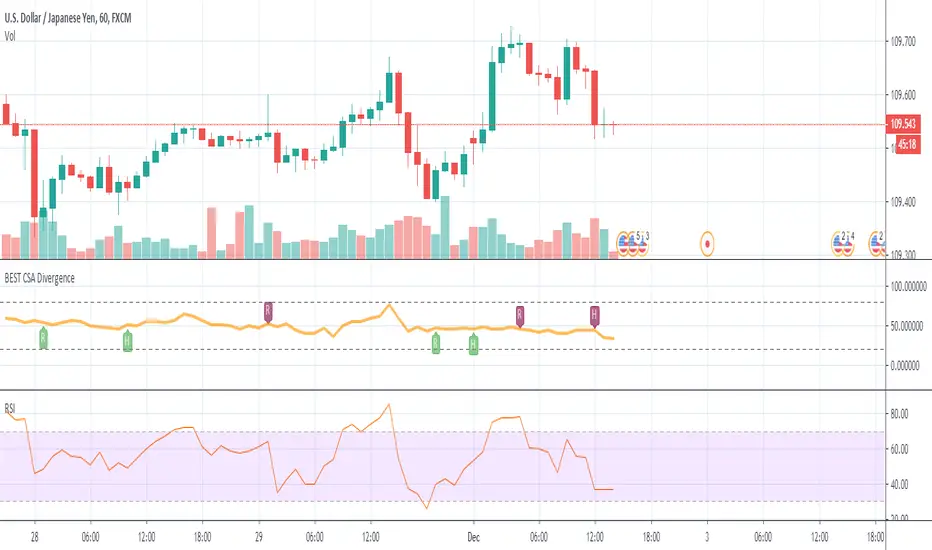
BEST Currency Strength Indicator DivergenceHello traders
Hope you had a great Thanksgiving
Now it's my turn to give and all I ask in return is you to be thankful (did I get the "Thanksgiving" thing right?)
The Currency Strength Indicator plots an average of the selected FX pairs in the indicator.
Someone asked me if I could develop an alternative of that script adding a divergence component.
The script evaluates the divergences between the average of the selected RSI(FOREX pairs) and the RSI(FOREX pair) displayed on the chart.
This version includes new features such as:
- the RSI length can now be selected
- we can select the 6 pairs used for the divergence calculations
All the BEST my aspiring traders and quants
See you tomorrow for another script
Dave
RSI w/ MAs & Divergences (Alert)This script fires off real-time RSI Divergence alerts.
To best use the RSI Divergence indicators, adjust the following settings accordingly.
• RSI Bullish Divergence Under: 20 – 45 (lower for larger volatility and more bearish markets)
• RSI Bearish Divergence Above: 55 – 80 (higher for larger volatility and more bullish markets)
Key Notes:
1. Set "Once Per Bar" instead of "Once Per Bar Close" alert.
The strategy already uses prior bar close (instead of current bar close) for calculation. This ensures that the signals will stay as they are after fired off, even when the current bar price is still changing.
2. It's OKAY to see the "alert may trigger differently than expected" warning.
Reason why you are seeing this warning is because we used a function called valuewhen() in our strategy. This function does not look at the entire history of data and has several limitations. For instance, on a 30min resolution, at the end of 2018, the function will be able to find past occurrences of BTC exceeding 16k. However, the function won't be able to find such occurrences at the end of 2019. Since our strategy is only concerned with very recent events, these limitations will not impact our results or cause repainting. You can find out more about this in the TradingView Wiki .
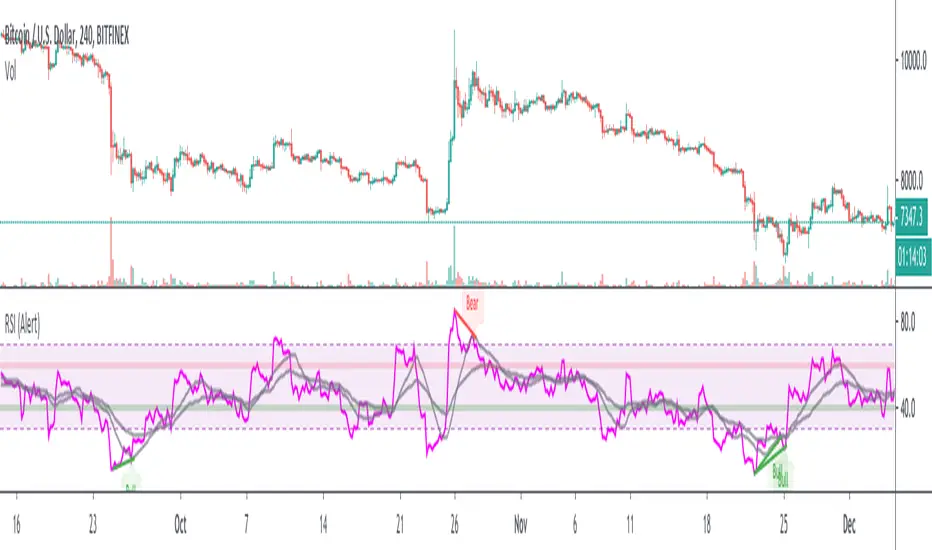
RSI w/ MAs & DivergencesTo best use the RSI Divergence indicators, adjust the following settings accordingly.
• RSI Bullish Divergence Under: 20 – 45 (lower for larger volatility and more bearish markets)
• RSI Bearish Divergence Above: 55 – 80 (higher for larger volatility and more bullish markets)
THIS SCRIPT DOES NOT REPAINT AND IS COMPLETELY FREE.

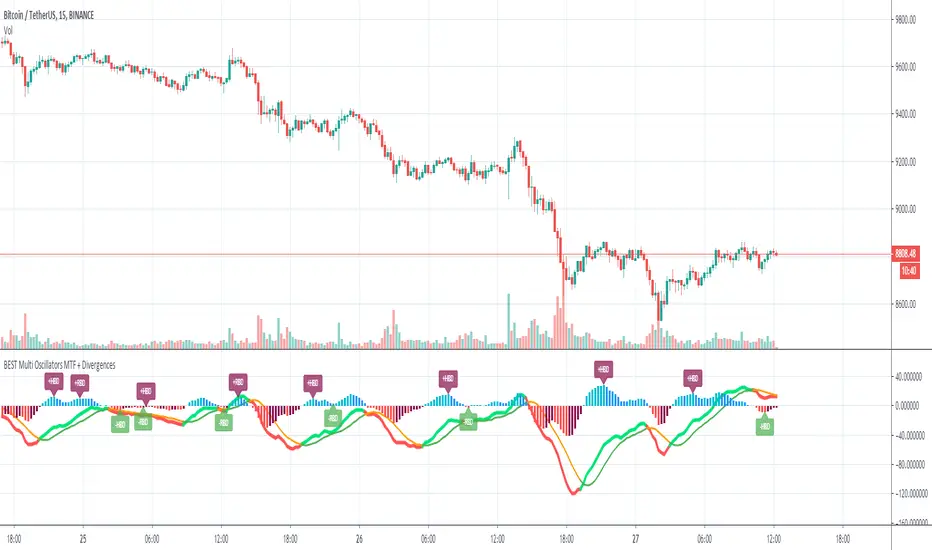
[ALL-IN-ONE] OSCILLATORS MTFHi everyone
I. 💎 SCRIPTS ACCESS 💎
1. My website URL is in this script signature at the very bottom (you'll have to scroll down a bit and going past the long description) and in my profile status available here : Daveatt
Due to the new scripts publishing house rules, I won't mention the URL here directly. As I value my partnership with TradingView very much, I prefer showing you the way for finding them :)
2. You obviously can contact me directly for more information
II. 🔎 ALL-IN-ONE OSCILLATORS MTF 🔎
This indicator offers to display many oscillators with a multi-timeframe option
The available oscillators so far are:
1. MACD
2. MACD ZERO LAG
3. RSI
4. DMI/ADX
5. ATR
6. STOCHASTIC RSI
7. TRUE STRENGTH INDEX
8. CHANDLE MOMENTUM OSCILLATOR
9. VORTEX INDICATOR
10. COMMODITY CHANNEL INDEX
11. RATE OF CHANGE
III - 📊 FEATURES 📊
3.1- 🔔 Alerts 🔔
LONG/SHORT alerts available for all oscillators.
You'll find only two events GoLong or GoShort because I simplified it a lot.
Let's assume the user wants to create alerts on a MACD first, and in a second time on an RSI.
All he/she has to do is :
1) to select the MACD parameter in the indicator and then activating the events GoLong and/or GoShort.
2) once done, select RSI filter in the indicator and then activate the events GoLong and/or GoShort.
3.2- 🔌&🕹️ (Plug and Play)
This feature is optional but very cool regardless.
Compatible with any of my Plug&Play trading tools.
You'll get instant results by connecting the ALL-IN-ONE to another Plug and Play compatible system.
Feel free to send a request my way if you want more details on that
3.3 - ⏱️ Use current chart resolution or any available timeframe
The Multi-timeframes component will expand your analytics capabilities even more.
IV - Use Cases
The use cases are maybe limitless
- an H4 oscillator combined with your indicator Plug&Play applied on an H1 chart.
- an RSI reversal signal used with your Backtest system.
- a 30-minutes True Strength Index plugged to a 5-minute indicator- itself combined into a Backtest system. #mind #blown
- ...
-------------------------------------------------------------------------------------------------------------------------------------
If you have any doubts or questions, please hit me up directly or ask in the comments section of this script.
I'll never claim I have the best trading methodology or indicators.
You only will judge and I'll appreciate all the questions and feedback you're sending my way.
They helped me a ton for developing indicators based on all the requests I received.
Kind regards,
Dave
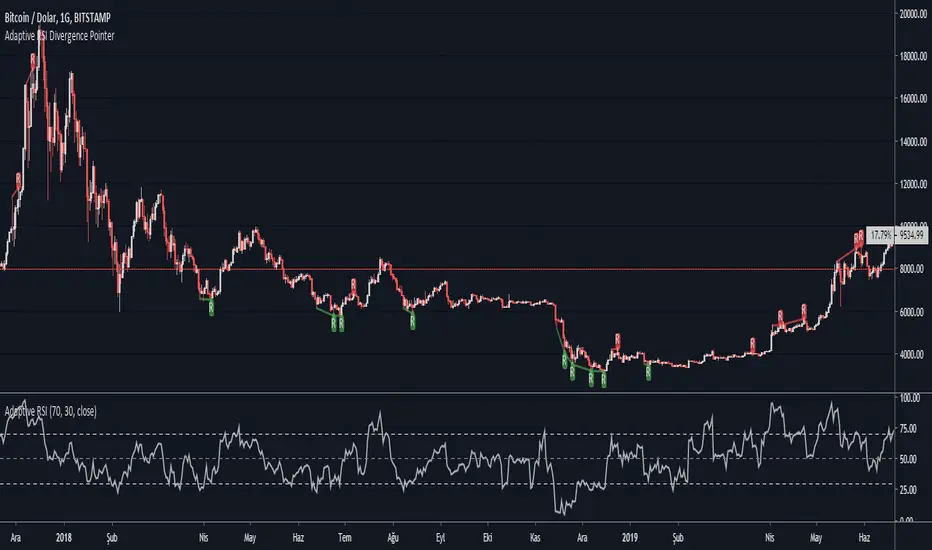
Adaptive RSI Divergence PointerThis script points regular and optionally hidden types of bullish and bearish Adaptive RSI divergences on the chart by drawing the divergence lines and optionally labels.
Hidden divergence is disabled by default, it can be enabled over settings window.
Regular divergence is enabled by default, it can be disabled over settings window.
There is an option to display the price channel additionally.
Added alerts for all types of divergences.
What is Adaptive RSI :
This is an implementation of John Ehlers’ Adaptive RSI , as described in his book Rocket Science for Traders: Digital Signal Processing Applications (2001-07-20).
It does not need a length value to be specified by user. It adopts itself perfectly to the price chart.
It integrates the idea of automatically determining the Dominant price cycle through a Homo-dyne Discriminator, and using half of a cycle length as the input for the RSI . Not only determines the most effective range for the RSI by setting it based on the cycle, but also makes the RSI PDF (Probability Distribution Function) adjustable as shown in John Ehler's papers.
Works just like a normal RSI , but should have less false signals.
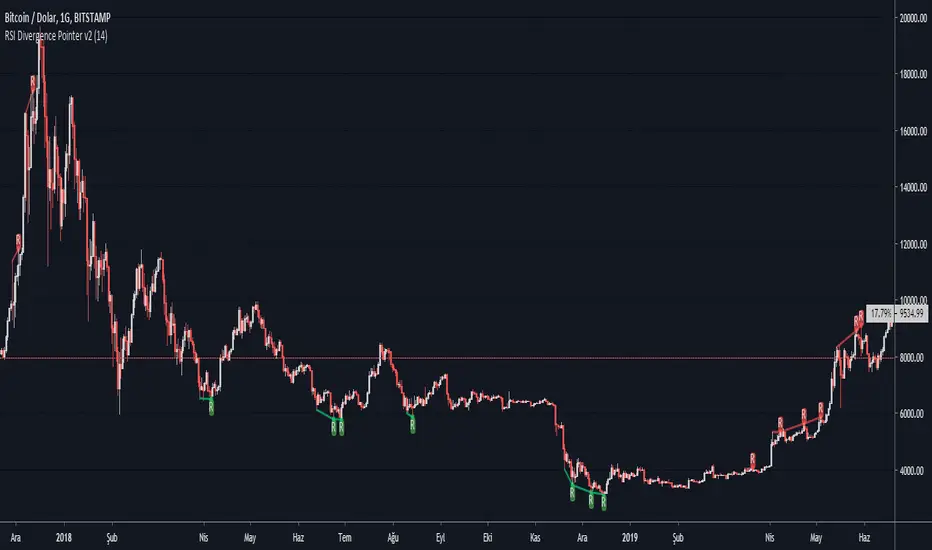
RSI Divergence Pointer v2This script points regular and optionally hidden types of bullish and bearish RSI divergences on the chart by drawing the divergence lines and optionally labels.
Hidden divergence is disabled by default, it can be enabled over settings window.
There is an option to display the price channel additionally.
Added alerts for 4 types of divergences
Titles and messages are the same:
"Regular Bearish Divergence"
"Regular Bullish Divergence"
"Hidden Bearish Divergence"
"Hidden Bullish Divergence"
Iconik Trading Suite: Divergence SeekerVisually displays divergences of almost a dozen indicators.
DM for a PowerPoint describing this indicator and the rest of Iconik in detail.
Iconik Trading Suite Indicator List:
ITS-OSC: Oscillators (v2)
ITS-PAA: Price Action Alerts (v2)
ITS-ASR: Auto Support/Resistance
-> Daily (v2)
-> 3 Day (v2)
-> Weekly (v2)
ITS-4TFC: 4 Time Frame Confirmation (v1)
ITS-DIV: Divergence Seeker (v1)

Liens Standar Rsi - Divergence Rsi Divergence
This script is signaling
Bearish Divergence
Bullish Divergence
Hidden Bearish Divergence
Hidden Bullish Divergence
Alerts for all conditions.
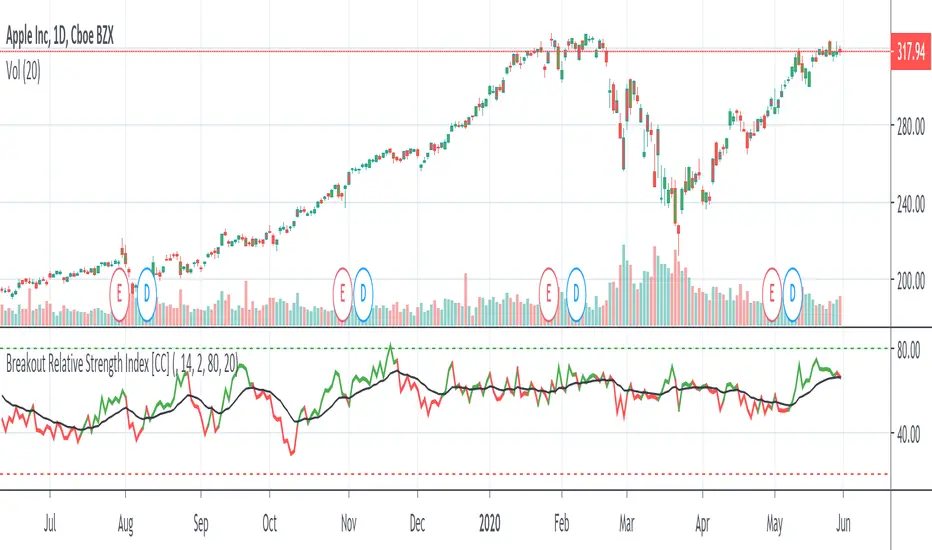
Breakout Relative Strength IndexIt isn't easy to determine if the price of a stock is about to break out. Here’s one way you can determine the relative strength of a breakout, enabling you to act early and realize higher profits.
This indicator was originally developed by Howard Wang Stocks & Commodities V. 33:09 (60–62)
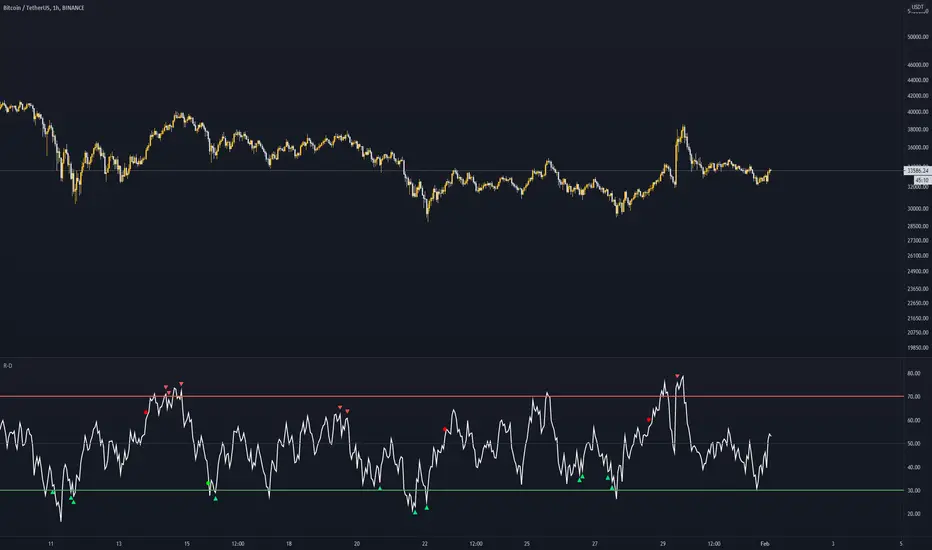
MG - Real time RSI divergenceShows RSI divergences in real time (as soon as bar closes in divergence instead of waiting for an RSI pivot).
There are alerts included on these events so you are immediately made aware of divergence.
Adjustement:
It works by detecting a break of a previous high or low and then comparing the RSI value at the last break to the current break. Therefore, by decreasing the adjacent candles required for a pivot, you increase the number of divergence checks and therefore divergence readings. As with many indicators, with higher the values, you get less but more significant signals. (This can be visualized with the plot pivot lines option)
RSI period can be adjusted

RSI Divergence with candle coloringHey there
This is a script requested by a friend
It's based on the RSI Divergence script from Ricardos Santos :
This version will color the candles instead of drawing an extra panel below the main chart
I set this script on Invite-only cause it's only for a friend to be used.
However, if interested, hit me up and I'll add you
Enjoy
Dave


(JS) Pivot Point RSILet me start by saying I really enjoyed putting this together - and also that it initially wasn't my idea, a friend of mine suggested it to me earlier today and I was intrigued by the concept.
So this is exactly what it sounds like - Pivot Points RSI.
I plan on adding the R4S4 and R5S5 in the future, though it only goes to 3 at the moment.
However I did include halfway points between existing pivots.
This RSI calculates prior closes + highs + lows based on the intraday (or week, or month, depending on chart resolution) indicator values, then takes that info and creates pivots on the RSI to plot potential RSI support and resistance. This is a pretty great concept and I plan on putting it to use in the future myself.
Includes 3 color schemes.

RSI DivergenceRSI Indicator with the following additions:
- highlighting the overbought/oversold conditions
- show divergences

RSI Divergence UltimateHere it is Everyone - What was once hidden is now revealed
This is the Ultimate RSI Divergence Indicator
Not only does it plot Regular and Hidden Divergence lines for an RSI smoothed by an EMA and for its Signal Line
The RSI can be set to change color with direction or can be set as single color with or with out OB / OS highlights
Color Changing RSI helps when trading Multiple Time Frames as you can look for confluence in the direction of RSI
Included options for the Signal Line include;
Various calculations EMA, SMA and Linear Regression which provides very accurate signal line crossover signals
Color Changing with direction
Second RSI with different Length
Multi Time Frame RSI
Bollinger Bands applied to the RSI
RSI Stochastic that has been compressed to fit into RSI OB / OS so that it doesnt compress the RSI when in these regions
There are also Background Highlights (thanks to Chris Moody) for when the RSI Stochastic moves into OB / OS and crosses its signal line
There are plenty of Alerts for signals with more complex alerts coming soon
I have also added Hima Reddy's Power Zones for support and resistance so now you can also
Take full advantage of trading; signal line crosses, 50 crosses and Power Zone RSI support and resistance and much more
The divergence script is thanks to @RicardoSantos, I've just adjusted it to suite my indicator
Remember that divergences work best when traded with the trend or very late in a trend when going against the trend

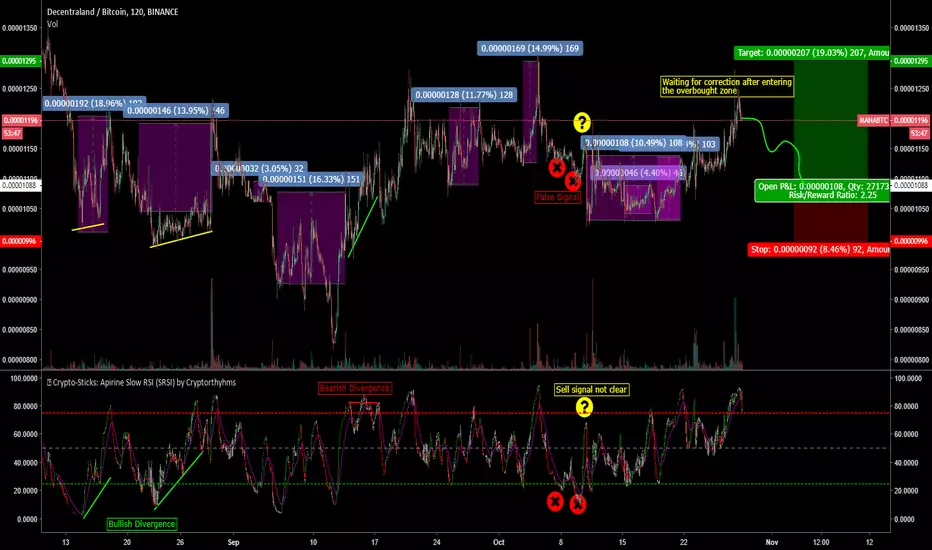
🥢 Crypto-Sticks: Apirine Slow RSI (SRSI) by Cryptorthyhms🥢 Crypto-Sticks™ Apirine Slow RSI (SRSI)
A new series of indicators brought to you by Cryptorthyhms...giving you an alternate look at your trusted favorites! Follow me, there are still 2 dozen Crypto-Sticks indicators planned - all will be released in public library.
🚀 Indicator Specific Info
🐻Thanks to Lazybear for posting the original Apirine RSI code I updated to create this indicator! (give that man a follow/thumbsup, hes a legend!)
New Crypto-Sticks option is an EMA of the average signal line output. Eventually I will go back and update the previous indicators with this feature as well!
⛔Please remember that you may have to adjust the overbought and oversold levels to suit the volatility of the instrument you are working with. In the future I will implement a feature that does this automatically, but for now its manual.
Heiken Ashi candles (default) adds some more clear trend changing points which can be executed at the second candle going in either direction. Other coins/charts will require their own strategy - you could potentially have to tweak that parameter. In this example you would enter on 2nd green, exit on 2nd red. HA Example:
Volume weighting the HA candles adds a different dimension to the indicator which I have to explore more fully.. In my opinion VW does not provide any benefit as is for this indicator. I left the option in for you though as YMMV. An example of VW+HA:
💭Please leave me any ideas or feedback you have!
🚫If you use volume weighting you should be on heiken candles.
🚀 Crypto-Sticks General Info
🚧This series isnt polished 100%, and I have some more options I will add in the future. But for now, I want to just release them, as I am not sure when I will have the time to put more work into them (many other big projects I am working on).
📊Its basically reinterpretations of all your favorite indicators. I calculate the values a little bit differently than normal, but the end result is creating a candlestick chart (for the indicator!). Then I added the option to plot them as Heiken Ashi candles to smooth out noise and make signaling easier. I recommend using the indicator on this setting.
🔊Lastly I implemented a Volume Weighting system for them all which simply integrates volume into the formulas for these indicators. For the most part this feature is experimental and doesn't provide huge utility (yet - I have other ways I want to try it as well - just no time). Though on some of the indicators it already shows great promise.
👍Enjoying this indicator or find it useful? Please give me a like and follow! There are many more indicators to be released in this series, not to mention I post crypto analysis and other free indicators regularly.
💬Questions? Comments? Want to get access to an entire suite of proven trading indicators? Come visit us on telegram and chat, or just soak up some knowledge. We make timely posts about the market, news, and strategy everyday. Our community isnt open only to subscribers - everyone is welcome to join.
RSI with Highlights and DivergencesThis script is an RSI replacement, useful especially for Day traders (15m or less) but can be used as a normal RSI by changing the settings to 14 / 70 / 30
Features:
- RSI with adjusted settings for lower time frames
- highlight when RSI and price diverge when RSI is at extremes
- highlight of the Overbought and Oversold conditions
- 50% line
- candle colors for Overbought and Oversold conditions


Merge Of RSI & Stochastic RSI [salar88]This Indicator Include Stochastic RSI And Multiple Time Frame RSI
I Wish Its gonna useful for tradingview users

Combined RSI and MA Alert Triggersrsi indicator whith conditional moving average settings for swing trading when market price is above certain moving averages
testing a simple for fun, not intended to be financial advise, do your own research :)
enjoy!
RSI DivergenceSimple RSI Divergence with adjustable lookback period.
Highlights bars with higher price but lower RSI (bearish) or lower price but higher RSI (bullish) than the highest/lowest points in the lookback period.