RSI simple Long ShortSimple indicator when RSI goes above 75 or below 25. It gives signal at next proper candle.
Rsibreakout

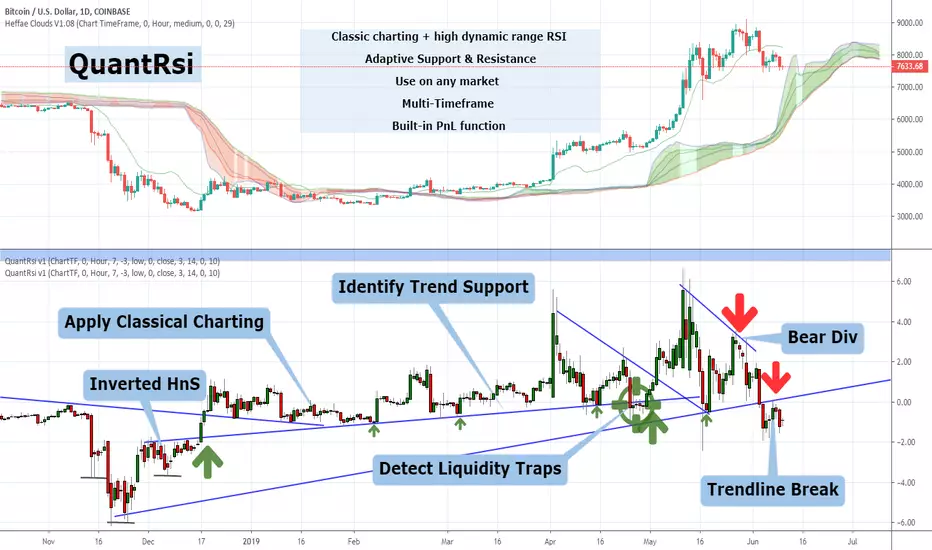
QuantRsi - Quantized Relative Strength Index - SNOW_CITY QuantRsi is a Relative Strength Indicator designed to improve on RSI's divergence confirmation. QuantRsi also functions as an entirely new type of range-bound oscillator, enabling "Hybrid TA" - the study and use of drawing tools on candles painted by the indicator.
QuantRsi paints full OHLC candles by default - displaying the full range of each candle's movement.
This tool sets out to accomplish:
Confirmation of divergence with a 3-anchor trading system
Show key price levels as whole numbers "quantized" from a scale of -10 to + 10; as well as commonly revisited levels within a trend
Anticipate divergence & turning points by charting on the indicator candles - trendlines can be drawn on indicator print - "Hybrid TA"
The result is an indicator able to process nonlinear price movements and draw range-bound candles with peaks and troughs that form repeating collisions with common tangents. QRsi illustrates trends and trend violations in a market with the advantage of behaving like a leading indicator. QRsi possesses a supreme ability to show divergence and confirm reversals/ turning points.
The dynamics of the vertical scale allows the formation of linear trends on the oscillator which classical charting can be applied. The support and resistance values for an asset will follow consistent incidents upon a tangent while the market is trending.
When a trend is violated, the break-up or break-down of price will revisit prior incidents both on frequented horizontal levels ("-1.4" or "+5.0") as well as tangent lines drawn from prior reversal points. Prior, violated trend-lines can be used as anchor points for a new linear trend - establishing a hypothetical market range before price moves into these hidden divergence zones.
Much like RSI, the extremes of a QRsi range (whether that be +/- 7,10 or the trend-established reversal value) are not always indicated turning points. Divergence does not occur at every turning point, but it does occur at most significant turning points.
Unlike RSI, QRsi adds the ability to visualize turning points outside divergence by drawing a trendline from prior turning points to the next anticipated turning point.
QRsi enables an asset to express it's price range within a flexible scale for that trend. The scaling has a higher dynamic range than classic RSI, at the expense of not filling the entire range of the oscillator at all times. An asset's highest and lowest trending values should be established by observation of prior visited values, not by the borders of the oscillator's range.
In the main chart example, trend-lines are drawn on the QuantRsi indicator for ETH/USD - Bitfinex 4H
Here is the same chart with notation:
The dashed trend-lines represent trends that have not been established yet. They turn solid when they have a second anchor(in primary chart).
Trendline violations create anchor points for new trendlines
Turning points with and without divergence depend entirely on asset's prior QRsi values, relative on relative.
In the above chart, Qrsi Value "2" is a common reversal value. In the chart period that is shown, selloff ensues shortly after QRsi reaches 2.
QRsi Values range from -10 to + 10. The boundaries represent the extremes of anticipated market range for that timeframe. Unlike traditional RSI, it is rare that an asset will range from the lowest to the highest boundaries. Instead, common values for that asset are observed by studying historical price data. A lower and upper range is established based on historical trends. When these values are hit, it represents an anchor for divergence. You will find that reversals can occur on the +/- 3, 5, 7 and 10 values frequently, although, this is indication without confirmation.
Depending on the timeframe and asset, the common turning point for an asset may be -2 & +5, with outliers to -5 & +7; or it may be -1.4 & +6.5 for an uptrending asset. The horizontal +/- QRsi values which turning points are likely to occur need to be established by studying the asset and verified by divergence or trend incident.
Confirmation is gained by observing the 3-anchor trading system:
1: Divergence - Locally
2: Trend incident or violation - charted patterns, linear ascending or descending trendlines.
3: Horizontal value incident
In the chart below, common horizontal turning points, divergence, and trendline violation are used as indicators for trading.
Observe how the same horizontal levels are visited as support and resistance depending on the direction of the trend prior to visiting that level.
Note how there are 2 coincidences of Trend / Horizontal / Divergence for most of the indicated trades:
This is the same chart, but with trades shown on the price chart as well as the QRsi chart:
And a simplified view of the same chart with Heffae Clouds enabled:
Notice how once a horizontal level is violated, it is often revisited which confirms it's role-change from S to R or R to S.
Weekly chart showing horizontal support level on lows, and divs for 4 prior All-Time-High's
Example of drawing a trend-line on QRsi and setting up a trade based off of a trend incident:
In the above example, the first two incidents are used as anchor points to reference where the third incident might occur.
In this case, you would have all 3 anchors, and a very successful trade with conformation of a proper entry prior to taking the trade.
Example of using a trend-line to set up trade continuation after divergence prints:
Example of how horizontal levels or ranges can be revisited after much time has passed. This also displays how divergences are used with horizontal levels to establish confidence in a trade:
Example of how QRsi values establish future support / resistance value ranges. Candle-wick sets future lower range:
Example of horizontal levels and divergence:
And, a drawing-free chart of QRsi with Heffae Clouds on BTCUSD Dec 2017 - Nov 2018 - Imagine your own TA on the QRsi.
SETTINGS:
TimeFrame settings:
"ChartTF" follows your chart's selected resolution / TimeFrame
"Non-Chart TimeFrame" is an integer for your custom TimeFrame, the setting below:
"Non-Chart TimeFrame" selects "Minutes, Hours, Days" that corresponds to the above setting for a custom TimeFrame.
Visual Settings:
"Show QuantRSI As Candles" - Toggle this to change from candlesticks to a simplified line. The line's value is determined by "Input for Stochastic" below
"Show Stoch QRSI" - Toggle this to switch to a Stochastic Rsi based off of the QRsi.
"Show Price Per 1.0" - Toggle this to see the range value, in chart denomination (USD,GBP,BTC,JPY) for each 1.0 step in the QRsi range for that timeframe. See this example:
The Quantization range values can be displayed by checking the box in settings "Show value per 1.0"
This will paint a colorless line and display the price value in the indicator's data window. You can calculate the rough price difference to any local value in QRsi by multiplying "value per 1.0" by the expected change in QRsi value.
Configuration Settings:
"Trend Bias" - Experimental setting for different asset classes and market conditions. Changes QRsi bias. Experiment with this on shorter timeframes. Leave on "low" unless you have established that different settings work better for a particular asset.
"Quant Preset" - This is similar to "Path Fitting Preset" on Heffae Clouds. Adjust this to print higher validity patterns on different assets.
The conformation that this setting is adjusted properly for your asset will be evident by backtesting the QRsi. BTC = 0 ETH / FOREX = 1 & 2
Experiment with this, as it adjusts the path-finding algo in order to paint valid patterns. The maths are too complex to integrate a single numerical adjustment, hence the preset.
"Upper/Lower Bounds" - This adjusts scaling and thresholds. Experimental only at this time. Use in conjunction with "Range Multiplier"
"Boundaries" - This adjusts the beginning of the shaded area on the top and bottom of the oscillator. Adjust this to a particular value instead of drawing a trendline on the value of interest. I added this because the shaded areas are easier to see on mobile than a trendline .
"Stochastic Short" - Adjust the length of Stochastic RSI SMA's
"Stochastic Long" - Adjust the length of Stochastic RSI SMA's
"Input for Stochastic" - Select the price source for Stoic & QRsi simplified line.
"Range Multiplier" - This amplifies the QRsi input to occupy a larger or smaller range within the oscillator boundaries. Experimental only at this time. Use in conjunction with "Upper/Lower Bounds". Very fun to play with.
That's all for now! I will do my best to keep this updated with new features / capabilities, as well as continuing to provide use examples and education for my indicators.
If there is a feature you would like, question answered, or a bug, please post in the SNOW_CITY Indicators Chat:
www.tradingview.com
Educational content will be posted here:
aedictiveanalytics.wordpress.com
Please see this pastebin link for access information and links:
pastebin.com
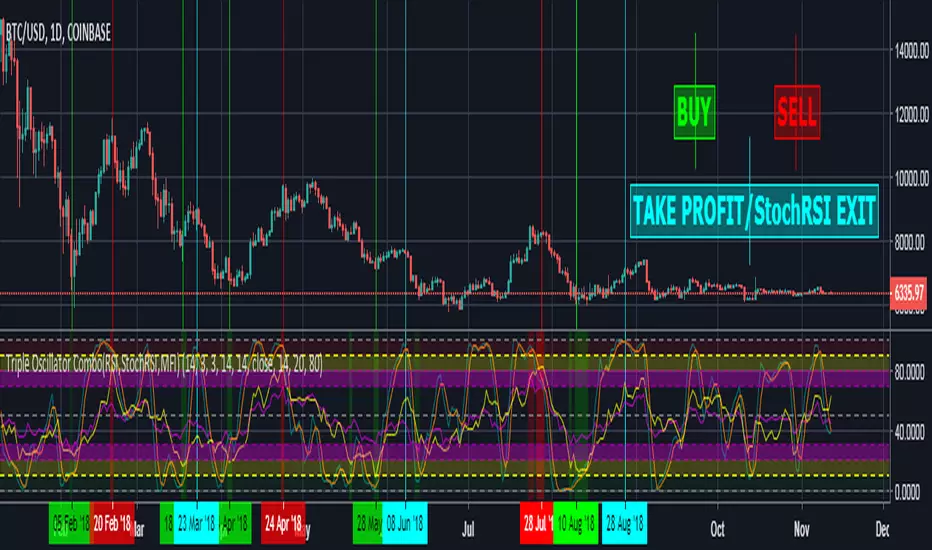
Triple Oscillator Combo(RSI,StochRSI,MFI) IlluminatedThis oscillator basically is three in one oscillator with every overbought/oversold condition on different levels being illuminated/highlighted in the oscillator background for ease of spotting potential trade opportunity .
Oscillators involved :-
1. RSI (Relative Strength Index)
2. StochRSI (Stocahstic Relative Strength Index)
3. MFI (Money Flow Index)
Tip :
a. While spotting bullish/bearish divergences, RSI is recommended more than MFI .
b. While spotting oversold/overbought conditions, MFI is recommended more than RSI (that is why MFI oversold/overbought conditions are
highlighted much brighter than that of RSI in the oscillator background).
c. Always use Stoch RSI with other indicators and never as a stand alone/independent (use Stoch RSI as grain of a salt) as it just helps you position
your entry exit better .
> You can always change configuration in setting/format as per your own requirement.
Librehash RSI FilterLo and behold, this is the Zero_n0ncense RSI Filter. This filter is designed to be plugged in as a regular RSI(14), but it provides buy and sell signals as well.
There isn't much more to this indicator than that. If extra documentation is requested by the community, I'll be more than happy to provide such.
Otherwise, this indicator is pretty straightforward in nature.
If you're interested in purchasing, let me know! Thank you guys.

RSI StrapFollowers, this RSI is for you!
RSI Strap uses a normal Relative Strength Index (RSI) to determine what price level is in the over-bought or over-sold range.
This minimalist overlay improves the technical trading experience as indicators take up a lot of space and leave your chart area cluttered.
Change the RSI length, as well as the overbought and oversold levels in the indicator settings panel.
The default RSI length is set at 14, and the overbought and oversold levels are 70% and 30% respectively.
Happy Trading!
Find this indicator by searching "RSI Strap" in the public indicator library.
Don't forget to like!

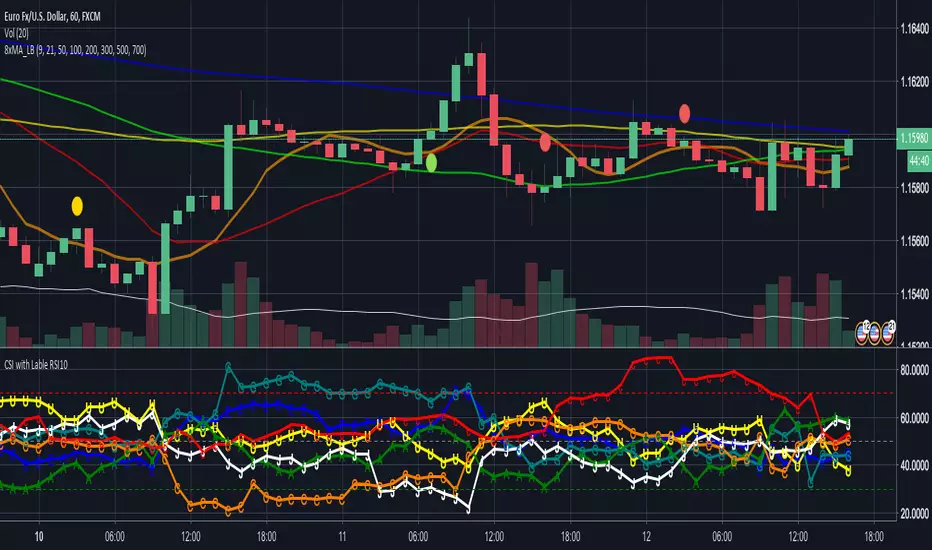
CSI - Currency strength indicator RSI 10This Indicator shows you the strength of the Currency in comparison for all other Main Currencys at the timeframe you choose.
The Currencys in this Indicator is: EUR, USD, GBP, CHF, AUD, CAD, JPY
The Base is the RSI (relative strength Indicator) with the following Currency pairs:
eurusd, eurgbp, euraud, eurjpy, eurcad, eurchf
usdeur, usdgbp, usdaud, usdjpy, usdcad, usdchf
gbpeur, gbpusd, gbpaud, gbpjpy, gbpcad, gbpchf
audeur, audusd, audgbp, audjpy, audcad, audchf
jpyeur, jpyusd, jpyaud, jpygbp, jpycad, jpychf
cadeur, cadusd, cadaud, cadgbp, cadjpy, cadchf
chfeur, chfusd, chfaud, chfgbp, chfjpy, chfcad
The letters in the LineChart:
EUR = E
USD = U
GBP = G
CHF = C
AUD = A
CAD = C
JPY = J
The CSI can help to see, if your trading pair have the potential to breakout on the support and resistance or if it more likely go back.
Some people say that the banks use this indicator.
NZD is missing there because Tradingview only support 6 variables.
If you have a solution for than, please let me know.
Thanks
Bands + RSIThis strategy uses the RSI indicator together with the Bollinger Bands to sell when the price is above the upper Bollinger Band (and to buy when this value is below the lower band). This simple strategy only triggers when both the RSI and the Bollinger Band indicators are at the same time in a overbought or oversold condition.
