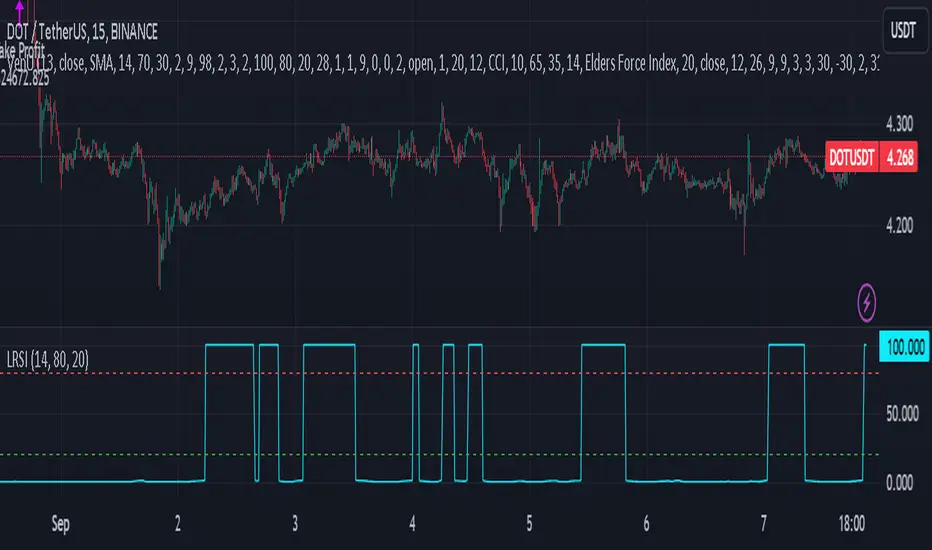
Laguerre RSI - non repaintingIt seems that the traditional Laguerre* functions repaint due to the gamma parameter.
That goes even for the editorial pick here.
But one could use calculation period instead of "gamma" parameter. This gives us a non-repainting Laguerre RSI fit for scalping trends.
At first glance, I haven't seen anyone do this with a pine script, but I could be wrong because it's not a big deal.
So here is a variation of Laguerre RSI, without repainting. It's a little bit more insensitive, but this is not of great importance, since only the extreme values are used for confirmation.
( * Laguerre RSI is based on John EHLERS' Laguerre Filter to avoid the noise of RSI.)
And if you implement this indicator into a strategy (like I do) I can give you a trick.
Traditionaly the condition is at follows:
LaRSI = cd == 0 ? 100 : cu / (cu + cd)
(this is the final part of the indicator before the plotting)
LongLaguerre= LaRSIupb
It's fine for the short (ot exit long), but for the long is better to make a swich between the CD and CU parameters, as follows:
LaRSI1 = cd == 0 ? 100 : cu / (cu + cd)
LaRSI2 = cu == 0 ? 100 : cu / (cu + cd)
LongLaguerre= LaRSI2upb
Rsi_oversold
12&50 RSI + %R2/50 RSI+ %R is a PineScript indicator that combines two popular technical indicators, the Relative Strength Index (RSI) and the Williams %R. The indicator plots two lines, K and D, which represent the smoothed moving averages of the RSI. It also plots the RSI with a 60-period length and the Williams %R with a 21-period length. The indicator can be used to identify overbought and oversold conditions, as well as potential reversals.
Here are some of the key features of the script:
It uses two different RSI lengths to provide a more comprehensive view of the market.
It plots the Williams %R, which can be used to identify overbought and oversold conditions.
It includes overbought and oversold levels to help traders identify potential entry and exit points.

MTF Smoothable RSI Nexus [DarkWaveAlgo]🧾 Description:
A nexus is a connection, link, or neuronal junction where signals and information are transmitted between different elements.
The MTF Smoothable RSI Nexus indicator serves as a nexus between smoothable, MTF RSIs by facilitating the visualization and interaction of up to six multi-timeframe RSIs, each with its own customizable timeframe, period, coloring customization, and price source. By combining these various RSIs, it helps you create a comprehensive view of MTF momentum trends and dynamics.
It acts as a control center that brings together multiple MTF RSIs and allows you to visualize the interactions between them with exceptional ease-of-use and customizability, helping to provide you with valuable insights into potential trend reversals, momentum shifts, and trading opportunities.
💡 Originality and Usefulness:
While there are other multi-timeframe RSI indicators available, MTF Smoothable RSI Nexus' global smoothing settings offer a flexible take on the development of price momentum across various timeframes. Its semi-transparent overbought and oversold fill zones create a compounding opaqueness when RSIs from multiple timeframes coalesce - making visual assessment of momentum extremes incredibly easy. We also believe it stands above the rest with its sheer quantity and quality of settings, features, and usability.
✔️ Re-Published to Avoid Misleading Values
This script has been re-published to ensure that it does not use `request.security()` calls using lookahead_on to access future data when referencing RSIs from other timeframes. This decreases the likelihood that the indicator will provide deceiving values. This change has been made in accordance with the PineScript documentation: "Using barmerge.lookahead_on at timeframes higher than the chart's without offsetting the `expression` argument like in `close [ ]` will introduce future leak in scripts, as the function will then return the `close` price before it is actually known in the current context" and the Publishing Rule: "Do not use `request.security()` calls using lookahead to access future data". Historical and real-time values may differ when referencing timeframes other than the chart's.
💠 Features:
6 toggleable MTF Smoothable RSIs with customizable timeframes, periods, and price sources
Compounding overbought/oversold filled areas for easy MTF momentum analysis
Aesthetic and flexible coloring and color theme styling options
End-of chart labels and options for ease-of-use and legibility
⚙️ Settings:
Use a Color Theme: When this setting is enabled, all manual 'Bullish and Bearish Colors' are overridden. All plots will use the colors from your selected Color Theme - excepting those plots set to use the 'Single Color' coloring method.
Color Theme: When 'Use a Color Theme' is enabled, this setting allows you to select the color theme you wish to use.
Hide RSIs on Timeframes Lower Than the Chart: When this setting is enabled, any MTF RSI with a timeframe smaller than that of the chart the indicator is applied to will be hidden from view.
Overbought Level: Set the level value for the overbought line.
Oversold Level: Set the level value for the oversold line.
Overbought Color: When 'Use a Color Theme' is disabled, this will set the color for the Overbought Level line.
Oversold Color: When 'Use a Color Theme' is disabled, this will set the color for the Oversold Level line.
Fill Overbought/Oversold Areas: When enabled, the area between any MTF RSI and the Overbought/Oversold level will be filled with semi-transparent coloring if that RSI is above/below the respective level.
Smooth RSIs: When enabled, all MTF RSIs will be processed through an additional smoothing average calculation.
Smoothing Type: Set the calculation type for the smoothing process. Options include: Exponential, Simple, Weighted, Volume-Weighted, and Hull.
Enable: Show/hide a specific MTF RSI.
Timeframe: Set the timeframe for a specific MTF RSI.
Period: Set the lookback period for a specific MTF RSI.
Source Price: Set the source value used for a specific MTF RSI's calculation.
Coloring Method: Set the coloring method for this specific RSI. The coloring method defines how the RSI should be dynamically colored. Options include: 'Single Color' and 'Increasing/Decreasing'.
Bullish Color: When 'Use a Color Theme' is disabled, this will set the 'bullish color' for this specific MTF RSI.
Bearish Color: When 'Use a Color Theme' is disabled, this will set the 'bearish color' for this specific MTF RSI.
Single Color: When the 'Coloring Method' is set to Single Color for this specific RSI, this color option will set the RSI's color.
Enable Label: When enabled, a label will show at the end of the chart displaying the timeframe, period, smoothing type (if any), and current price value of this specific MTF RSI.
Size: Sets the font size of this specific MTF RSI's label.
Label Offset (in Bars): Sets the distance from the latest bar, in bars, at which this specific MTF RSI's label is displayed.
Show Label Line: When enabled, this specific MTF RSI's label will be accommodated by a dashed line connecting it to its plot.
📈 Chart:
The chart shown in this original publication displays the 15 minute chart on ETHUSDT. Displayed on the chart are 4 MTF RSIs: the 15m 14 WMA-Smoothed RSI, 1h 14 WMA-Smoothed RSI, 4h 14 WMA-Smoothed RSI, and the 1D 14 WMA-Smoothed RSI - offering an exemplary view of how you can easily use these MTF RSIs to your advantage in analyzing momentum relationship across multiple timeframes.

RSI Primed [ChartPrime]
RSI Primed combines candlesticks, patterns, and the classic RSI indicator for advanced market trend indications
Introduction
Technical traders are always looking for innovative methods to pinpoint potential entry and exit points in the market. The RSI Prime indicator provides such traders with an enhanced view of market conditions by combining various charting styles and the Relative Strength Index (RSI). It offers users a unique perspective on the market trends and price momentum, enabling them to make better-informed decisions and stay ahead of the market curve.
The RSI Primed is a versatile indicator that combines different charting styles with the Relative Strength Index (RSI) to help traders analyze market trends and price momentum. It offers multiple visualization modes that serve specific purposes and provide unique insights into market performance:
Regular Candlesticks
Candlesticks with Patterns
Heikin Ashi Candles
Line Style
Regular Candlestick Mode
The Regular Candlestick Mode in RSI Primed depicts traditional Japanese candlesticks that most traders are familiar with. This mode bypasses any smoothing or modified calculations, representing real-price movements. Regular candlesticks offer a clear and straightforward way to visualize market trends and price action.
Candlestick with Patterns Mode
The Candlestick with Patterns Mode focuses on identifying high-probability candlestick patterns while incorporating RSI values. By leveraging the information captured by the RSI, this mode allows traders to spot significant market reversals or continuation patterns that could signal potential trading opportunities. Some recognizable patterns include engulfing bullish, engulfing bearish, morning star bullish, and evening star bearish patterns.
Heikin Ashi Candles Mode
The Heikin Ashi Candles Mode presents an advanced candlestick charting technique known for its excellent trend-following capabilities. Heikin Ashi Candles filter out noise in the market and provide a clear representation of market trends. In this mode, candlesticks are plotted based on RSI values of the open, high, low, and close prices, helping traders understand and utilize market trends effectively.
Line Style Mode
The Line Style Mode offers a simpler and minimalistic representation of the RSI values by using a line instead of candlesticks to visualize market trends. This mode helps traders focus on the overall trend direction and eliminates potential distractions caused by the complexity of candlestick patterns.
Candle Color Overlay Mode
The Candle Color Overlay Mode is a unique feature in the RSI Primed indicator that allows traders to visualize the RSI values on the chart's candles as a heat gradient. This mode adds a color overlay to the candlesticks, representing the RSI values in relation to the candlesticks' price action.
By displaying the RSI as a color gradient, traders can quickly assess market momentum and identify overbought or oversold conditions without having to switch between different modes or charts. The gradient ranges from cool colors (blue and green) for lower RSI values, indicating oversold conditions, to warm colors (orange and red) for higher RSI values, signifying overbought situations.
To enable the Candle Color Overlay Mode, traders can toggle the "Color Candles" option in the indicator settings. Once enabled, the color gradient will be applied to the candlesticks on the chart, providing a visually striking and informative representation of the RSI values in relation to price action. This mode can be used in tandem with any of the other charting styles, allowing traders to gain even more insights into market trends and momentum.
RSI Primed Implementation
The RSI Primed indicator combines the benefits of various charting styles with the RSI to help traders gain a comprehensive view of market trends and price momentum. It incorporates the Heikin Ashi and RSI values as inputs to generate several visualization modes, enabling traders to select the one that best suits their needs.
Chebyshev Digital Audio Filter in RSI Primed Indicator
A unique feature of the RSI Primed Indicator is the incorporation of the Chebyshev Digital Audio Filter, a powerful tool that significantly influences the indicator's accuracy and responsiveness. This signal processing method brings several benefits to the context of the RSI indicator, improving its performance and capabilities.
1. Improved Signal Filtering
The Chebyshev filter excels in its ability to remove high-frequency noise and unwanted signals from the RSI data. While other filtering techniques might introduce unwanted side effects or distort the RSI data, the Chebyshev filter accurately retains the main signal components, enhancing the RSI Primed's overall accuracy and reliability.
2. Faster Response Time
The Chebyshev filter offers a faster response time than most other filtering techniques. In the context of the RSI Primed Indicator, this means that the filtering process is quicker and more efficient, allowing traders to act swiftly during rapidly changing market conditions.
3. Enhanced Trend Detection
By effectively removing noise from the RSI data, the Chebyshev filter contributes to the enhanced detection of underlying market trends. This feature helps traders identify potential entry and exit points more accurately, improving their overall trading strategy and performance.
How to Use RSI Primed
Traders can choose from different visualization modes to suit their preferences while using the RSI Primed indicator. By closely monitoring the chosen visualization mode and the position of the moving average, traders can make informed decisions about market trends.
Green candlesticks or an upward line slope indicate a bullish trend, and red candlesticks or a downward line slope suggest a bearish trend. If the candles or line are above the moving average, it could signify an uptrend, whereas a position below the moving average may indicate a downtrend.
The RSI Primed indicator offers a unique and comprehensive perspective on market trends and price momentum by combining various charting styles with the RSI. Traders can choose from different visualization modes and make well-informed decisions to capitalize on market opportunities. This innovative indicator provides a clear and concise view of the market, enabling traders to make swift decisions and enhance their trading results.

RSI of Zero Lag MA (ValueRay)The RSI of a Zero Lag Moving Average a powerful tool for for reliable exit signals.
The Relative Strength Index (RSI) is a widely recognized momentum oscillator that measures the speed and change of price movements. It provides valuable insights into overbought and oversold conditions, enabling traders to identify potential reversal points and take advantage of market inefficiencies.
The RSI of a Zero Lag Indicator takes this concept a step further by incorporating the Zero Lag Moving Average. The Zero Lag Moving Average is a cutting-edge indicator that minimizes lag and provides a smoother representation of price action, allowing for quicker and more precise responses to market movements.
By combining the RSI with the Zero Lag Moving Average, this indicator offers traders a superior exit strategy. When the RSI reaches extreme levels of overbought or oversold conditions, it indicates a potential reversal in the market. The Zero Lag Moving Average further enhances this signal by reducing delays and providing timely exit points.
Moreover, the RSI of a Zero Lag Indicator is not limited to mean reversion strategies. While it excels in identifying mean reversion opportunities, it can also be used in conjunction with other trading approaches. Traders can take advantage of its objective signals to exit trades profitably, regardless of their chosen strategy.
With its ability to accurately pinpoint overbought and oversold conditions, the RSI of a Zero Lag Indicator offers traders a competitive edge in the market. By providing timely exit signals and minimizing lag, it helps traders optimize their trading decisions and increase their chances of success.

RSI Divergences on price chart - Open Source CodeHello Traders,
I have some exciting news to share with you all! Recently, I came across an incredible RSI divergences indicator developed by Socrate_FR. This indicator, in my opinion has an exceptional accuracy in detecting RSI divergences. However, during my exploration of other indicators in the TradingView library that display signals on the price chart, I found that many of them were often unreliable and missed out on important divergences.One such example is the Prices / RSI Divergences Detector by vtllr. Although vtllr did an amazing job with the indicator, I noticed that it didn't capture several relevant divergences accurately.
This observation inspired me to enhance the most accurate RSI divergences indicator available by showcasing the signals directly on the price chart. By doing so, I aimed to address the issue of unreliable and missed divergences in other price chart indicators. With this enhanced version, you can now effortlessly identify and track RSI regular divergences on the price chart itself:
-Regular bullish divergence occurs when the price forms lower lows while the RSI indicator forms higher lows. It suggests a potential bullish reversal (green line plot)
-Regular bearish divergence occurs when the price forms higher highs while the RSI indicator forms lower highs. It suggests a potential bearish reversal (red line plot)
Another key mofication:
This Indicator introduces a simpler approach compared to the original Socrate indicator. While Socrate differentiated divergences into eight types for both bullish and bearish scenarios, our enhanced version focuses on two distinct categories: small and big divergences. This decision was made to provide a clearer and more user-friendly experience. By condensing the divergence types into two groups, traders can easily identify and analyze the significance of the divergences without getting overwhelmed by excessive variations. The small divergences represent relatively minor divergences, while the big divergences indicate stronger and more significant signals.
-Small divergences represent relatively minor divergences (plotshape small circle)
-Big divergences indicate stronger signals (plotshape big circle)
I firmly believe that this enhanced RSI Divergences Indicator will be an invaluable tool for traders who rely on RSI analysis in their trading strategies. It combines the accuracy of Socrate_FR's original indicator with the enhanced visibility of signals on the price chart, ensuring you never miss any important divergences.
If you're interested in trying out this enhanced version of the indicator, please feel free to access the open-source code. If you want to visit and try the original version of the code visit Socrate_FR profile.
www.tradingview.com
Keep attention!
It is important to note that no trading indicator or strategy is foolproof, and there is always a risk of losses in trading. While this indicator may provide useful information for making conclusions, it should not be used as the sole basis for making trading decisions. Traders should always use proper risk management techniques and consider multiple factors when making trading decisions.
Support us:)
If you find this new indicator helpful in your trading analysis, I would greatly appreciate your support! Please consider to follow, giving it a like, leaving feedback, or sharing it with your trading network. Your engagement will not only help me improve this tool but will also help other traders discover it and benefit from its features. Thank you for your support!

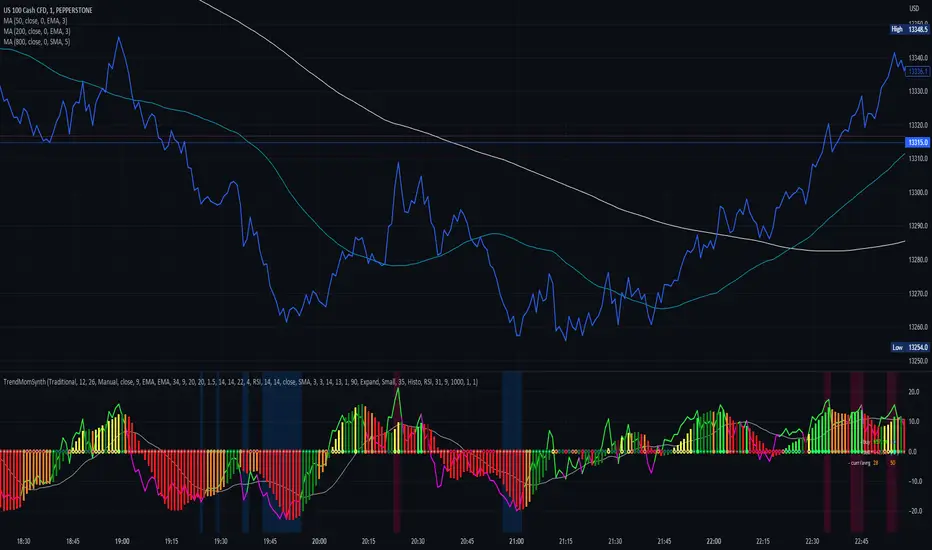
Trend Momentum SynthesizerBy analyzing the MACD (Moving Average Convergence Divergence) and Squeeze Momentum indicators, this indicator helps identify potential bullish, bearish, or undecided market conditions.
The algorithm within considers the positions of the MACD and Squeeze Momentum indicators to determine the overall market sentiment. When the indicators align and indicate a bullish market condition, the indicator's plot color will be either dark green, green, yellow, or lime, indicating a potential bullish trend. Conversely, if the indicators align and indicate a bearish market condition, the plot color will be maroon or red, denoting a potential bearish trend. When the indicators are inconclusive, the plot color will be orange, suggesting an undecided market.
The ADX is an addon component of this indicator, helping to assess the strength of a trend. By analyzing the ADX, the indicator determines whether a trend is strong enough, providing additional confirmation for potential trade signals. The ADX smoothing and DI (Directional Index) length parameters can be customized to suit individual trading preferences.
By combining these indicators, the algorithm provides traders with a comprehensive view of the market, helping them make informed trading decisions. It aims to assist traders in identifying potential market opportunities and aligns with the objective of maximizing trading performance.
How to use the indicator:
Note: I used back-testing for fine tuning do not base your trades on signals from the testing framework.
JS-TechTrading: Supertrend-Strategy_Basic versionAre you looking for a reliable and profitable algorithmic trading strategy for TradingView? If so, you might be interested in our Supertrend basic strategy, which is based on three powerful indicators: Supertrend (ATR), RSI and EMA.
Supertrend is a trend-following indicator that helps you identify the direction and strength of the market. It also gives you clear signals for entry and exit points based on price movements.
RSI is a momentum indicator that measures the speed and change of price movements. It helps you filter out false signals and avoid overbought or oversold conditions.
EMA is a moving average indicator that smooths out price fluctuations and shows you the long-term trend of the market. It helps you confirm the validity of your trades and avoid trading against the trend.
Our Supertrend basic strategy combines these three indicators to give you a simple yet effective way to trade any market. Here's how it works:
- For long trades, you enter when the price is above Supertrend and pulls back below it (the low of the candle crosses Supertrend) and then rebounds above it (the high of the next candle goes above the pullback candle). You exit when the price closes below Supertrend or when you reach your target profit or stop loss.
- For short trades, you enter when the price is below Supertrend and pulls back above it (the high of the candle crosses Supertrend) and then drops below it (the low of the next candle goes below the pullback candle). You exit when the price closes above Supertrend or when you reach your target profit or stop loss.
- You can also use RSI and EMA filters to improve your results. For long trades, you only enter if RSI is above 50 and price is above 200 EMA. For short trades, you only enter if RSI is below 50 and price is below 200 EMA.
- You can set your stop loss and target profit as a percentage of your entry price or based on other criteria. You can also adjust the parameters of each indicator according to your preferences and risk tolerance.
Our Supertrend basic strategy is easy to use and has been tested on various markets and time frames. It can help you capture consistent profits while minimizing your losses.

Advanced VWAP_Pullback Strategy_Trend-Template QualifierGeneral Description and Unique Features of this Script
Introducing the Advanced VWAP Momentum-Pullback Strategy (long-only) that offers several unique features:
1. Our script/strategy utilizes Mark Minervini's Trend-Template as a qualifier for identifying stocks and other financial securities in confirmed uptrends. Mark Minervini, a 2x US Investment Champion, developed the Trend-Template, which covers eight different and independent characteristics that can be adjusted and optimized in this trend-following strategy to ensure the best results. The strategy will only trigger buy-signals in case the optimized qualifiers are being met.
2. Our strategy is based on the supply/demand balance in the market, making it timeless and effective across all timeframes. Whether you are day trading using 1- or 5-min charts or swing-trading using daily charts, this strategy can be applied and works very well.
3. We have also integrated technical indicators such as the RSI and the MA / VWAP crossover into this strategy to identify low-risk pullback entries in the context of confirmed uptrends. By doing so, the risk profile of this strategy and drawdowns are being reduced to an absolute minimum.
Minervini’s Trend-Template and the ‘Stage-Analysis’ of the Markets
This strategy is a so-called 'long-only' strategy. This means that we only take long positions, short positions are not considered.
The best market environment for such strategies are periods of stable upward trends in the so-called stage 2 - uptrend.
In stable upward trends, we increase our market exposure and risk.
In sideways markets and downward trends or bear markets, we reduce our exposure very quickly or go 100% to cash and wait for the markets to recover and improve. This allows us to avoid major losses and drawdowns.
This simple rule gives us a significant advantage over most undisciplined traders and amateurs!
'The Trend is your Friend'. This is a very old but true quote.
What's behind it???
• 98% of stocks made their biggest gains in a Phase 2 upward trend.
• If a stock is in a stable uptrend, this is evidence that larger institutions are buying the stock sustainably.
• By focusing on stocks that are in a stable uptrend, the chances of profit are significantly increased.
• In a stable uptrend, investors know exactly what to expect from further price developments. This makes it possible to locate low-risk entry points.
The goal is not to buy at the lowest price – the goal is to buy at the right price!
Each stock goes through the same maturity cycle – it starts at stage 1 and ends at stage 4
Stage 1 – Neglect Phase – Consolidation
Stage 2 – Progressive Phase – Accumulation
Stage 3 – Topping Phase – Distribution
Stage 4 – Downtrend – Capitulation
This strategy focuses on identifying stocks in confirmed stage 2 uptrends. This in itself gives us an advantage over long-term investors and less professional traders.
By focusing on stocks in a stage 2 uptrend, we avoid losses in downtrends (stage 4) or less profitable consolidation phases (stages 1 and 3). We are fully invested and put our money to work for us, and we are fully invested when stocks are in their stage 2 uptrends.
But how can we use technical chart analysis to find stocks that are in a stable stage 2 uptrend?
Mark Minervini has developed the so-called 'trend template' for this purpose. This is an essential part of our JS-TechTrading pullback strategy. For our watchlists, only those individual values that meet the tough requirements of Minervini's trend template are eligible.
The Trend Template
• 200d MA increasing over a period of at least 1 month, better 4-5 months or longer
• 150d MA above 200d MA
• 50d MA above 150d MA and 200d MA
• Course above 50d MA, 150d MA and 200d MA
• Ideally, the 50d MA is increasing over at least 1 month
• Price at least 25% above the 52w low
• Price within 25% of 52w high
• High relative strength according to IBD.
NOTE: In this basic version of the script, the Trend-Template has to be used as a separate indicator on TradingView (Public Trend-Template indicators are available in TradingView – community scripts). It is recommended to only execute buy signals in case the stock or financial security is in a stage 2 uptrend, which means that the criteria of the trend-template are fulfilled.
This strategy can be applied to all timeframes from 5 min to daily.
The VWAP Momentum-Pullback Strategy
For the JS-TechTrading VWAP Momentum-Pullback Strategy, only stocks and other financial instruments that meet the selected criteria of Mark Minervini's trend template are recommended for algorithmic trading with this startegy.
A further prerequisite for generating a buy signals is that the individual value is in a short-term oversold state (RSI).
When the selling pressure is over and the continuation of the uptrend can be confirmed by the MA / VWAP crossover after reaching a price low, a buy signal is issued by this strategy.
Stop-loss limits and profit targets can be set variably. You also have the option to make use of the trailing stop exit strategy.
Relative Strength Index (RSI)
The Relative Strength Index (RSI) is a technical indicator developed by Welles Wilder in 1978. The RSI is used to perform a market value analysis and identify the strength of a trend as well as overbought and oversold conditions. The indicator is calculated on a scale from 0 to 100 and shows how much an asset has risen or fallen relative to its own price in recent periods.
The RSI is calculated as the ratio of average profits to average losses over a certain period of time. A high value of the RSI indicates an overbought situation, while a low value indicates an oversold situation. Typically, a value > 70 is considered an overbought threshold and a value < 30 is considered an oversold threshold. A value above 70 signals that a single value may be overvalued and a decrease in price is likely , while a value below 30 signals that a single value may be undervalued and an increase in price is likely.
For example, let's say you're watching a stock XYZ. After a prolonged falling movement, the RSI value of this stock has fallen to 26. This means that the stock is oversold and that it is time for a potential recovery. Therefore, a trader might decide to buy this stock in the hope that it will rise again soon.
The MA / VWAP Crossover Trading Strategy
This strategy combines two popular technical indicators: the Moving Average (MA) and the Volume Weighted Average Price (VWAP). The MA VWAP crossover strategy is used to identify potential trend reversals and entry/exit points in the market.
The VWAP is calculated by taking the average price of an asset for a given period, weighted by the volume traded at each price level. The MA, on the other hand, is calculated by taking the average price of an asset over a specified number of periods. When the MA crosses above the VWAP, it suggests that buying pressure is increasing, and it may be a good time to enter a long position. When the MA crosses below the VWAP, it suggests that selling pressure is increasing, and it may be a good time to exit a long position or enter a short position.
Traders typically use the MA VWAP crossover strategy in conjunction with other technical indicators and fundamental analysis to make more informed trading decisions. As with any trading strategy, it is important to carefully consider the risks and potential rewards before making any trades.
This strategy is applicable to all timeframes and the relevant parameters for the underlying indicators (RSI and MA/VWAP) can be adjusted and optimized as needed.
Backtesting
Backtesting gives outstanding results on all timeframes and drawdowns can be reduced to a minimum level. In this example, the hourly chart for MCFT has been used.
Settings for backtesting are:
- Period from Jan 2020 until March 2023
- Starting capital 100k USD
- Position size = 25% of equity
- 0.01% commission = USD 2.50.- per Trade
- Slippage = 2 ticks
Other comments
- This strategy has been designed to identify the most promising, highest probability entries and trades for each stock or other financial security.
- The combination of the Trend-Template and the RSI qualifiers results in a highly selective strategy which only considers the most promising swing-trading entries. As a result, you will normally only find a low number of trades for each stock or other financial security per year in case you apply this strategy for the daily charts. Shorter timeframes will result in a higher number of trades / year.
- Consequently, traders need to apply this strategy for a full watchlist rather than just one financial security.

JS-TechTrading: VWAP Momentum_Pullback StrategyGeneral Description and Unique Features of this Script
Introducing the VWAP Momentum-Pullback Strategy (long-only) that offers several unique features:
1. Our script/strategy utilizes Mark Minervini's Trend-Template as a qualifier for identifying stocks and other financial securities in confirmed uptrends.
NOTE: In this basic version of the script, the Trend-Template has to be used as a separate indicator on TradingView (Public Trend-Template indicators are available on TradingView – community scripts). It is recommended to only execute buy signals in case the stock or financial security is in a stage 2 uptrend, which means that the criteria of the trend-template are fulfilled.
2. Our strategy is based on the supply/demand balance in the market, making it timeless and effective across all timeframes. Whether you are day trading using 1- or 5-min charts or swing-trading using daily charts, this strategy can be applied and works very well.
3. We have also integrated technical indicators such as the RSI and the MA / VWAP crossover into this strategy to identify low-risk pullback entries in the context of confirmed uptrends. By doing so, the risk profile of this strategy and drawdowns are being reduced to an absolute minimum.
Minervini’s Trend-Template and the ‘Stage-Analysis’ of the Markets
This strategy is a so-called 'long-only' strategy. This means that we only take long positions, short positions are not considered.
The best market environment for such strategies are periods of stable upward trends in the so-called stage 2 - uptrend.
In stable upward trends, we increase our market exposure and risk.
In sideways markets and downward trends or bear markets, we reduce our exposure very quickly or go 100% to cash and wait for the markets to recover and improve. This allows us to avoid major losses and drawdowns.
This simple rule gives us a significant advantage over most undisciplined traders and amateurs!
'The Trend is your Friend'. This is a very old but true quote.
What's behind it???
• 98% of stocks made their biggest gains in a Phase 2 upward trend.
• If a stock is in a stable uptrend, this is evidence that larger institutions are buying the stock sustainably.
• By focusing on stocks that are in a stable uptrend, the chances of profit are significantly increased.
• In a stable uptrend, investors know exactly what to expect from further price developments. This makes it possible to locate low-risk entry points.
The goal is not to buy at the lowest price – the goal is to buy at the right price!
Each stock goes through the same maturity cycle – it starts at stage 1 and ends at stage 4
Stage 1 – Neglect Phase – Consolidation
Stage 2 – Progressive Phase – Accumulation
Stage 3 – Topping Phase – Distribution
Stage 4 – Downtrend – Capitulation
This strategy focuses on identifying stocks in confirmed stage 2 uptrends. This in itself gives us an advantage over long-term investors and less professional traders.
By focusing on stocks in a stage 2 uptrend, we avoid losses in downtrends (stage 4) or less profitable consolidation phases (stages 1 and 3). We are fully invested and put our money to work for us, and we are fully invested when stocks are in their stage 2 uptrends.
But how can we use technical chart analysis to find stocks that are in a stable stage 2 uptrend?
Mark Minervini has developed the so-called 'trend template' for this purpose. This is an essential part of our JS-TechTrading pullback strategy. For our watchlists, only those individual values that meet the tough requirements of Minervini's trend template are eligible.
The Trend Template
• 200d MA increasing over a period of at least 1 month, better 4-5 months or longer
• 150d MA above 200d MA
• 50d MA above 150d MA and 200d MA
• Course above 50d MA, 150d MA and 200d MA
• Ideally, the 50d MA is increasing over at least 1 month
• Price at least 25% above the 52w low
• Price within 25% of 52w high
• High relative strength according to IBD.
NOTE: In this basic version of the script, the Trend-Template has to be used as a separate indicator on TradingView (Public Trend-Template indicators are available in TradingView – community scripts). It is recommended to only execute buy signals in case the stock or financial security is in a stage 2 uptrend, which means that the criteria of the trend-template are fulfilled.
This strategy can be applied to all timeframes from 5 min to daily.
The VWAP Momentum-Pullback Strateg y
For the JS-TechTrading VWAP Momentum-Pullback Strategy, only stocks and other financial instruments that meet the selected criteria of Mark Minervini's trend template are recommended for algorithmic trading with this startegy.
A further prerequisite for generating a buy signals is that the individual value is in a short-term oversold state (RSI).
When the selling pressure is over and the continuation of the uptrend can be confirmed by the MA / VWAP crossover after reaching a price low, a buy signal is issued by this strategy.
Stop-loss limits and profit targets can be set variably.
Relative Strength Index (RSI)
The Relative Strength Index (RSI) is a technical indicator developed by Welles Wilder in 1978. The RSI is used to perform a market value analysis and identify the strength of a trend as well as overbought and oversold conditions. The indicator is calculated on a scale from 0 to 100 and shows how much an asset has risen or fallen relative to its own price in recent periods.
The RSI is calculated as the ratio of average profits to average losses over a certain period of time. A high value of the RSI indicates an overbought situation, while a low value indicates an oversold situation. Typically, a value > 70 is considered an overbought threshold and a value < 30 is considered an oversold threshold. A value above 70 signals that a single value may be overvalued and a decrease in price is likely , while a value below 30 signals that a single value may be undervalued and an increase in price is likely.
For example, let's say you're watching a stock XYZ. After a prolonged falling movement, the RSI value of this stock has fallen to 26. This means that the stock is oversold and that it is time for a potential recovery. Therefore, a trader might decide to buy this stock in the hope that it will rise again soon.
The MA / VWAP Crossover Trading Strategy
This strategy combines two popular technical indicators: the Moving Average (MA) and the Volume Weighted Average Price (VWAP). The MA VWAP crossover strategy is used to identify potential trend reversals and entry/exit points in the market.
The VWAP is calculated by taking the average price of an asset for a given period, weighted by the volume traded at each price level. The MA, on the other hand, is calculated by taking the average price of an asset over a specified number of periods. When the MA crosses above the VWAP, it suggests that buying pressure is increasing, and it may be a good time to enter a long position. When the MA crosses below the VWAP, it suggests that selling pressure is increasing, and it may be a good time to exit a long position or enter a short position.
Traders typically use the MA VWAP crossover strategy in conjunction with other technical indicators and fundamental analysis to make more informed trading decisions. As with any trading strategy, it is important to carefully consider the risks and potential rewards before making any trades.
This strategy is applicable to all timeframes and the relevant parameters for the underlying indicators (RSI and MA/VWAP) can be adjusted and optimized as needed.
Backtesting
Backtesting gives outstanding results on all timeframes and drawdowns can be reduced to a minimum level. In this example, the hourly chart for MCFT has been used.
Settings for backtesting are:
- Period from April 2020 until April 2021 (1 yr)
- Starting capital 100k USD
- Position size = 25% of equity
- 0.01% commission = USD 2.50.- per Trade
- Slippage = 2 ticks
Other comments
• This strategy has been designed to identify the most promising, highest probability entries and trades for each stock or other financial security.
• The RSI qualifier is highly selective and filters out the most promising swing-trading entries. As a result, you will normally only find a low number of trades for each stock or other financial security per year in case you apply this strategy for the daily charts. Shorter timeframes will result in a higher number of trades / year.
• As a result, traders need to apply this strategy for a full watchlist rather than just one financial security.

The Perfect Support & ResistanceSupport & Resistance drawn based on overbought & oversold RSI . where the overbought acts as resistance and oversold acts as support.
It has 2 levels (for support and resistance - i call them level_n_high or level_n_low) for each lookback period. it checks the highest pivot and the lowest pivot based on the lookback period then we compare if rsi is higher than the highest pivot or the lowest pivot and we also check if rsi is overbought or oversold and if the statement is true, then we assign the high to the variable level_n_high or level_n_low. n being the number of levels. in total there are 5 levels with both high & low for 5 lookback periods. This is basically how the code works.
these levels can be accessed at any timeframe. the defaults are 5m and 30m.
RSI settings: (default)
-------------------
length - 14
source - close
overbought - 70
oversold - 30
lookback settings: (default)
---------------------
lookback_0 - 200
lookback_1 - 100
lookback_2 - 50
lookback_3 - 20
lookback_4 - 10
Timeframe Settings: (default)
-------------------
htf1 - 5m
htf2 - 30m
Enjoy!

Multi Timeframe Stochastic RSI ScreenerThis script is also a Stochastic RSI Screener, but it allows users to choose one specific symbol and three timeframes of that symbol to monitor at once.

Reinforced RSI - The Quant Science This strategy was designed and written with the goal of showing and motivating the community how to integrate our 'Probabilities' module with their own script.
We have recreated one of the simplest strategies used by many traders. The strategy only trades long and uses the overbought and oversold levels on the RSI indicator.
We added stop losses and take profits to offer more dynamism to the strategy. Then the 'Probabilities' module was integrated to create a probabilistic reinforcement on each trade.
Specifically, each trade is executed, only if the past probabilities of making a profitable trade is greater than or equal to 51%. This greatly increased the performance of the strategy by avoiding possible bad trades.
The backtesting was calculated on the NASDAQ:TSLA , on 15 minutes timeframe.
The strategy works on Tesla using the following parameters:
1. Lenght: 13
2. Oversold: 40
3. Overbought: 70
4. Lookback: 50
5. Take profit: 3%
6. Stop loss: 3%
Time period: January 2021 to date.
Our Probabilities Module, used in the strategy example:

RAINBOW_13thHi Dears!
hereby, I present you one of my indicators which is a kind of artistic indicator.
It calculates different ranks of functions and based on them suggests a buy or sell order which is depicted on right-side separately.
Inputs:
(For calculating)
+Source:
+Length: Number of previous bars in calculation
+Topology:
++EMA
++RMA
++SMA
++RSI
+OVER BOUGHT RSI: Define your boundary for overbought in RSI-TOPOLOGY.
+OVER SOLD RSI: Define your boundary for oversold in RSI-TOPOLOGY.
(Visual)
+Transparency: affect colors of rainbow!
Wish you good deals!
BY USING PLZ DO NOT FORGET TO BOOST IT!
Shakib.

Rich Robin Index, The Crypto Fear & Greed Index with RSI Trend The Relative Strength Index (RSI) is a technical indicator based on price movements that is used to determine whether a particular asset is overbought or oversold. It measures the ratio of rising to falling prices over a certain period of time.
The Fear & Greed Index, on the other hand, is a composite index that tracks the sentiment of the crypto market. It is based on seven indicators, each of which measures a different aspect of market behavior. These indicators are: Safe Haven Demand, Stock Price Breadth, Market Momentum, Stock Price Strength, Put and Call Options, Junk Bond Demand, and Market Volatility.
The combination of the RSI and the Fear & Greed Index can provide valuable insights for crypto traders. The RSI can help identify overbought and oversold conditions, while the Fear & Greed Index can give an overall sense of the sentiment in the market. Together, they can provide a more complete picture of the market conditions. For example, if the RSI is indicating that an asset is overbought, but the Fear & Greed Index is showing that the market is still in a state of fear, it may be a good time to sell. On the other hand, if the RSI is indicating that an asset is oversold, but the Fear & Greed Index is showing that the market is in a state of greed, it may be a good time to buy.
Overall, the combination of the RSI and the Fear & Greed Index can provide useful information for traders to make more informed decisions, by giving a sense of the market conditions, and providing a way to identify overbought and oversold conditions.

RSI Accumulation/Distribution [M]Hello everyone,
After my long tests, I observed that the rate of change of direction of the price was high after the periods when the RSI spent a long time outside the band. As a result of my observations, I prepared this indicator.
This indicator shows you the accumulation and distribution areas that occur outside the rsi band.
There are 3 different levels available.
Level 1 = 5 Bars
Level 2 = 7 Bars
Level 3 = 9 Bars
For example, if the RSI spends more than 9 bars below the 30 level or above the 70 level, it will paint that area red. Levels can be changed from the indicator settings. The rsi is smoothed with simple moving average to reduce fake signals.
Using the RSI A/D indicator with different indicators or patterns will increase your success rate.
Examples:

RSI Dashboard Monitor [Skiploss]RSI Dashboard Monitor is indicator for scanner Relative Strength Index ( RSI ) for 4 symbols and 10 Timeframe, detached from the main chart.
You can choose to display all 4 symbols or just 1 symbol, also can choose resolution (TF). Still, these 10 timeframes should be enough to use. Default is set to 14 but you can modify it from settings.
How it work??
RSI >= 75 : Fill color maximum overbought
RSI >= 65 : Fill color medium overbought
RSI >= 55 : Fill color minimum overbought
RSI >= 45 : Fill color minimum overbought
RSI >= 35 : Fill color medium overbought
RSI >= 25 : Fill color maximum overbought
** Values level and color style can modify it from settings

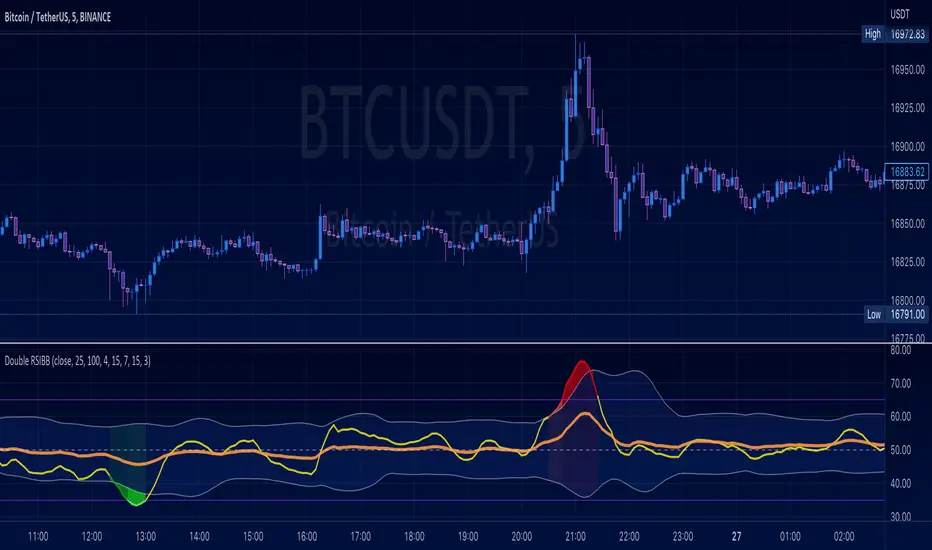
Double RSI + BBRSI stands for Relative Strength Index.
Bollinger Bands stands for a channel open by standard deviation values plotting upper, lower lines.
Double RSI with Bollinger bands adapted Bollinger bands to RSI not using overlay mode. It tries to filter fake signals while giving more good signals according to volatility even below overbought areas or above oversold areas. This way you can use greater values for RSI, like 25 and 100, increasing smoothness with less market noise.
We added an extra gap spacer to smooth Bollinger bands while widening the channel with a lower multiplier.
I found better results when Fast RSI crosses back into Bollinger bands channel.
You can play with the following settings:
• Source
Close is the most used
• Fast RSI length
Default to 25
• Slow RSI length
Default to 100
• RSI Smoothing
To filter out some graphic noise
• RSI Overbought, Oversold
Regular overbought, oversold lines handled by a single value. For 70/30, set it to 20 although with longer RSI something around 15 is enough.
• Bollinger Spacer
Ads thickness to the channel with lower multiplier
• Bollinger Length
Regular Bollinger length applied to slow RSI
• Bollinger Multiplier
Regular Bollinger multiplier applied to slow RSI
Disclaimer:
For study purposes only, trading without a good risk management can be regrettable, do your own research, always add confirmations, use it as is, at your own risk.
RSI on Chart Window- The RSI indicator is displayed right on the chart, along with overbought and oversold notification symbols.
- Easily enable/disable the display of RSI Upper Band, Lower Band.

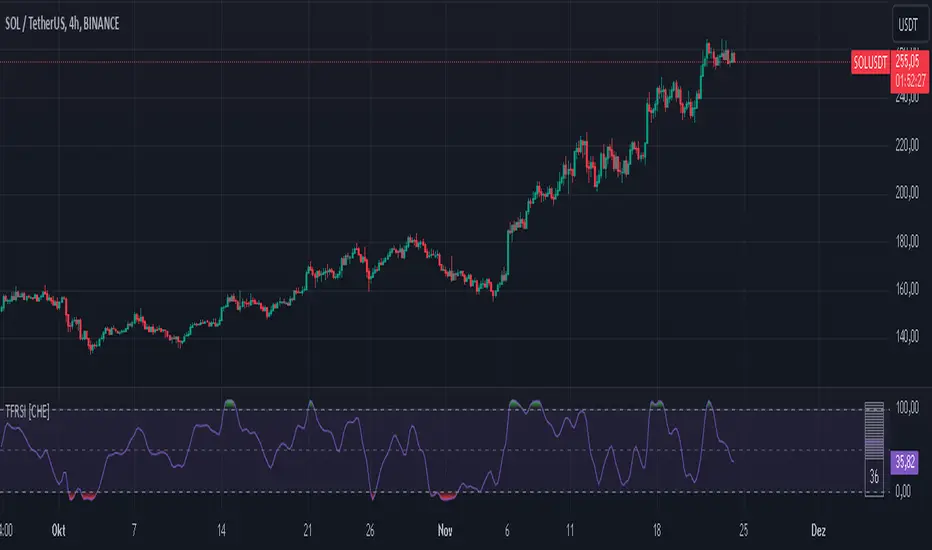
The Forbidden RSI [CHE]My main goal of programming and publishing an indicator is that everyone should have the opportunity to use indicators that do not show false signals or where there is maximum practical use, so I publish this indicator:
This script is an advanced variant of the Onset Trend Detector, a technical indicator for trend analysis developed by John F. Ehlers.
It is based on a non-linear quotient transformation and expands upon Mr. Ehlers' previous studies, the Super Smoother Filter and the Roofing Filter,
to address the lag issue common to moving average type indicators.
The algorithm in this script registers the most recent peak value and normalizes it. The normalized value then decays slowly until the next
peak swing. The ratio of the previously filtered value to the corresponding peak value is then transformed using a quotient transformation to
provide the resulting oscillator.
This script implements an indicator called "The forbidden RSI" (TFRSI). This indicator was developed by chervolino as an improvement on the
standard Relative Strength Index (RSI), which is a technical indicator used to measure the strength of a trend and identify potential buy and sell signals.
The TFRSI is calculated based on the close price and is typically plotted on a scale from -20 to 120, with values above 100 indicating that
the asset is overbought (likely to decline in value) and values below 1 indicating that it is oversold (likely to increase in value). The script
allows the user to customize the length of the RSI and the length of the trigger used to smooth the signal.
In order to calculate the TFRSI, the script first initializes some constants and then performs a series of calculations to determine the value of
"HP", "ag", and "Sp". The RSI value is then calculated based on the values of "X", which is based on "ag" and "Sp", and "q1", which is based on "X"
and the trigger length. The RSI value is plotted in a chart along with upper and lower bounds and a filled region representing the background.
Please check it out, it works perfectly to find good analysis and entries for both, longs and shorts.
Best regards
Chervolino
Note: I hope that the moderators like my script and the explanation and don't delete it this time
RSI Objective LinesThe RSI is a contrarian indicator bounded between 0 and 100 where values close to the area of 30 represent an oversold condition and values close to the area of 70 represent an overbought condition.
Generally, we use the area of 70/75 and the area of 30/25 as extremes that signal a market reversal or a correction. But what if we calculate a simple way to make these levels more dynamic?
The main idea from these objective support and resistance levels is that market regime and dynamics move and as such fixed levels are unlikely to always provide value which means that we can try creating variable levels. The objective support and resistance levels are created following these steps:
* Calculate a 14-period RSI on the close price, let's call this RSI_Close.
* Calculate a 14-period RSI on the high price, let's call this RSI_High.
* Calculate a 14-period RSI on the low price, let's call this RSI_Low.
* Calculate the maximum range which is the highest value of RSI_High in the last 200 periods minus the lowest value of RSI_Low in the last 200 periods. Let's call this Max_Range
* Define the range width. By default, it is set to 5%. Let's call this Threshold.
* The objective support is calculated as the sum of the RSI_Low + (Max_Range * Threshold).
* The objective resistance is calculated as the sum of the RSI_High - (Max_Range * Threshold).
The levels are used in the same way as the oversold and overbought levels. They are more dynamic as they take into account the fluctuations of the RSI so you might see at some point in time a support at 20 and at another at 35.

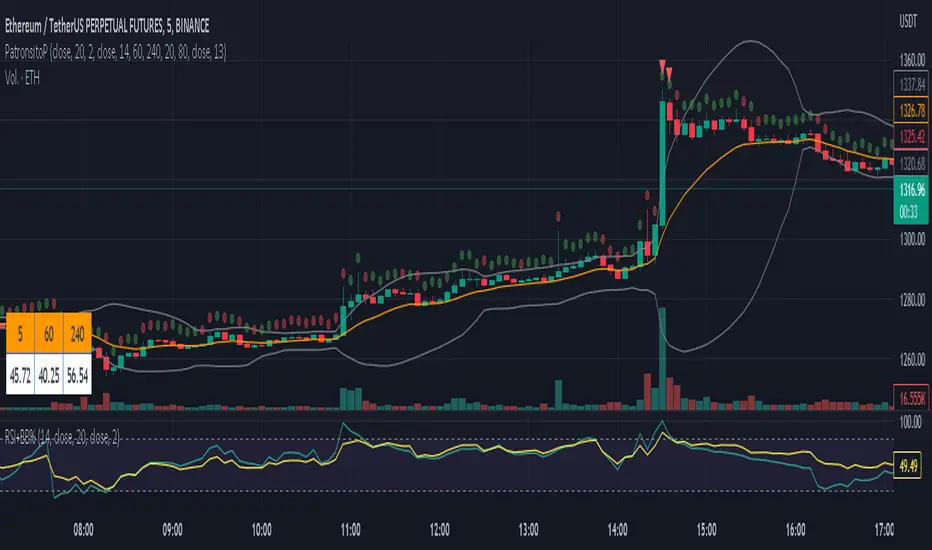
PatronsitoPIndicator for the "Patrón Poderoso" strategy.
This strategy is based on Bollinger Bands and RSI and try to determine overbought or oversold zones where you can trade. Both indicators are combined to provide a stronger signal.
By default, it is considered an overbought zone when price is over BB upper and RSI above 80. That would be a short signal. Price below BB lower and RSI below 20 means an oversold zone and therefore a long signal.
EMA 13 (by default) is included as a guide for exiting the operation.
Alarms for signals in any direction can be used.
RSI ProfileThis indicator shows the RSI profile from historical RSI Value and High / Low RSI Pivots.
It is inspired by the Volume Profile which is a common charting study that indicates activity at specified levels. It plots a histogram on the chart meant to identify dominant/significant levels.
This script is profiling RSI levels into a histogram, which can identify the crucial RSI values in the chart. Along with the pivot options that can help identify the dominant pivot points where RSI values had been rebounding historically.
How to use:
There are three profile types available in the settings. When selecting RSI Values, the indicator will count RSI values from history, and plot the count in a histogram at the end of the chart. If you select RSI Pivots High or RSI Pivots Low, the indicator will count only the RSI Pivot Highs and Lows and plot the count in a histogram. Users can select the Pivot Left/Right length from the settings.
Users can extend the POC line to the left, to study how the values had been reacting to POC
Please note: Since the RSi values range from 0 to 100, the indicator is rounding off the values to absolute numbers. This can cause a situation where multiple POC are identified, to find the unique POC, you can increase the width of the histogram.
The Max/Min RSI settings are for visual purposes only, it can help users shrink down the histogram's top and bottom visibility
