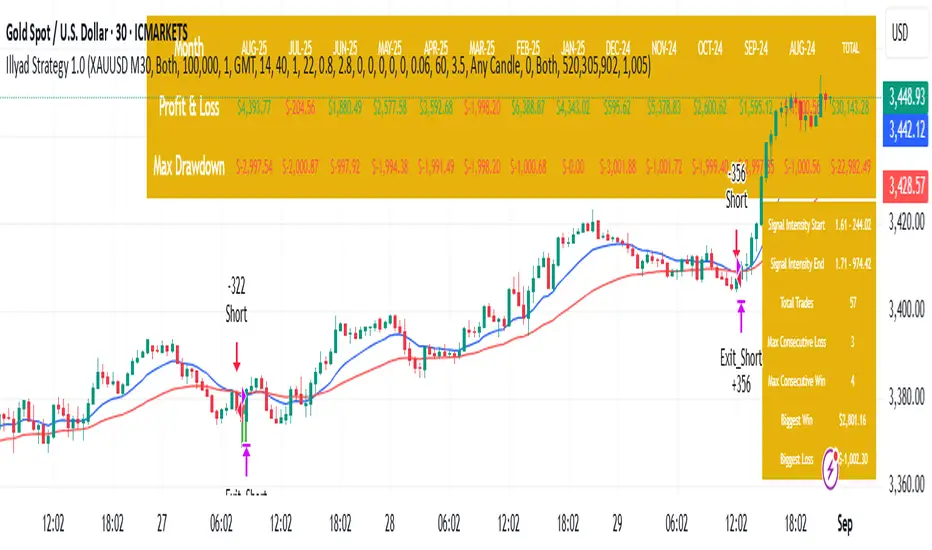
Optimised XAU/USD (Gold, IC Markets, 30m)The Illyad Strategy 1.0 optimised for XAU/USD (Gold) on the 30-minute timeframe (IC Markets feed).
📊 Backtest Results (Jan 2024 – Aug 2025):
✅ Total P&L: +30,143.28 USD (+30.14%)
📉 Max Drawdown: 3.60% (3,945.84 USD)
🔁 Total Trades: 57
📈 Win Rate: 42.11% (24/57 trades)
⚖️ Profit Factor: 1.91
This setup shows steady performance and low drawdown on Gold — ideal for traders wanting to capture volatility while maintaining consistency.
🔧 Optimisation Notes:
Works best on the 30m timeframe.
Each instrument (forex, indices, commodities, stocks) has unique behaviour.
To maximise results, always optimise the parameters per symbol — e.g., Gold requires a different configuration than GBP/USD or NASDAQ.
💡 Best Use Cases:
Prop firm challenges & scaling funded accounts.
Long-term compounding with low risk.
Automated execution via TradingView alerts → MT5 for hands-free trading.
⚠️ Disclaimer:
This strategy is for educational purposes only. Past results do not guarantee future performance. Always backtest and forward-test before going live.
📲 Next Steps:
This example demonstrates the Gold (XAU/USD) optimisation. The Illyad Strategy can be tuned for any forex pair, index, or commodity with proper optimisation.
👉 Visit my profile for full automation solutions.
Riskmangement
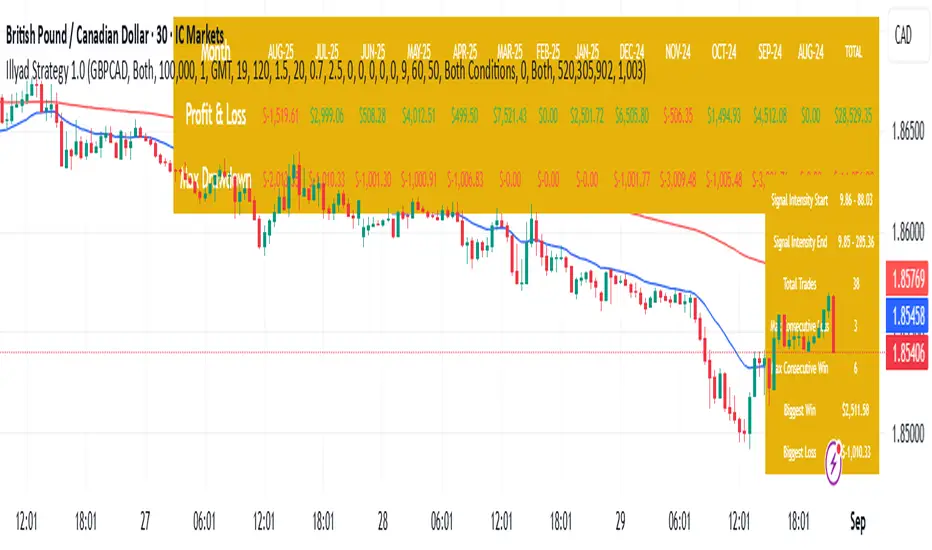
Optimised GBP/CAD (IC Markets, 30m) - Automated TradingHere’s the Illyad Strategy 1.0 optimised for GBP/CAD on the 30-minute timeframe (IC Markets feed).
📊 Backtest Results (Jan 2024 – Aug 2025):
✅ Total P&L: +28,529.35 CAD (+28.53%)
📉 Max Drawdown: 3.61% (3,822.27 CAD)
🔁 Total Trades: 38
📈 Win Rate: 50.00% (19/38 trades)
⚖️ Profit Factor: 2.49
This setup shows strong performance with low drawdown, making it well-suited for prop firm trading and long-term portfolio compounding.
🔧 Optimisation Notes:
Works best on the 30-minute timeframe.
Each symbol has unique volatility and structure. To maximise results, you must optimise the algo per symbol (e.g., GBP/CAD vs EUR/USD vs NASDAQ).
Parameters such as moving averages, signal intensity, and SL/TP levels should be tuned to the instrument.
💡 Best Use Cases:
Prop firm challenges (FTMO, AquaFunded, MyForexFunds alternatives).
Running across multiple accounts simultaneously for compounding.
Automated execution via TradingView alerts → MT5 integration.
⚠️ Disclaimer:
This script is provided for educational purposes only. Past results do not guarantee future performance. Always backtest and forward-test on demo before live trading.
📲 Next Steps:
This version demonstrates the GBP/CAD optimisation. The Illyad Strategy can be tuned to work on any symbol (forex, indices, or stocks).
👉 Visit my profile for full automation solutions (TradingView → MT5)
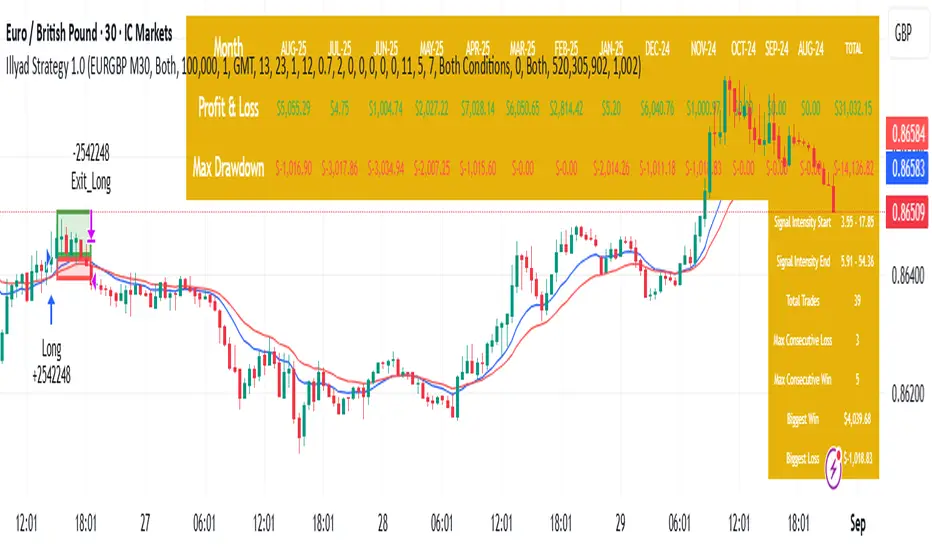
Optimised EURGBP (IC Markets, 30m)Illyad Strategy 1.0 – Optimised EURGBP (IC Markets, 30m)
Description:
This is the Illyad Strategy 1.0 optimised for EURGBP on the 30-minute timeframe (IC Markets feed).
📊 Results (Jan 2024 – Aug 2025):
✅ Total P&L: +£31,032.15 (+31.03%)
📉 Max Drawdown: 2.86% (£3,576.85)
🔁 Total Trades: 39
📈 Win Rate: 58.97%
⚖️ Profit Factor: 2.92
This strategy focuses on controlled drawdown + consistent growth, making it ideal for prop trading challenges and long-term account compounding.
🔧 Optimisation:
Works best on the 30m timeframe.
Each symbol behaves differently — for maximum performance, you should optimise the parameters (MAs, SL/TP, intensity) to the instrument you want to trade.
Example: The EURGBP setup shown here differs from what you’d use on NASDAQ, XAUUSD, or stocks like Tesla.
💡 Best Use Cases:
Passing and scaling prop firm accounts (FTMO, AquaFunded, etc.).
Automated alerts → MT5 integration (hands-free trading).
Consistent, rule-based trading without emotion.
⚠️ Disclaimer:
This script is for educational purposes only. Past results don’t guarantee future performance. Always backtest and forward-test on demo before live trading.
📲 Next Steps:
This version shows the EURGBP optimisation. If you want to run it on other pairs, indices, or stocks → simply optimise parameters for that symbol.
👉 For full automation (TradingView → MT5 execution), check my profile for details.
THE BATATAH SAUCE BTC.PERP TRADING STRAT12hr hour is the sweet spot
great profit factor
decent risk management avg losing (back tested for 5 yrs and does alright till even 2018)trade 8.21% vs avg winning 174.87% (back tested for 5 yrs and does alright since even start2018)
Its alright on daily as well as 6hr but lower just gets more noisy

Dual Channel System [Alpha Extract]A sophisticated trend-following and reversal detection system that constructs dynamic support and resistance channels using volatility-adjusted ATR calculations and EMA smoothing for optimal market structure analysis. Utilizing advanced dual-zone methodology with step-like boundary evolution, this indicator delivers institutional-grade channel analysis that adapts to varying volatility conditions while providing high-probability entry and exit signals through breakthrough and rejection detection with comprehensive visual mapping and alert integration.
🔶 Advanced Channel Construction
Implements dual-zone architecture using recent price extremes as foundation points, applying EMA smoothing to reduce noise and ATR multipliers for volatility-responsive channel widths. The system creates resistance channels from highest highs and support channels from lowest lows with asymmetric multiplier ratios for optimal market reaction zones.
// Core Channel Calculation Framework
ATR = ta.atr(14)
// Resistance Channel Construction
Resistance_Basis = ta.ema(ta.highest(high, lookback), lookback)
Resistance_Upper = Resistance_Basis + (ATR * resistance_mult)
Resistance_Lower = Resistance_Basis - (ATR * resistance_mult * 0.3)
// Support Channel Construction
Support_Basis = ta.ema(ta.lowest(low, lookback), lookback)
Support_Upper = Support_Basis + (ATR * support_mult * 0.4)
Support_Lower = Support_Basis - (ATR * support_mult)
// Smoothing Application
Smoothed_Resistance_Upper = ta.ema(Resistance_Upper, smooth_periods)
Smoothed_Support_Lower = ta.ema(Support_Lower, smooth_periods)
🔶 Volatility-Adaptive Zone Framework
Features dynamic ATR-based width adjustment that expands channels during high-volatility periods and contracts during consolidation phases, preventing false signals while maintaining sensitivity to genuine breakouts. The asymmetric multiplier system optimizes zone boundaries for realistic market behavior patterns.
// Dynamic Volatility Adjustment
Channel_Width_Resistance = ATR * resistance_mult
Channel_Width_Support = ATR * support_mult
// Asymmetric Zone Optimization
Resistance_Zone = Resistance_Basis ± (ATR_Multiplied * )
Support_Zone = Support_Basis ± (ATR_Multiplied * )
🔶 Step-Like Boundary Evolution
Creates horizontal step boundaries that update on smoothed bound changes, providing visual history of evolving support and resistance levels with performance-optimized array management limited to 50 historical levels for clean chart presentation and efficient processing.
🔶 Comprehensive Signal Detection
Generates break and bounce signals through sophisticated crossover analysis, monitoring price interaction with smoothed channel boundaries for high-probability entry and exit identification. The system distinguishes between breakthrough continuation and rejection reversal patterns with precision timing.
🔶 Enhanced Visual Architecture
Provides translucent zone fills with gradient intensity scaling, step-like historical boundaries, and dynamic background highlighting that activates upon zone entry. The visual system uses institutional color coding with red resistance zones and green support zones for intuitive
market structure interpretation.
🔶 Intelligent Zone Management
Implements automatic zone relevance filtering, displaying channels only when price proximity warrants analysis attention. The system maintains optimal performance through smart array management and historical level tracking with configurable lookback periods for various market conditions.
🔶 Multi-Dimensional Analysis Framework
Combines trend continuation analysis through breakthrough patterns with reversal detection via rejection signals, providing comprehensive market structure assessment suitable for both trending and ranging market conditions with volatility-normalized accuracy.
🔶 Advanced Alert Integration
Features comprehensive notification system covering breakouts, breakdowns, rejections, and bounces with customizable alert conditions. The system enables precise position management through real-time notifications of critical channel interaction events and zone boundary violations.
🔶 Performance Optimization
Utilizes efficient EMA smoothing algorithms with configurable periods for noise reduction while maintaining responsiveness to genuine market structure changes. The system includes automatic historical level cleanup and performance-optimized visual rendering for smooth operation across all timeframes.
Why Choose Dual Channel System ?
This indicator delivers sophisticated channel-based market analysis through volatility-adaptive ATR calculations and intelligent zone construction methodology. By combining dynamic support and resistance detection with advanced signal generation and comprehensive visual mapping, it provides institutional-grade channel analysis suitable for cryptocurrency, forex, and equity markets. The system's ability to adapt to varying volatility conditions while maintaining signal accuracy makes it essential for traders seeking systematic approaches to breakout trading, zone reversals, and trend continuation analysis with clearly defined risk parameters and comprehensive alert integration. Also to note, this indicator is best suited for the 1D timeframe.

Lot Size & Risk Calculator [FunkyMax]🔹 Overview
This script is a lot size and risk management calculator directly integrated into your chart.
It automatically determines the optimal position size based on your account balance, chosen risk percentage, and stop-loss distance.
In addition to risk calculation, the script also displays Entry, Stop-Loss, and Take-Profit levels on the chart, along with a dashboard panel summarizing all key trading information:
Account balance
Selected risk %
Amount at risk
Optimal lot size
Stop & TP distances in pips
Risk/Reward ratios (R:R)
Potential profit for each TP
Contract size & pip size
🔹 Key Features
✅ Automatic lot size calculation based on:
Account balance
Risk %
Stop-Loss distance
✅ Clear visual display:
Dynamic labels for Entry, Stop, and TP (supports 1 or 2 TPs)
Colored lines (green for TP, red for SL, blue for Entry)
Profit/Loss zones filled on the chart
✅ Dashboard panel:
Compact summary displayed on-screen (position customizable)
Real-time automatic updates
✅ Automatic asset detection:
Forex: contract size = 100,000 (pip = 0.0001 or 0.01 for JPY pairs)
Gold (XAUUSD): contract size = 100 (pip = 0.1)
Indices & crypto: contract size = 1 (pip = 1.0)
Manual override available (custom contract & pip size)
✅ Multi-currency support:
Display in USD or EUR
🔹 How to Use
Add the indicator to your chart then define entry price, stop-loss, Take-Profit targets (TP1 & TP2) by clicking directly on chart. Then, configure settings of the indicator as needed :
1. Basic settings (Money Management tab):
Enter your account balance (e.g., $1000).
Select your risk percentage (e.g., 1%, 2%, 3%).
Choose your deposit currency (USD or EUR).
2. Trading levels (Levels tab):
Set your Entry price.
Define your Stop-Loss (SL).
Add up to two Take-Profit targets (TP1 / TP2).
3. Chart display:
Toggle levels on/off with Display TP & SL on chart.
Levels appear automatically with lot size and R:R ratio.
4. Dashboard (Dashboard tab):
Choose text size (Normal / Small).
Position the info panel anywhere (top/bottom/left/right).
🔹 Benefits
Time-saving: no more manual lot size calculations
Risk control: enforces consistent money management
Versatility: works across Forex, Gold, Indices, Crypto
Clarity: instant visualization of risk and potential reward
🔹 Limitations
Pip value may vary depending on your broker (CFDs, Futures, etc.). Double-check with your platform.
Educational purpose only: this script is not financial advice.
🔹 Author
Script developed and optimized by FunkyMax.

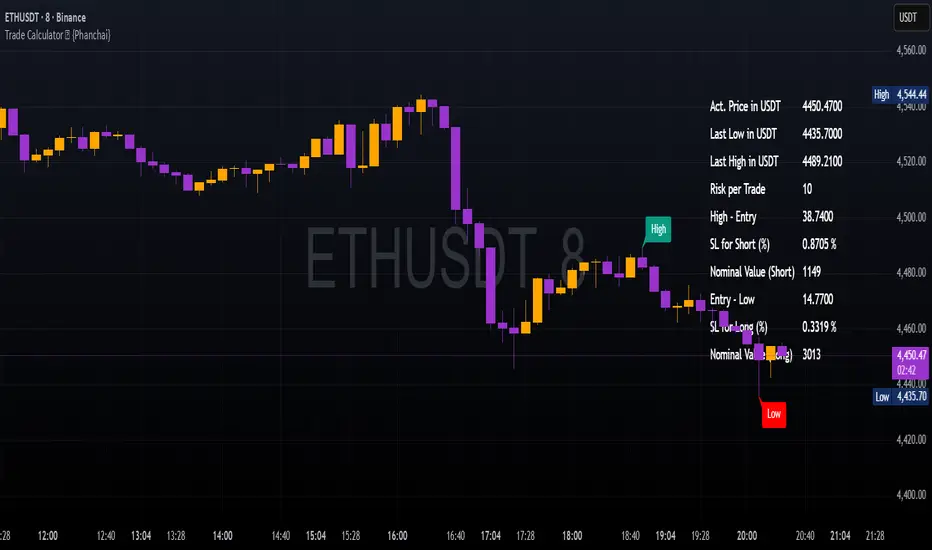
Trade Calculator {Phanchai}Trade Calculator 🧮 {Phanchai} — Documentation
A lightweight sizing helper for TradingView that turns your risk per trade into an estimated maximum nominal position size — using the most recent chart low as your stop reference. Built for speed and clarity right on the chart.
Key Features
Clean on-chart info table with configurable font size and position.
Row toggles: show/hide each line (Price, Last Low, Risk per Trade, Entry − Low, SL to Low %, Max. Nominal Value in USDT).
Configurable low reference: Last N bars or Running since load .
Low label placed exactly at the wick of the lowest bar (no horizontal line).
Custom padding: add extra rows above/below and blank columns left/right (with custom whitespace/text fillers) to fine-tune layout.
Integer display for Risk per Trade (USDT) and Max. Nominal Value (USDT); decimals configurable elsewhere.
Open source script — easy to read and extend.
How to Use
Add the indicator: open TradingView → Indicators → paste the source code → Add to chart.
Pick your low reference in settings:
Last N bars — uses the lowest low within your chosen lookback.
Running since load — tracks the lowest low since the script loaded.
Set your capital and risk:
Total Capital — your account size in USDT.
Max. invest Capital per Trade (%) — your risk per trade as a percent of Total Capital.
Tidy the table:
Use Table Position and Table Size to place it.
Add Extra rows/columns and set left/right fillers (spaces allowed) for padding.
Toggle individual rows (on/off) to show only what you need.
Read the numbers:
Act. Price in USDT — current close.
Last Low in USDT — stop reference price.
Risk per Trade — whole-USDT value of your risk budget for this trade.
Entry − Low — absolute risk per unit.
SL to Low (%) — percentage distance from price to low.
Max. Nominal Value in USDT — estimated max nominal position size given your risk budget and stop at the low.
Scope
This calculator is designed for long trades only (stop below price at the chart low).
Notes & Assumptions
Does not factor fees, funding, slippage, tick size, or broker/venue position limits.
“Running since load” updates as new lows appear; “Last N bars” uses only the selected lookback window.
If price equals the low (zero distance), sizing will be undefined (division by zero guarded as “—”).
Risk Warning
Trading involves substantial risk. Always double-check every value the calculator shows, confirm your stop distance, and verify position sizing with your broker/platform before entering any order. Never risk money you cannot afford to lose.
Open Source & Feedback
The source code is open. If you spot a bug or have an idea to improve the tool, feel free to share suggestions — I’m happy to iterate and make it better.
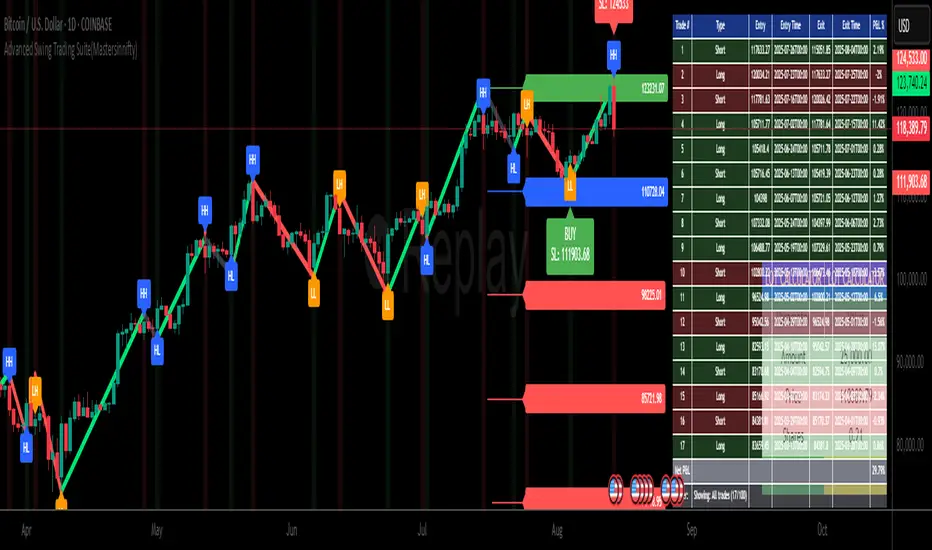
Advanced Swing Trading Suite(Mastersinnifty)🔹 Core Logic
The Advanced Swing Trading Suite is a complete framework for analyzing and trading market swings.
It combines:
A modified QQE momentum engine (adapted from the original QQE by © Peter_O under MPL 2.0).
RSI-based trend strength filter for validation.
Zigzag-driven swing structure detection (higher highs, higher lows, lower highs, lower lows).
Dynamic trade and risk management modules for practical execution.
By merging momentum, structure, and risk control, this tool goes beyond standalone indicators and provides a structured decision-support system for swing traders.
🔹 Uniqueness
While the QQE concept is freely available, this script builds an integrated swing trading ecosystem that adds multiple layers of functionality:
Swing structure analyzer that maps price action into HH, HL, LH, LL patterns in real time.
Dynamic percentage-based trade table that automatically logs entries, exits, P&L %, and timestamps.
Lot size calculator that converts account capital into position size per trade.
Swing extensions and retracement projections for planning targets.
Momentum confirmation via a tuned QQE + RSI engine.
This makes it not just an indicator, but a complete swing trading suite.
🔹 Key Features
✔ Modified QQE + RSI Momentum Filter → Early trend confirmation.
✔ Real-Time Swing Structure Labels (HH, HL, LH, LL) → Clear market context.
✔ Trade Performance Table → Tracks signals with percentage P&L and timing.
✔ Lot Size Calculator → Position sizing based on account capital.
✔ Dynamic Stops & Targets → Swing highs/lows as stops, extensions for projections.
✔ Alerts Ready → Configurable buy/sell alerts.
✔ Visual Labels → Background highlighting and trade markers.
🔹 How to Use
Entries: Green background = Long entry, Red background = Short entry.
Structure: HH/HL/LH/LL labels mark evolving swing structure.
Trade Table: Displays performance stats of past signals.
Risk Control: Use lot size calculator for instant position sizing.
Targets: Refer to swing extensions for profit zones.
Alerts: Set alerts for buy/sell triggers to receive notifications.
🔹 Disclaimer
This script integrates a modified version of QQE by © Peter_O (MPL 2.0 License).
Original QQE source: mozilla.org
All additional modules (swing analyzer, trade table, lot calculator, extensions) are original contributions by Mastersinnifty.
⚠️ Trading Disclaimer:
This script is for educational purposes only and does not constitute financial advice. Past performance is not indicative of future results. Always conduct your own research, test thoroughly, and trade with proper risk management.
Risk & Money Calculator / Fixed Losses This indicator is designed for people who want to control their losses as precisely as possible!
It allows you to quickly calculate the potential loss on a position, taking commission into account. It's designed so that you can have a fixed loss with different stop-loss lengths by adjusting the position size, expressed in currency!
Next to the Stop Loss price, you'll see the percentage distance to the stop and the actual loss, including the double commission (for opening and closing).
The indicator is very easy to use. You select the trade direction, enter the entry price, and the Stop Loss price. Optionally, you can set a Take Profit price to visualize the profit percentage! Since commission is charged both when opening and closing a position, you need to specify the size of your one-way commission.
Important!
• DON'T FORGET ABOUT LIQUIDATION, WHICH HAPPENS BEFORE THE CORRESPONDING STOP LOSS PERCENTAGE IS REACHED!
• YOU ARE SOLELY RESPONSIBLE FOR YOUR CALCULATIONS AND LOSSES!
• IF YOU HAVE ANY WISHES OR SUGGESTIONS RELATED TO THE INDICATOR'S OPERATION, I'M READY TO LISTEN AND POSSIBLY MAKE CHANGES TO ITS FUNCTIONALITY!

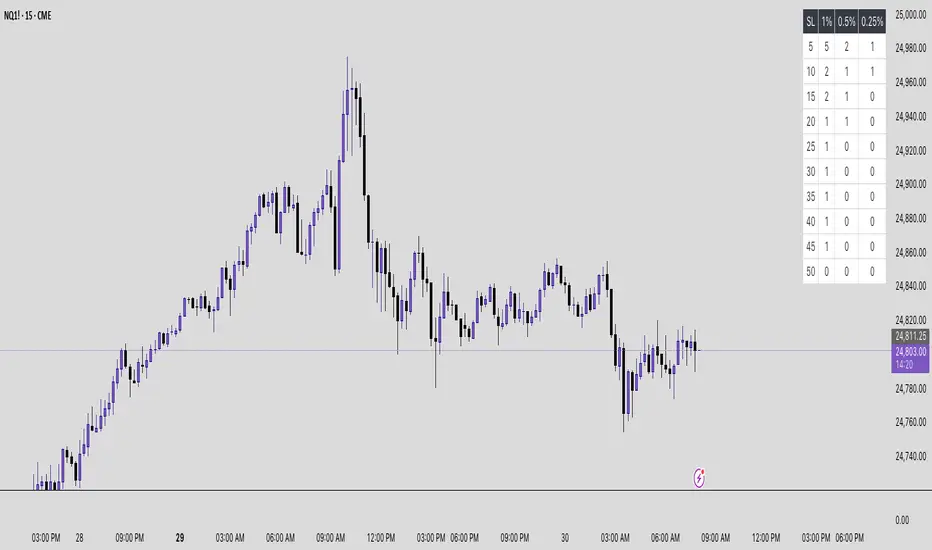
SAFE Leverage x100Safe Leverage x100 is an indicator designed to help traders choose prudent , realistic, and dynamic leverage , adapted to the timeframe and volatility of the asset they are trading.
B ased on rigorous statistical and practical observation , this indicator does not propose fixed rules, but rather provides a visual estimate of the maximum leverage a typical trade can tolerate without being liquidated , based on the current candle's movement range. At the same time, it automatically suggests a more conservative leverage (by default, half of the maximum) for more controlled risk management.
Just identify which asset accepts the maximum x100 and win.!!

Dynamic DCA Envelope – Beta V1.1Dynamic DCA Envelope-Beta V1.1 is a preview version of a Dollar-Cost Averaging (DCA) strategy designed for trending or volatile markets.
-Long Positions Only
-Intended for Cryptocurrency, but can be used in any market
-1 and 4 hour timeframe
-Average Commissions 0.1%-0.3% per trade (Cryptocurrency)
What it does:
This strategy identifies buying opportunities when price closes below a dynamic envelope (based on EMA). After 3 consecutive closes below the lower envelope, the system arms a buy condition. A DCA buy-in is triggered when price bounces by a configurable percentage from the trailing low. The strategy supports up to 3 buy-ins, each equally sized, and closes the entire position at a fixed take profit or stop loss.
How it works:
-Entry logic is based on price deviation from an EMA envelope
-Waits for 3 closes below the envelope to detect weakness
-Uses bounce percentage from the lowest point to trigger each buy
-Includes cooldown logic between buys to avoid clustering
-All positions are closed when TP or SL is hit
How to use it:
-Use on trending assets with volatility (e.g., crypto, tech stocks)
-Adjust inputs to match asset behavior:
-EMA Length
-Envelope Offset %
-Bounce % (Trailing DCA)
-Take Profit / Stop Loss
-View strategy performance in the Strategy Tester tab
What’s unique:
Unlike most DCA scripts that immediately average down, this version includes:
-Trigger logic requiring multiple closes below trend
-Bounce-based entry to avoid catching a falling knife
-Cooldown resets to prevent overtrading
-A true entry–wait–buy–reset loop mimicking disciplined execution
*This is a beta version intended as a preview. A full Pro version is in development, which includes:
-SmartScaling logic
-Trailing take profit
-Multi-symbol scanning
-Backtest range limits
-Risk-adjusted filtering

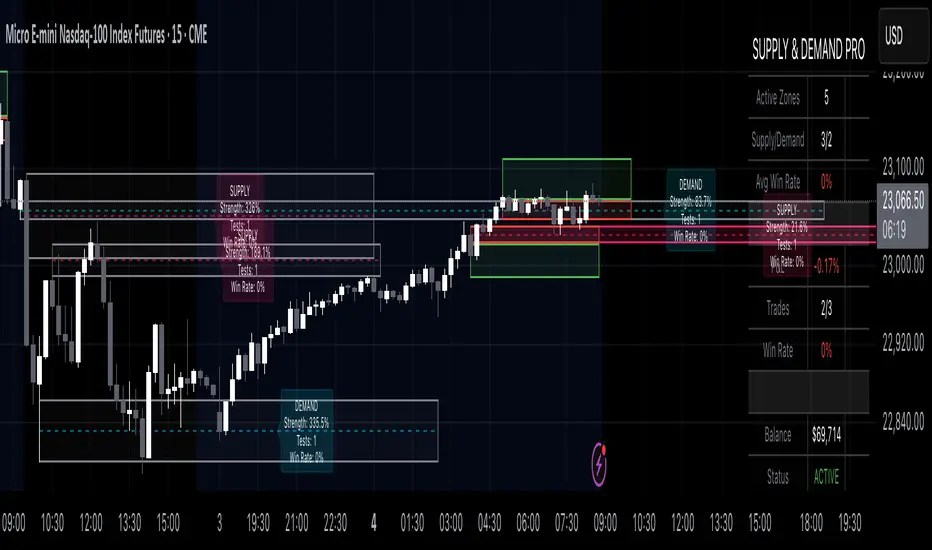
Supply & Demand Pro [Institutional]🎯 Overview
The most comprehensive Supply & Demand indicator on TradingView, designed for serious traders and prop firm professionals. Unlike traditional S&D indicators that just draw pretty zones, this system tracks actual performance metrics, provides entry/exit signals, and includes professional risk management tools.
❓ Why This Indicator?
After extensive research into what traders actually need (not just want), this indicator addresses the TOP complaints about Supply & Demand trading:
- ❌ "I don't know which zones to trust" → ✅ Each zone shows historical win rate
- ❌ "No clear entry/exit rules" → ✅ Multiple entry methods with visual R:R
- ❌ "Can't backtest effectiveness" → ✅ Full performance tracking
- ❌ "Too many false signals" → ✅ Quality filters and volume validation
🚀 Key Features
🎯 Professional Zone Detection
- Volume Profile Analysis (finds institutional accumulation/distribution)
- Swing Point Detection (classic pivot-based zones)
- Order Flow Analysis (coming in v2)
- Hybrid Mode (combines multiple methods)
📊 Performance Analytics
- Individual zone win rates
- Daily P&L tracking
- Account balance simulation
- Success/failure ratio for each zone
- Historical performance data
💼 Prop Firm Tools
- Daily loss limits (auto-stops trading)
- Position sizing controls
- Maximum concurrent positions
- Daily profit targets
- Clean reporting for evaluations
🎨 Entry & Risk Management
- Zone Edge entry (immediate)
- 50% Retracement entry (patient)
- Momentum Confirmation entry
- Visual Risk:Reward boxes
- Multiple stop loss methods (ATR, Fixed %, Zone-based)
📈 Advanced Features
- Auto-removes failed zones
- Volume confirmation requirements
- Strength-based zone ranking
- Smart alerts for high-probability setups
- Multi-timeframe compatibility
📋 How It Works
1. Zone Creation: Continuously scans for high-quality supply/demand zones using your selected method
2. Quality Filtering: Each zone must pass strength, volume, and historical performance filters
3. Visual Feedback: Zones display strength %, test count, and win rate directly on chart
4. Trade Signals: When price touches a zone, the system calculates entry, stop, and target
5. Performance Tracking: Every zone touch is tracked to build historical win rates
⚙️ Quick Settings Guide
For Beginners:
- Detection Method: "Swing Points"
- Min Zone Strength: 15%
- Risk:Reward: 2:1
- Entry Method: "Zone Edge"
For Advanced Traders:
- Detection Method: "Volume Profile"
- Min Zone Strength: 20%
- Min Win Rate: 50%
- Entry Method: "Momentum Confirm"
For Prop Firm Traders:
- Enable all Prop Firm Tools
- Set Daily Loss Limit to your drawdown rules
- Max Positions: 2-3
- Use "Professional" theme for screenshots
📊 What Makes This Different?
Traditional S&D Indicators:
- Draw zones based on one method
- No performance tracking
- No entry/exit rules
- Can't verify effectiveness
Supply & Demand Pro:
- Multiple detection methods
- Tracks win rate for EVERY zone
- Clear entry/exit signals
- Full backtesting capability
- Risk management built-in
🎓 Best Practices
1. Start Conservative: Use higher strength requirements (20%+) until familiar
2. Trust the Data: Zones with 3+ tests and 60%+ win rate are golden
3. Respect Risk Limits: The daily loss limit feature will save your account
4. Volume Matters: Zones with volume confirmation are significantly stronger
5. Be Patient: Wait for high-probability setups (check the win rate!)
🔔 Alert Options
- Zone Touch Alerts (with strength & win rate)
- High Probability Setups (60%+ win rate zones)
- Daily Limit Warnings
- Risk Management Alerts
💡 Pro Tips
- Combine with market structure for best results
- Higher timeframe zones are more reliable
- Watch for zones that align with round numbers
- Use partial profits feature to lock in gains
- Review daily performance to improve
🐛 Troubleshooting
- No zones appearing? → Lower Min Zone Strength to 10%
- Too many zones? → Increase strength requirement or enable filters
- Win rates not updating? → Zones need multiple tests to calculate
⚡ Performance Note
This indicator uses advanced calculations and may take a moment to load on lower-end devices. The comprehensive analytics are worth the wait!
🎁 Bonus Features
- 4 Professional themes
- Customizable dashboard
- R:R visualization
- Zone strength ranking
- Session-based filtering (coming soon)
📧 Support & Updates
This is an actively maintained indicator. Updates include:
- New detection methods
- Enhanced analytics
- Community-requested features
- Performance optimizations
⭐ If you find this indicator helpful, please leave a rating and comment with your results!
📌 Remember: No indicator is perfect. Always use proper risk management and never risk more than you can afford to lose.
SAFE Leverage x50Description:
Safe Leverage x50 is an indicator designed to help traders choose prudent, realistic, and dynamic leverage, adapted to the timeframe and volatility of the asset they are trading.
Based on rigorous statistical and practical observation, this indicator does not propose fixed rules, but rather provides a visual estimate of the maximum leverage a typical trade can tolerate without being liquidated, based on the current candle's movement range. At the same time, it automatically suggests a more conservative leverage (by default, half of the maximum) for more controlled risk management.

Futures Risk Contract TableFutures risk table for NQ MNQ YM MYM ES and MES
changeable capital and risk percentage along with points.
PRO Investing - Quant AlphaCentauri D |XLF|PRO Investing - Quant AlphaCentauri D |XLF|
1. Summary and Core Concept
This is a quantitative backtesting strategy engineered specifically for the Financial Select Sector SPDR Fund (XLF) on the Daily (1D) timeframe. The name "AlphaCentauri" reflects its goal: to seek alpha by identifying statistically significant opportunities through rigorous time series analysis.
The strategy's core principle is to move beyond conventional technical indicators and instead analyze the underlying structure and character of price data. It is designed to methodically identify conditions that have historically preceded sustained directional trends in the financial sector.
2. The Analytical Process: How It Works
This strategy employs a multi-stage quantitative process to filter for high-probability setups. It is a "mashup" of statistical concepts applied to price action.
Structural Pattern Recognition: The engine's primary function is to analyze the historical price series of XLF to identify specific, recurring structural patterns. It examines price geometry and cyclical behavior to find formations that often act as the foundation for a new, emerging trend.
Signal Execution: A signal to enter a trade is only generated when the findings from both the structural analysis and the validation stages are in agreement. This disciplined, multi-layered approach ensures the strategy remains flat during periods of high uncertainty and only engages when its quantitative criteria are fully met.
3. How to Use This Strategy
Timeframe: This strategy has been designed, tested, and optimized exclusively for the Daily (1D) timeframe on the XLF ticker. Its logic is not intended for other timeframes or assets and may produce unreliable results if used differently.
On-Chart Signals: The strategy's operation is transparent. It plots all historical buy and sell entries, along with their corresponding exits, directly on the chart for easy performance review and analysis.
4. Risk Management: The Strategy's Foundation
This strategy is built upon a foundation of strict, non-negotiable risk management, which is reflected in its code and backtesting parameters. This design complies with TradingView's guidelines for publishing realistic and responsible strategies.
Dynamic Stop-Loss and Position Sizing: A stop-loss is dynamically calculated for each trade based on recent market volatility. The strategy then automatically adjusts the position size for that trade to target a defined risk percentage. In cases of extreme market volatility, the maximum potential loss on a single trade may approach, but is designed not to exceed, 5% of total account equity. Under normal market conditions, the risk for most trades will be below this maximum threshold.
Realistic Backtesting Parameters:
Initial Capital: The backtest defaults to an initial capital of $100,000.
Commission: A realistic fee of $5.00 per order is included to simulate broker costs.
5. Disclaimer
This strategy is an educational tool provided for informational and research purposes. It is not financial advice. All trading carries a high level of risk, and past performance is not a guarantee of future results. You are solely responsible for your own trading decisions and risk management. Always conduct your own due diligence before deploying any trading strategy in a live account.

Risk Context + Position SizingWhat This Indicator Does (And Doesn't Do)
This is NOT a buy/sell signal indicator. Instead, it's a risk management tool that helps you understand two critical things:
How volatile the market is right now (compared to recent history)
How much you should risk on your next trade based on that volatility
The Core Problem It Solves
Imagine you always risk the same amount on every trade - say $100. But sometimes the market is calm and predictable, other times it's wild and unpredictable. This indicator says: "Hey, the market is going crazy right now - maybe only risk $70 instead of your usual $100."
How It Works
Measures Market "Nervousness"
Uses ATR (Average True Range) to measure how much prices typically move each day
Compares today's volatility to the past 100 days
Shows you a percentile (0-100%) - higher = more volatile
Categorizes Risk Environment
LOW (green): Market is calm, you can size up slightly
NORMAL: Standard conditions, use your normal position size
HIGH (red): Market is jumpy, reduce your position size
EXTREME (dark red): Market is in chaos, significantly reduce size
Important Disclaimers
This doesn't predict price direction - it only measures current market stress
You still need a trading strategy - this just helps you size it properly
Past volatility doesn't guarantee future volatility
Always combine with proper stop losses and risk management
ATR Dynamic Stop (Table + Plot + ATR %)📊 This script displays dynamic stop levels based on ATR, designed for active traders.
Features:
- Shows long and short stop levels (price ± ATR × multiplier).
- Displays values as a floating table on the top-right corner.
- Optional plot lines directly on the chart.
- Option to calculate based on realtime price or last close.
- Displays the ATR value both in price units and as a percentage of the selected price.
- Fully customizable table: text size, text color, background color.
Inputs:
- ATR Multiplier and Length.
- Show/hide stop lines on the chart.
- Select price source (realtime or last close).
- Table appearance options.
Ideal for:
- Traders who want a clear visual stop guide.
- Combining volatility with risk management.

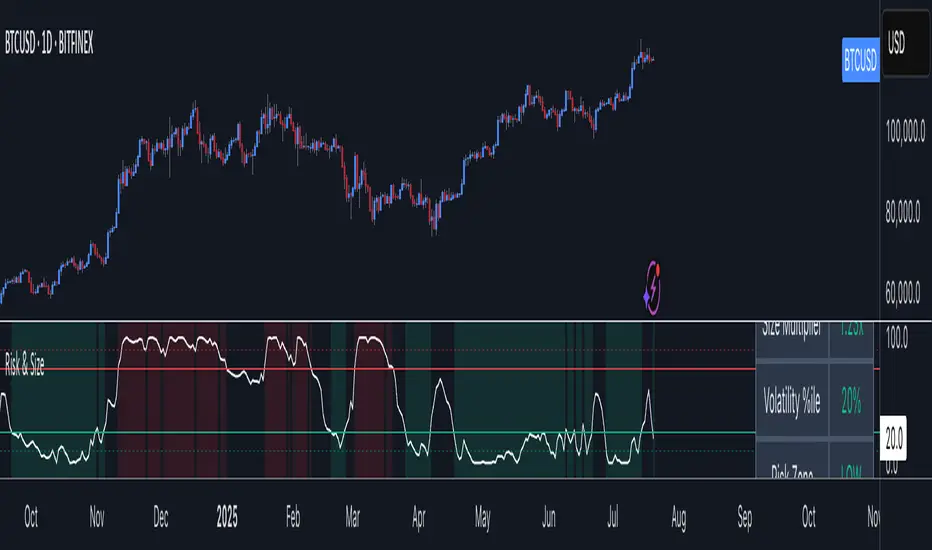
RISK ROTATION MATRIX ║ BullVision [3.0]🔍 Overview
The Risk Rotation Matrix is a comprehensive market regime detection system that analyzes global market conditions across four critical domains: Liquidity, Macroeconomic, Crypto/Commodities, and Risk/Volatility. Through proprietary algorithms and advanced statistical analysis, it transforms 20+ diverse market metrics into a unified framework for identifying regime transitions and risk rotations.
This institutional-grade system aims to solve a fundamental challenge: how to synthesize complex, multi-domain market data into clear, actionable trading intelligence. By combining proprietary liquidity calculations with sophisticated cross-asset analysis.
The Four-Domain Architecture
1. 💧 LIQUIDITY DOMAIN
Our liquidity analysis combines standard metrics with proprietary calculations:
Proprietary Components:
Custom Global Liquidity Index (GLI): Unique formula aggregating central bank assets, credit spreads, and FX dynamics through our weighted algorithm
Federal Reserve Balance Proxy: Advanced calculation incorporating reverse repos, TGA fluctuations, and QE/QT impacts
China Liquidity Proxy: First-of-its-kind metric combining PBOC operations with FX-adjusted aggregates
Global M2 Composite: Custom multi-currency M2 aggregation with proprietary FX normalization
2. 📈 MACRO DOMAIN
Sophisticated integration of global economic indicators:
S&P 500: Momentum and trend analysis with custom z-score normalization
China Blue Chips: Asian market sentiment with correlation filtering
MBA Purchase Index: Real estate market health indicator
Emerging Markets (EEMS): Risk appetite measurement
Global ETF (URTH): Worldwide equity exposure tracking
Each metric undergoes proprietary transformation to ensure comparability and regime-specific sensitivity.
3. 🪙 CRYPTO/COMMODITIES DOMAIN
Unique cross-asset analysis combining:
Total Crypto Market Cap: Liquidity flow indicator with custom smoothing
Bitcoin SOPR: On-chain profitability analysis with adaptive periods
MVRV Z-Score: Advanced implementation with multiple MA options
BTC/Silver Ratio: Novel commodity-crypto relationship metric
Our algorithms detect when crypto markets lead or lag traditional assets, providing crucial timing signals.
4. ⚡ RISK/VOLATILITY DOMAIN
Advanced volatility regime detection through:
MOVE Index: Bond volatility with inverse correlation analysis
VVIX/VIX Ratio: Volatility-of-volatility for regime extremes
SKEW Index: Tail risk measurement with custom normalization
Credit Stress Composite: Proprietary combination of credit spreads
USDT Dominance: Crypto flight-to-safety indicator
All risk metrics are inverted and normalized to align with the unified scoring system.
🧠 Advanced Integration Methodology
Multi-Stage Processing Pipeline
Data Collection: Real-time aggregation from 20+ sources
Normalization: Custom z-score variants accounting for regime-specific volatility
Domain Scoring: Proprietary weighting within each domain
Cross-Domain Synthesis: Advanced correlation matrix between domains
Regime Detection: State-transition model identifying four market phases
Signal Generation: Composite score with adaptive smoothing
🔁 Composite Smoothing & Signal Generation
The user can apply smoothing (ALMA, EMA, etc.) to highlight trends and reduce noise. Smoothing length, type, and parameters are fully customizable for different trading styles.
🎯 Color Feedback & Market Regimes
Visual dynamics (color gradients, labels, trails, and quadrant placement) offer an at-a-glance interpretation of the market’s evolving risk environment—without forecasting or forward-looking assumptions.
🎯 The Quadrant Visualization System
Our innovative visual framework transforms complex calculations into intuitive intelligence:
Dynamic Ehlers Loop: Shows current position and momentum
Trailing History: Visual path of regime transitions
Real-Time Animation: Immediate feedback on condition changes
Multi-Layer Information: Depth through color, size, and positioning
🚀 Practical Applications
Primary Use Cases
Multi-Asset Portfolio Management: Optimize allocation across asset classes based on regime
Risk Budgeting: Adjust exposure dynamically with regime changes
Tactical Trading: Time entries/exits using regime transitions
Hedging Strategies: Implement protection before risk-off phases
Specific Trading Scenarios
Domain Divergence: When liquidity improves but risk metrics deteriorate
Early Rotation Detection: Crypto/commodity signals often lead broader markets
Volatility Regime Trades: Position for mean reversion or trend following
Cross-Asset Arbitrage: Exploit temporary dislocations between domains
⚙️ How It Works
The Composite Score Engine
The system's intelligence emerges from how it combines domains:
Each domain produces a normalized score (-2 to +2 range)
Proprietary algorithms weight domains based on market conditions
Composite score indicates overall market regime
Smoothing options (ALMA, EMA, etc.) optimize for different timeframes
Regime Classification
🟢 Risk-On (Green): Positive composite + positive momentum
🟠 Weakening (Orange): Positive composite + negative momentum
🔵 Recovery (Blue): Negative composite + positive momentum
🔴 Risk-Off (Red): Negative composite + negative momentum
Signal Interpretation Framework
The indicator provides three levels of analysis:
Composite Score: Overall market regime (-2 to +2)
Domain Scores: Identify which factors drive regime
Individual Metrics: Granular analysis of specific components
🎨 Features & Functionality
Core Components
Risk Rotation Quadrant: Primary visual interface with Ehlers loop
Data Matrix Dashboard: Real-time display of all 20+ metrics
Domain Aggregation: Separate scores for each domain
Composite Calculation: Unified score with multiple smoothing options
Customization Options
Selective Metrics: Enable/disable individual components
Period Adjustment: Optimize lookback for each metric
Smoothing Selection: 10 different MA types including ALMA
Visual Configuration: Quadrant scale, colors, trails, effects
Advanced Settings
Pre-smoothing: Reduce noise before final calculation
Adaptive Periods: Automatic adjustment during volatility
Correlation Filters: Remove redundant signals
Regime Memory: Hysteresis to prevent whipsaws
📋 Implementation Guide
Setup Process
Add to chart (optimized for daily, works on all timeframes)
Review default settings for your market focus
Adjust domain weights based on trading style
Configure visual preferences
Optimization by Trading Style
Position Trading: Longer periods (60-150), heavy smoothing
Swing Trading: Medium periods (20-60), balanced smoothing
Active Trading: Shorter periods (10-40), minimal smoothing
Best Practices
Monitor domain divergences for early signals
Use extreme readings (-1.5/+1.5) for high-conviction trades
Combine with price action for confirmation
Adjust parameters during major events (FOMC, earnings)
💎 What Makes This Unique
Beyond Traditional Indicators
Multi-Domain Integration: Only system combining liquidity, macro, crypto, and volatility
Proprietary Calculations: Custom formulas for GLI, Fed, China, and M2 proxies
Adaptive Architecture: Dynamically adjusts to market regimes
Institutional Depth: 20+ integrated metrics vs typical 3-5
Technical Innovation
Statistical Normalization: Custom z-score variants for cross-asset comparison
Correlation Management: Prevents double-counting related signals
Regime Persistence: Algorithms to identify sustainable vs temporary shifts
Visual Intelligence: Information-dense display without overwhelming
🔢 Performance Characteristics
Strengths
Early regime detection (typically 1-3 weeks ahead)
Robust across different market environments
Clear visual feedback reduces interpretation errors
Comprehensive coverage prevents blind spots
Optimal Conditions
Most effective with 100+ bars of history
Best on daily timeframe (4H minimum recommended)
Requires liquid markets for accurate signals
Performance improves with more enabled components
⚠️ Risk Considerations & Limitations
Important Disclaimers
Probabilistic system, not predictive
Requires understanding of macro relationships
Signals should complement other analysis
Past regime behavior doesn't guarantee future patterns
Known Limitations
Black swan events may cause temporary distortions
Central bank interventions can override signals
Requires active management during regime transitions
Not suitable for pure technical traders
💎 Conclusion
The Risk Rotation Matrix represents a new paradigm in market regime analysis. By combining proprietary liquidity calculations with comprehensive multi-domain monitoring, it provides institutional-grade intelligence previously available only to large funds. The system's strength lies not just in its individual components, but in how it synthesizes diverse market information into clear, actionable trading signals.
⚠️ Access & Intellectual Property Notice
This invite-only indicator contains proprietary algorithms, custom calculations, and years of quantitative research. The mathematical formulations for our liquidity proxies, cross-domain correlation matrices, and regime detection algorithms represent significant intellectual property. Access is restricted to protect these innovations and maintain their effectiveness for serious traders who understand the value of comprehensive market regime analysis.

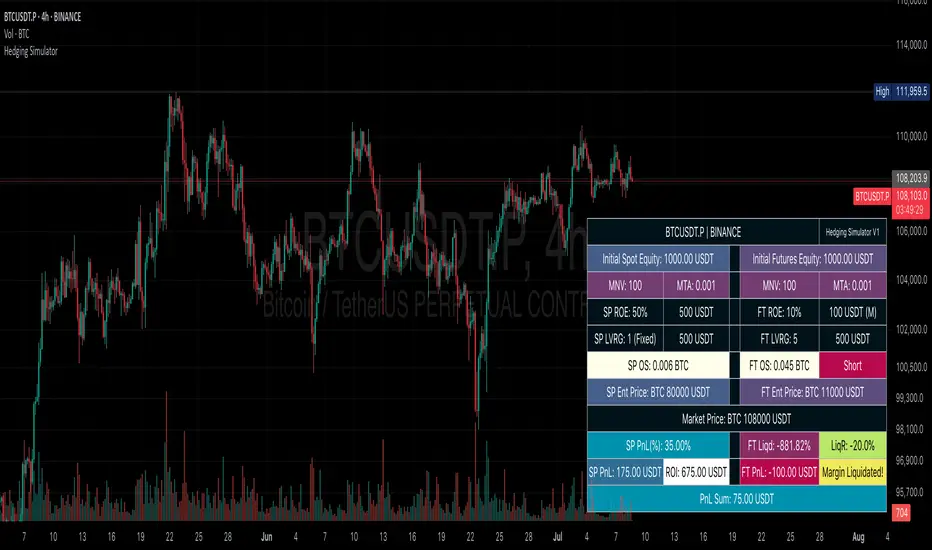
Hedging SimulatorHedging Simulator
The Hedging Simulator is a straightforward hedging tool designed to simulate potential profit and loss outcomes from combined Spot and Futures positions in the cryptocurrency market.
Users can define their equity allocation separately for both spot and futures, allowing for flexible and realistic scenario modelling.
The tool also incorporates MNV (Minimum Notional Value) and MTA (Minimum Trade Amount) parameters to estimate order sizes based on symbol-specific trading rules set by exchanges. While the results may differ slightly from actual exchange calculations, the simulator aims to provide a close approximation for general understanding.
📌Note: Crypto-Only - This tool is designed specifically for cryptocurrency trading and is not intended for use with traditional financial instruments.
Entry Price: Users can input custom entry prices for both spot and futures trades to simulate from specific market positions.
Live Price: The entry price fields for both spot and futures support Live Price based on the currently viewed symbol on your chart.
📌Note: In the real market, spot and futures prices are not always identical—there can be a price gap between them. While the difference is typically small, it's important to understand that the live price shown is only for rough estimation purposes and may not reflect the exact trading price on your chosen exchange.
Expecting Market Price: This represents the projected or target price to simulate potential profit and loss across the hedged position based on market movement.
📌Note: Profit and loss calculations exclude all trading fees. Actual results in live markets may vary due to fees, slippage, and exchange rules.
Feedback: If you notice any bugs, errors on calculation, or have suggestions for better calculations or new features, feel free to share your thoughts. Your feedback helps improve the tool and will be considered for future updates.
⚠️ Disclaimer: This simulator is intended for educational and illustrative purposes only. It does not constitute financial advice or guarantee trading results. Market conditions may vary, and all trading carries inherent risks. Users are solely responsible for any decisions made based on this tool and bear full responsibility for their own trading outcomes.
Volatility & Market Regimes [AlgoXcalibur]Analyze Market Conditions Like a Pro.
Volatility & Market Regimes is a specialized, institution-inspired indicator designed to help traders instantly identify the current conditions of the market with clarity and confidence.
By combining a real-time Volatility Histogram and Strength Line with a compact Regime Table, this tool reveals four essential market dimensions—Volatility, Strength, Participation, and Noise—in a clean and intuitive format. Whether you’re confirming trade setups or managing risk, knowing the current regimes enhances awareness across all assets and timeframes.
🧠 Algorithm Logic
This sophisticated tool continuously monitors four independent regimes, each reflecting a distinct dimension of market behavior:
• Volatility – Gauges how active or dormant the market is by comparing current price action movement to historical averages. A dynamic, color-gradient Volatility Histogram transitions from Low (ice blue/white) to Medium (green/yellow) to High (orange/red), giving you an immediate assessment of volatility and risk.
• Strength – Measures directional intensity by assessing trend momentum, pressure, and persistence. A color-gradient Strength Line ranges from weak (red) to strong (green), helping traders determine if directional strength is trending, weakening, or consolidating.
• Participation – Analyzes relative volume to assess the level of trader engagement. Higher volume indicates stronger participation and conviction, while low volume may signal uncertainty, fading momentum, or even liquidity traps.
• Noise – Evaluates structural stability by measuring how orderly or chaotic the price action is. High noise suggests choppy, unstable conditions, while low noise reflects clean, stable moves.
Each regime includes a High / Medium / Low classification and a color-coded directional arrow to indicate whether condition parameters are increasing or decreasing. Together, these components deliver real-time market context—helping you stay grounded in logic, not emotion.
⚙️ User-Selectable Features
Each component of the indicator—the Volatility Histogram, Strength Line, and Regime Table—can be independently made visible or hidden to match your preference. This flexibility allows you to display only the Regime Table and move it directly to your main chart, where it auto-positions to the center-right and integrates seamlessly with other AlgoXcalibur indicators that also use data tables for a cohesive and refined experience.
📊 Clarity, Not Guesswork
Volatility & Market Regimes is a unique, institution-inspired algorithm rarely seen in retail trading. Not only does it clearly display volatility—it translates complex market behavior into a clear context to reveal what’s happening behind the candles. By decoding core regimes in real-time, this tool transforms uncertainty into structured insight—empowering traders to act with clarity, not guesswork.
🔐 To get access or learn more, visit the Author’s Instructions section.

Economic Event Timer & Alerts [AlgoXcalibur]Stay ahead of market-moving news with this real-time event tracker and countdown alert system.
This essential algorithm displays critical scheduled events that may influence sudden spikes in market volatility, helping you stay aware and reduce exposure to unpredictable moves before they even happen. Featuring a captivating on-chart display with event titles, adjustable time zone, real-time countdowns, and live alert notifications — you’ll always know what’s ahead — so you can prepare, not react.
🧠 Algorithm Logic
The Economic Event Timer & Alerts system delivers critical market awareness through an array of integrated functions. At its core, a live countdown table provides real-time updates on the day’s scheduled economic events, with dynamic, color-coded countdowns that ensure fast and easy interpretation at a glance. Complementing the table, Countdown Alerts notify you 30 minutes, 10 minutes, and 1 minute prior to each event—giving you clear, timely reminders without the need to constantly monitor your chart. The adjustable time zone input supports ET, CT, MT, PT, or UTC, so the displayed time-of-event aligns with your trading session. Rigorously refined, the algorithm updates the table daily—and clearly displays No Scheduled Events Today to provide certainty and reassurance on days without scheduled events. Packaged in a minimalist, unobtrusive design, the tool remains visually clean and focused for serious traders.
Updated automatically for hassle-free peace of mind.
⚙️ Features
• Time Zone Selector: Easily toggle between time zones to match your trading session.
• Countdown Alerts: Enable real-time notifications to keep you informed and aware of events without having to monitor the chart.
• Update & Expiration Awareness Feature:
This innovative feature includes a simple visual and alert system that prompts you when it’s time to reload the indicator & recreate alerts — ensuring your alerts are always tied to the latest data update.
🔄 Update Available
On the final day of current event data, the indicator will:
• Display Update Available on the indicator’s table
• Send an alert at 4:00 PM ET reminding you to reload & recreate alerts
You can load the updated version anytime that day.
⛔ Expired
If not reloaded, the next day the indicator will:
• Display an EXPIRED banner on the indicator’s table
• Send a Data Expired alert every day at 8:30 AM ET that prompts you to recreate alerts, until you do or disable the alert.
This prevents missing event alerts unknowingly.
Why is this feature necessary?
Even though the indicator is updated when necessary (typically every 2–4 weeks) to provide upcoming event data automatically, TradingView alerts do not auto-update —they stay tied to the version of the script that was active when the alert was created.
This thoughtful refinement is designed to ensure your alerts remain synced to current events and ready for when it matters most.
🚨 Protect Your Capital
At AlgoXcalibur, we understand that the best way to be profitable is to avoid unnecessary risk.
Dedicated to empowering traders with insight that matters, we designed this tool to transform inconvenient economic calendars into effortless, essential information—displayed directly on your chart. Whether you’re managing open positions or timing new trades, knowing when impactful events are about to hit is crucial to being proactive, protecting capital, and trading with confidence. This is not a technical analysis indicator—this is a risk management tool that provides traders with a fundamental edge.
Built for traders who value risk management, market awareness, and algorithm automation.
🔐 To get access or learn more, visit the Author’s Instructions section.

Future is hereOverview
"Future is Here" is an original, multi-faceted Pine Script indicator designed to provide traders with a comprehensive toolset for identifying high-probability trading opportunities. By integrating volatility-based entry zones, trend-based price targets, momentum confirmation, dynamic support/resistance levels, and risk-reward ratio (RRR) calculations, this indicator offers a cohesive and actionable trading framework. Each feature is carefully designed to complement the others, ensuring a synergistic approach that enhances decision-making across various market conditions. This script is unique in its ability to combine these elements into a single, streamlined interface with clear visual cues and customizable alerts, making it suitable for both novice and experienced traders.
Key Features and How They Work Together
Volatility-Based Entry Zones
Purpose: Identifies overbought and oversold conditions using a volatility-adjusted moving average, helping traders spot potential reversal zones.
Mechanism: Utilizes a user-defined volatility length and multiplier to calculate dynamic overbought/oversold thresholds based on the standard deviation of price. Crossovers and crossunders of these levels trigger "Buy Zone" or "Sell Zone" labels.
Synergy: These zones act as the foundation for entry signals, which are later confirmed by momentum and trend filters to reduce false signals.
Trend-Based Price Targets
Purpose: Projects potential price targets based on the prevailing trend, giving traders clear objectives for profit-taking.
Mechanism: Combines a fast and slow moving average to determine trend direction, then calculates target prices using a multiplier of the price deviation from the slow MA. Labels display bullish or bearish targets when the fast MA crosses the slow MA.
Synergy: Works in tandem with entry zones and momentum signals to align targets with market conditions, ensuring traders aim for realistic price levels supported by trend strength.
Momentum Confirmation
Purpose: Validates entry signals by assessing momentum strength, filtering out weak setups.
Mechanism: Uses the momentum indicator to detect bullish or bearish momentum crossovers, labeling them as "Strong" or "Weak" based on a comparison with a smoothed momentum average.
Synergy: Enhances the reliability of buy/sell signals by ensuring momentum aligns with volatility zones and trend direction, reducing the risk of premature entries.
Dynamic Support/Resistance Levels
Purpose: Highlights key price levels where the market is likely to react, aiding in trade planning and risk management.
Mechanism: Detects pivot highs and lows over a user-defined lookback period, drawing horizontal lines for the most recent support and resistance levels (limited to two each for clarity). Labels mark these levels with price values.
Synergy: Complements entry zones and price targets by providing context for potential reversal or continuation points, helping traders set logical stop-losses or take-profits.
Buy/Sell Signals with Risk-Reward Ratios
Purpose: Generates precise buy/sell signals with integrated take-profit (TP), stop-loss (SL), and RRR calculations for disciplined trading.
Mechanism: Combines volatility zone crossovers, trend confirmation, and positive momentum to trigger signals. ATR-based TP and SL levels are calculated, and the RRR is displayed in labels for quick assessment.
Synergy: This feature ties together all previous components, ensuring signals are only generated when volatility, trend, and momentum align, while providing clear risk-reward metrics for trade evaluation.
Customizable Alerts
Purpose: Enables traders to stay informed of trading opportunities without constant chart monitoring.
Mechanism: Alert conditions are set for buy and sell signals, delivering notifications with the entry price for seamless integration into trading workflows.
Synergy: Enhances usability by allowing traders to act on high-probability setups identified by the indicator’s combined logic.
Originality
"Future is Here" is an original creation that distinguishes itself through its holistic approach to technical analysis. Unlike single-purpose indicators, it integrates volatility, trend, momentum, and support/resistance into a unified system, reducing the need for multiple scripts. The inclusion of RRR calculations directly in signal labels is a unique feature that empowers traders to evaluate trade quality instantly. The script’s design emphasizes clarity and efficiency, with cooldowns to prevent label clutter and a limit on support/resistance lines to maintain chart readability. This combination of features, along with its customizable parameters, makes it a versatile and novel tool for traders seeking a robust, all-in-one solution.
How to Use
Setup: Add the indicator to your TradingView chart and adjust input parameters (e.g., Volatility Length, Trend Length, TP/SL Multipliers) to suit your trading style and timeframe.
Interpretation:
Look for "Buy Zone" or "Sell Zone" labels to identify potential entry points.
Confirm entries with "Bull Mom" or "Bear Mom" labels and trend direction (Bull/Bear Target labels).
Use Support/Resistance lines to set logical TP/SL levels or anticipate reversals.
Evaluate Buy/Sell signals with TP, SL, and RRR for high-probability trades.
Alerts: Set up alerts for Buy/Sell signals to receive real-time notifications.
Customization: Fine-tune multipliers and lengths to adapt the indicator to different markets (e.g., stocks, forex, crypto) or timeframes.

Risk and Position Sizing📏 Why Position Size Should Be Based on Risk?
Let’s say you are ready to lose 1,000 in a trade. Based on your stop loss level, you can calculate how many shares (or quantity) to buy, so that if the stop hits, you only lose that ₹1,000.
This is called risk-based position sizing. It makes your trade size dynamic — small when SL is wide, bigger when SL is tight. No more random position sizes — just systematic.
Portfolio size is multiplied by the selected risk % to get money risk per trade.
This amount is then used to calculate how many shares can be bought for the given stop-loss.
So chose your portfolio size in settings. Default Portfolio size is 1,00,000 .
You can select your risk % per portfolio in the settings — for example:
0.25% for conservative style
0.5% to 1% for balanced traders
1.25% or 1.5% for aggressive ones (not recommended for beginners)
This script will automatically calculate how much quantity you should buy, for each stop-loss scenario.
📈 Progressive & Inverse-Progressive Risk Styles
Some traders follow progressive position sizing — they start with small risk when the trend is just starting, and increase the risk % as the trend confirms.
Others follow inverse-progressive sizing — they take high risk at early stages of a bull market, and reduce risk as the trend matures (when upside becomes limited).
📌 This script allows you to manually control the risk % in settings, so you can adjust it based on your trading phase and style.
📋 Three SL Scenarios – Choose What Matches Your Style
The table shows three different stop-loss conditions, and for each one it calculates:
Today’s Low – tightest stop loss
Yesterday’s Low – slightly safer, ideal for short-term swing trades
EMA Stop (configurable) – gives more breathing room.
You can visually compare all 3 in the table and choose whichever fits your strategy and comfort.
Also, you can customize:
Theme: dark or light
Font size
Table position (upper/lower corners)
🧠 Designed for traders who take risk management seriously.
Let this script handle the math. You focus on execution.
Happy Trading!
– LensOfChartist
