GoM Scalping Pro V1.20 GoM Scalping Pro — Smart ALMA Signal System
GoM Scalping Pro is a professional trading indicator designed to identify high-quality market entries using a smart trend-based signal engine combined with volatility filtering and built-in risk visualization.
The indicator automatically highlights **potential BUY and SELL opportunities and displays structured trading levels directly on the chart, making it suitable for scalping, intraday, and short-term swing trading.
🔹 Key Features
Smart trend-based signal detection
Volatility filter to avoid low-quality market conditions
Automatic calculation of Entry, Stop Loss, and Take Profit levels
Multiple Take Profit targets for flexible trade management
Clear and uncluttered chart visualization
Customizable alerts (Push / Sound / Popup)
Works on all markets and timeframes
📊 How to Use
Signals appear directly on the chart when market conditions are valid
Follow the displayed Entry, SL, and TP levels for structured execution
Can be combined with your own market context or risk rules
The indicator is designed to assist decision-making, not to replace trading discipline.
🎯 Recommended Markets
For best performance, use on liquid instruments such as:
Major Forex pairs
Gold (XAUUSD)
Major indices (US500, NAS100)
Bitcoin (BTCUSD)
⚙️ Alerts
Enable alerts to receive real-time notifications when new signals are detected.
This allows you to monitor multiple instruments efficiently without staring at charts.
⚠️ Disclaimer
This indicator is a technical analysis tool, not financial advice.
Always test settings on a demo account and manage risk carefully.
If you want, I can also provide:
a shorter “store-style” description
a premium / institutional tone version
or a version optimized for conversions on TradingView
Risk-management

Axiom Flow: Donsma NQ/MNQ - 5 Min TFThis is a proprietary algorithmic trading framework engineered specifically for the Mini and
Micro Nasdaq (MNQ) futures market on the 5-minute timeframe. Designed for the modern quantitative trader, this system filters market noise to identify high-probability momentum expansions during key liquidity windows.
Unlike standard indicators that repaint or lag, this framework utilizes a "Confirmed Close" logic engine, meaning it waits for structural validation before signaling an entry. It is designed to be a complete decision-support system, automating the complex analysis of trend alignment, volatility, and momentum.
How It Works (The Logic) The system relies on a 4-Stage Verification Protocol:
Structural Trend Validation: Uses a proprietary dual-layer breakout logic to ensure price is not just fluctuating within a range but has broken significant structural resistance or support levels.
Volatility Compression Filter: Entries are restricted to periods of specific volatility conditions. The system identifies "energy build-up" phases and triggers only when statistical probability favors an expansion (breakout), avoiding over-extended markets.
The "Anti-Chop" Protocol: A custom-built filter measures the efficiency of price movement. If the market is "chopping" sideways with low directional energy, the system remains neutral, protecting capital from false signals common in range-bound environments.
Velocity Override: A secondary high-impact logic layer detects institutional volume flow and rapid price displacement, allowing the strategy to capture fast-moving news events that standard trend filters might miss.
Risk Management (Automated)
Fixed Risk Sizing: The logic is calibrated for 1-Contract fixed sizing to demonstrate raw performance consistency.
Adaptive Profit Targets: Unlike static targets, this system uses Dynamic Volatility Scoring to calculate profit objectives. It aims for larger runners during high-volatility sessions and banks tighter profits during slower sessions.
Liquidity Window Lock: Execution is hardcoded to the New York Session (Open to Lunch) to ensure maximum liquidity and reduce slippage risks.
Disclaimer This script is for educational and backtesting purposes only. Past performance in the strategy tester is not indicative of future results. Trading futures and derivatives involves substantial risk of loss and is not suitable for every investor. This tool is designed to assist your own technical analysis, not to replace independent judgment.

Quality-Controlled Trend StrategyOverview
This strategy demonstrates a clean, execution-aware trend framework with fully isolated risk management.
Entry conditions and risk logic are intentionally separated so risk parameters can be adjusted without altering signal behavior.
All calculations are evaluated on confirmed bars to ensure backtest behavior reflects real-time execution.
Design intent
Many scripts mix entries and exits in ways that make results fragile or misleading.
This strategy focuses on structural clarity by enforcing:
confirmed-bar logic only
fixed and transparent risk handling
consistent indicator calculations
one position at a time
It is intended as a baseline framework rather than an optimized system.
Trading logic (high level)
Trend context
EMA 50 vs EMA 200 defines directional bias
Entry
Price alignment with EMA 50
RSI used as a momentum confirmation, not as an overbought/oversold signal
Risk management
Stop-loss based on ATR
Fixed risk–reward structure
Risk logic is isolated from entry logic
Editing risk without affecting signals
All stop-loss and take-profit calculations are handled in a dedicated block.
Users can adjust:
ATR length
stop-loss multiplier
risk–reward ratio
without modifying entry conditions.
This allows controlled experimentation while preserving signal integrity.
Usage notes
Results vary by market, timeframe, and volatility conditions.
This script is provided for testing and educational purposes and should be validated across multiple symbols and forward-tested before use in live environments.

ML-Inspired Adaptive Momentum Strategy (TradingView v6)This strategy demonstrates an adaptive momentum approach using volatility-normalized trend strength. It is designed for educational and analytical purposes and uses deterministic, fully transparent logic compatible with Pine Script v6.
ML-Inspired Concept (Educational Context)
Pine Script cannot train or execute real machine-learning models.
Instead, this strategy demonstrates ML-style thinking by:
Converting price data into features
Normalizing features to account for volatility differences
Producing a bounded confidence score
Applying thresholds for decision making
This is not predictive AI and does not claim forecasting capability.
Strategy Logic
EMA is used to measure directional bias
EMA slope represents momentum change
ATR normalizes the slope (feature scaling)
A clamped score between −1 and +1 is generated
Trades trigger only when the score exceeds defined thresholds
Risk & Execution
Position size capped at 5% equity
Commission and slippage included for realistic testing
Signals are calculated on closed bars only
Purpose
This script is intended to help traders explore adaptive momentum concepts and understand how feature normalization can be applied in systematic trading strategies.

Live Position Sizer (LPS)Description (EN)
(Magyar leíráshoz görgess lejjebb!)
Live Position Sizer (LPS) is a discretionary trading utility designed to visualize risk, reward, and position size directly on the chart in real time.
The indicator draws a TradingView-style long or short position box and calculates the required position size based on your defined capital, maximum risk, stop-loss distance, and a user-defined lot conversion factor.
LPS is intended strictly as a decision-support and risk management tool. It does not place trades or generate automated signals.
Core features:
Automatic Long / Short position visualization
Dynamic Entry, Stop Loss, and Take Profit levels
Real-time position size calculation
Configurable Risk/Reward ratio
Fully customizable colors, transparency, and line styles
Clean, minimal on-chart labels showing direction, RR, and lot size
Only one active position box at a time for a clutter-free chart
Position sizing logic:
TradingView internally calculates position size in units, not broker-specific lots.
To bridge this difference, LPS uses a user-defined “Units per 1 Lot” multiplier.
Examples:
Forex (standard lot): 100000
Gold (XAUUSD): 1 or 100 (broker dependent)
Indices (e.g. NAS100): 1
The indicator first calculates the position size in TradingView units and then converts it to lots using this multiplier.
The displayed lot size is rounded to 0.01 lots.
Stop Loss logic:
The Stop Loss level is derived from the High or Low of a selectable previous candle.
Increasing the bar-back value places the Stop Loss further away, which:
increases stop distance
reduces position size for the same risk
Intended use:
Manual / discretionary trading
Risk management and position sizing
Trade planning and visualization
Educational purposes
Important notes:
This indicator does not execute trades
No alerts or automation by default
Lot size and contract specifications vary by broker
Always verify the exact lot or contract size with your broker before trading
------------------------------------
Description (HU)
A Live Position Sizer (LPS) egy diszkrecionális kereskedést támogató segédindikátor, amely valós időben jeleníti meg a kockázatot, a célárat és a pozícióméretet közvetlenül a charton.
Az indikátor TradingView-stílusú long vagy short pozíció boxot rajzol, és kiszámolja a szükséges pozícióméretet a megadott tőke, maximális kockázat, stop-loss távolság és egy felhasználó által definiált LOT szorzó alapján.
Az LPS nem stratégia, kizárólag döntéstámogató és kockázatkezelési eszköz.
Fő funkciók:
Automatikus Long / Short pozíció megjelenítés
Entry, Stop Loss és Take Profit szintek vizuális ábrázolása
Valós idejű pozícióméret számítás
Állítható Risk/Reward arány
Teljesen testreszabható színek, átlátszóság és vonalstílus
Letisztult chart label (irány, RR, lot méret)
Egyszerre csak egy aktív pozíció box
Pozícióméretezési logika:
A TradingView belsőleg egységekben (units) számol, nem bróker-specifikus LOT-okban.
Ennek kezelésére az LPS egy „Units per 1 Lot” beállítást használ.
Példák:
Forex standard lot: 100000
Arany (XAUUSD): 1 vagy 100 (brókertől függ)
Indexek (pl. NAS100): 1
Az indikátor először TradingView egységekben számol, majd ezt átváltja LOT-ra a megadott szorzó segítségével.
A kijelzett LOT méret 0.01-re van kerekítve.
Stop Loss logika:
A Stop Loss szint a kiválasztott korábbi gyertya high vagy low értékéből kerül meghatározásra.
Nagyobb bar-back érték:
távolabb helyezi a stopot
azonos kockázat mellett kisebb pozícióméretet eredményez
Ajánlott felhasználás:
Manuális, diszkrecionális kereskedés
Kockázatkezelés és pozícióméretezés
Trade tervezés
Oktatási célok
Fontos megjegyzések:
Az indikátor nem köt automatikusan
Alapértelmezetten nincs alert vagy automatizmus
A LOT és contract méret brókerenként eltérhet
Kereskedés előtt mindig ellenőrizd a pontos LOT / contract specifikációt a brókerednél

15M Breakout Strategy [1M Structure] V1Description
Overview This indicator is a custom 15-minute breakout structure visualizer designed specifically for the 1-minute timeframe. It identifies the start of every new 15-minute block and marks the structure of the very first 1-minute candle within that block to define an immediate Scalping setup.
How it Works
Vertical Separators: Automatically draws vertical lines marking every 15-minute interval, helping traders visualize higher timeframe sessions on lower timeframe charts.
Entry & Risk Model:
Green Candle Start: Sets a Long Entry at the Close and Stop Loss (SL) at the Low of the first 1M candle.
Red Candle Start: Sets a Short Entry at the Close and Stop Loss (SL) at the High of the first 1M candle.
Target Calculation: Automatically projects a Take Profit (TP) level based on a 1:2 Risk-to-Reward Ratio.
Live Tracking: Lines extend dynamically bar-by-bar until price hits either the TP or SL, or until the next 15-minute block begins.
Smart Labels: Displays "TP Hit" or "SL Hit" labels with the exact pip count (based on a standard 1 Point = 10 Pips calculation) at the moment the trade concludes.
Features
History Control: Users can define how many past setups remain visible to keep the chart clean (Default: 20).
Custom Styling: Fully customizable colors, line widths, and text sizes for labels.
Clean Visuals: Labels are designed without background boxes to minimize chart clutter.
Use Case Ideal for scalpers looking to catch the initial momentum of a new 15-minute candle using tight 1-minute entries.

ATR Tick Targets (Daily + Intraday)ATR Tick Targets (Daily + Intraday)
This indicator calculates ATR-based tick targets and stops using both intraday ATR and daily ATR, then converts the result directly into tick distances relative to the current price.
It’s designed for traders who think in ticks rather than raw price units, especially futures traders (e.g., MGC, ES, NQ, CL, etc.).
🔍 What it does
✔️ Calculates:
Intraday ATR
Daily ATR
A combined ATR value (user-selectable)
✔️ Converts ATR → ticks using the symbol’s minimum tick size
✔️ Plots:
ATR-based long TP / SL
ATR-based short TP / SL
✔️ Displays:
tick distances for TP and SL
ATR values used in calculation
optional label shifted to the right of price
⚙️ ATR combination methods
You can choose how ATR is derived:
Intraday only
Daily only
Average (default)
Max (more conservative stops / larger targets)
This allows you to match your volatility model to your trading style.
🎯 Typical use cases
This tool is useful if you:
set fixed tick SL/TP from ATR
scale target size with volatility
trade futures or tick-based markets
want a volatility-aware RR framework
want targets that expand in trends and contract in chop
It does not generate trade signals. It simply provides objective ATR-based distances that you can plug into your own strategy.
👁️ Visual control
Options include:
show/hide lines
show only current + previous bar
show full historical levels
toggle long/short model independently
offset info label to avoid covering candles
⚠️ Notes
Works on any timeframe
Tick values depend on the symbol’s minimum tick size
Intended for analysis, not guaranteed execution distances

IV vs Realised Volatility (VIX/HV Comparator)VIX / HV Comparator – Implied vs Realised Volatility
This indicator compares Implied Volatility (IV) from a volatility index (VIX, India VIX, etc.) with the Realised / Historical Volatility (HV) of the current chart symbol.
It helps you see whether options are pricing volatility as rich or cheap relative to what the underlying is actually doing.
What it does
Pulls IV from any user-selected vol index symbol (e.g. CBOE:VIX for SPX, NSEINDIA:INDIAVIX for Nifty).
Calculates realised volatility from the chart’s price data using returns over a user-defined lookback.
Annualises HV so IV and HV are displayed on the same percentage scale, on any timeframe (intraday or higher).
Optionally shows an IV/HV ratio in a separate pane to highlight when options are rich or cheap relative to realised volatility.
How to read it
Main panel:
Orange line – Implied Volatility (IV) from your chosen vol index.
Aqua line – Realised / Historical Volatility (HV) of the current chart symbol.
Fill between lines:
Green shading -> IV > HV -> options are priced richer than what the underlying is currently realising.
Red shading -> HV > IV -> realised vol is higher than the options market is implying.
Sub-panel (optional):
IV / HV ratio
- Above 1 -> IV > HV (vol rich).
- Below 1 -> IV < HV (vol cheap).
- Horizontal guides (for example 1.2 / 0.8) help frame “significantly rich/cheap” zones.
A small label on the latest bar displays the current IV, HV and their difference in vol points.
Inputs (key ones)
IV Index Symbol – choose the volatility index that corresponds to your underlying (VIX, India VIX, etc.).
Realised Vol Lookback – number of bars used to compute HV (for example 20).
Trading Days per Year and Active Hours per Day – used for annualising HV so it stays consistent across timeframes.
IV Scale Factor – adjust if your IV index is quoted in decimals (0.15) instead of points (15).
Practical uses
Context for options trades – Quickly see if current IV is high or low relative to realised volatility when deciding on strategies (premium selling vs buying, spreads, hedges).
Vol regime analysis – Track shifts where HV starts to rise above IV (real stress building) or IV spikes far above HV (fear premium / insurance bid).
Cross-timeframe checks – Use on intraday charts for short-term trading context, or on daily/weekly charts for bigger picture vol regimes.
This tool is not a stand-alone signal generator. It is meant to be a volatility dashboard you combine with your usual price action, trend, and options strategy rules to understand how the options market is pricing risk vs what the underlying is actually delivering.

XAU BUY/SELL Scalping Strategy M5 PROFX:XAUUSD
This XAU/USD Pro Scalping Strategy is tailored specifically for the M5 timeframe , designed to capture rapid Gold price movements. Instead of relying on lagging indicators, this system utilizes advanced Price Action and Market Structure analysis to identify high-probability entry zones.
The core strength of this strategy lies in its built-in Money Management engine and Multi-threaded Trailing Stop system, ensuring capital preservation and profit maximization.
🚀 Key Features:
1. Smart Price Action Recognition:
The algorithm scans for specific market scenarios to apply dynamic Risk:Reward ratios (ranging from 1:1 to 1:3).
Filters out noise and false breakouts using multi-candle analysis.
Auto Position Sizing:
Calculates trade quantity automatically based on your defined Risk % per Trade .
Ensures consistent risk management regardless of the Stop Loss distance.
Intelligent Trailing Stop:
Uses a dynamic trailing mechanism based on "R" multiples (Risk Units).
Automatically secures profits by moving SL based on the specific setup type ("Case") of each trade.
Safety Filters:
Min SL and Max SL inputs prevent trades during periods of extremely low volatility or excessive risk.
⚙️ Settings:
Risk % per Trade: The percentage of equity to risk per trade (Recommended: 1.0% - 2.0%).
Min/Max SL Points: Dynamic boundaries for Stop Loss to adapt to current market volatility.
💡 Recommendations:
Symbol: XAUUSD / Gold - FXCM.
Timeframe: M5.
Best performance during London and New York sessions.

Goal Setting Strategies Viprasol# 🎯 Goal Setting Strategies Viprasol
A powerful goal tracking tool designed for disciplined traders who want to monitor their trading objectives, milestones, and progress directly on their charts.
## ✨ KEY FEATURES
### 📊 Flexible Goal Management
- Track anywhere from 1 to 20 trading goals simultaneously
- Adjustable goal count via simple input slider
- Each goal has its own unique emoji identifier
- Real-time progress counter
### ✅ Visual Tracking System
- Interactive checkbox system for goal completion
- Clear visual indicators (✅ completed, ⬜️ pending)
- Customizable goal names and descriptions
- Dynamic progress display
### 🎨 Full Customization
- **4 Position Options**: Top Left, Top Right, Bottom Left, Bottom Right
- **5 Font Sizes**: Tiny, Small, Normal, Large, Huge (optimized for all screen sizes)
- **Custom Colors**: Header, labels, background, achievement text
- **Premium Styling**: Modern cyber-themed design with professional appearance
### 💡 Perfect For:
- Daily/Weekly trading goal tracking
- Risk management milestones
- Profit target monitoring
- Trading plan compliance
- Personal development objectives
- Learning milestones
## 🔧 HOW TO USE
1. **Set Your Primary Goal**: Enter your main objective in "Primary Goal" field
2. **Choose Goal Count**: Select how many goals you want (1-20)
3. **Name Your Goals**: Customize each goal name in the "Goal Definitions" section
4. **Track Progress**: Check off goals as you complete them
5. **Customize Display**: Adjust colors, sizes, and position to match your chart setup
## 📐 INPUT GROUPS
### 🎯 Viprasol Goal Configuration
- Primary Goal Name
- Number of Goals (1-20)
### 📋 Goal Definitions
- All 20 goals with individual names and checkboxes
- Only enabled goals (based on count) will display
### 🌈 Premium Styling
- Goal Header Color
- Label Color
- Panel Background Color
- Achievement Color
- Header Font Size
- Milestone Font Size (Tiny/Small optimized for space)
### 📍 Elite Display
- Dashboard Position selector
## 💎 UNIQUE FEATURES
- **Space Efficient**: Tiny and Small font options for compact displays
- **Scalable**: Grow from 1 goal to 20 as your needs evolve
- **Non-Intrusive**: Overlay indicator that doesn't interfere with price action
- **Professional Design**: Clean, modern interface with cyber aesthetic
## 🎓 USE CASES
**Day Traders**: Track daily profit targets, trade count limits, max loss thresholds
**Swing Traders**: Monitor weekly/monthly goals, position management rules
**New Traders**: Learning milestones, strategy development checkpoints
**Experienced Traders**: Advanced risk management, portfolio objectives
## ⚙️ TECHNICAL DETAILS
- Version: Pine Script v5
- Type: Overlay Indicator
- Max Labels: 500
- Table-based display system
- No repainting
- Lightweight performance
## 🚀 GETTING STARTED
1. Add indicator to your chart
2. Set "Number of Goals" to your desired count (start small, scale up)
3. Customize goal names
4. Check boxes as you achieve goals
5. Watch your progress build!
## 📊 DISPLAY OPTIMIZATION
- Use "Tiny" or "Small" for maximum goals on small screens
- Use "Normal" or "Large" for standard monitors
- Use "Huge" for presentation or large displays
- Adjust position to avoid chart overlap
## 🎯 TRADING DISCIPLINE
This tool helps reinforce:
- Goal-oriented trading mindset
- Progress tracking accountability
- Milestone celebration
- Structured approach to trading development
---
**© viprasol**
*Designed for traders who take their goals seriously.*

APEX TREND: Macro & Hard Stop SystemAPEX TREND: Macro & Hard Stop System
The APEX TREND System is a composite trend-following strategy engineered to solve the "Whipsaw" problem inherent in standard breakout systems. It orchestrates four distinct technical theories—Macro Trend Filtering, Volatility Squeeze, Momentum, and Volatility Stop-Loss—into a single, hierarchical decision-making engine.
This script is not merely a collection of indicators; it is a rules-based trading system designed for Swing Traders (Day/Week timeframes) who aim to capture major trend extensions while strictly managing downside risk through a "Hard Stop" mechanism.
🧠 Underlying Concepts & Originality
Many trend indicators fail because they treat all price movements equally. The APEX TREND differentiates itself by applying an "Institutional Filter" logic derived from classic Dow Theory and Modern Volatility Analysis.
1. The Macro Hard Stop (The 200 EMA Logic)
Origin: Based on the institutional mandate that “Nothing good happens below the 200-day moving average.”
Function: Unlike standard super trends that flip constantly in sideways markets, this system integrates a 200-period Exponential Moving Average (EMA) as a non-negotiable "Hard Stop."
Synergy: This acts as the primary gatekeeper. Even if the volatility engine signals a "Buy," the system suppresses the signal if the price is below the Macro Baseline, effectively filtering out counter-trend traps.
2. The Volatility Engine (Squeeze Theory)
Origin: Derived from John Carter’s TTM Squeeze concept.
Function: The script identifies periods where Bollinger Bands (Standard Deviation) contract inside Keltner Channels (ATR). This indicates a period of potential energy build-up.
Synergy: The system only triggers an entry when this energy is released (Breakout) AND coincides with Linear Regression Momentum, ensuring the breakout is genuine.
3. Anti-Chop Filter (ADX Integration)
Origin: J. Welles Wilder’s Directional Movement Theory.
Function: A common failure point for trend systems is low-volatility chop. This script utilizes the Average Directional Index (ADX).
Synergy: If the ADX is below the threshold (Default: 20), the market is deemed "Choppy." The script visually represents this by painting candles GRAY, signaling a "No-Trade Zone" regardless of price action.
4. The "Run Trend" Stop Loss (Factor 4.0 ATR)
Origin: Adapted from the Turtle Trading rules regarding volatility-based stops.
Function: Standard Trailing Stops (usually Factor 3.0) are too tight for crypto or volatile equities on daily timeframes.
Optimization: This system employs a wider ATR Multiplier of 4.0. This allows the asset to fluctuate naturally within a trend without triggering a premature exit, maximizing the "Run Trend" potential.
🛠 How It Works (The Algorithm)
The script processes data in a specific order to generate a signal:
Check Macro Trend: Is Price > EMA 200? (If No, Longs are disabled).
Check Volatility: Is ADX > 20? (If No, all signals are disabled).
Check Volume: Is Current Volume > 1.2x Average Volume? (Confirmation of institutional participation).
Trigger: Has a Volatility Breakout occurred in the direction of the Macro Trend?
Execution: If ALL above are true -> Generate Signal.
🎯 Strategy Guide
1. Long Setup (Bullish)
Signal: Look for the Green "APEX LONG" Label.
Condition: The price must be ABOVE the White Line (EMA 200).
Execution: Enter at the close of the signal candle.
Stop Loss: Initial stop at the Green Trailing Line.
2. Short Setup (Bearish)
Signal: Look for the Red "APEX SHORT" Label.
Condition: The price must be BELOW the White Line (EMA 200).
Execution: Enter at the close of the signal candle.
Stop Loss: Initial stop at the Red Trailing Line.
3. Exit Rules (Crucial)
This system employs a Dual-Exit Mechanism:
Soft Exit (Profit Taking): Close the position if the price crosses the Trailing Stop Line (Green/Red line). This locks in profits during a trend reversal.
Hard Exit (Emergency): Close the position IMMEDIATELY if the price crosses the White EMA 200 Line against your trade. This prevents holding a position during a major market regime change.
⚙️ Settings
Momentum Engine: Adjust Bollinger Band/Keltner Channel lengths to tune breakout sensitivity.
Apex Filters: Toggle the EMA 200 or ADX filters on/off to adapt to different asset classes.
Risk Management: The ATR Multiplier (Default 4.0) controls the width of the trailing stop. Lower values = Tighter stops (Scalping); Higher values = Looser stops (Swing).
Disclaimer: This script is designed for trend-following on higher timeframes (4H, 1D, 1W). Please backtest on your specific asset before live trading.

Average True Range % infoATR% is a modified version of the classic Average True Range indicator that displays price volatility as a percentage of the instrument's value, rather than in absolute values. This allows you to easily compare the volatility of different assets (e.g., Bitcoin vs Tesla stock) regardless of their price.
Main Features
1. ATR% Chart
The red line shows the average volatility from the last N candles (default 14), expressed as a percentage. For example:
ATR% = 2.5% means that the average daily move is approximately 2.5% of the asset's value
Higher values = greater volatility (higher profit potential, but also greater risk)
Lower values = lower volatility (calmer market)
2. Volatility Trend Analysis
The indicator automatically detects whether volatility is rising, falling, or stable:
Up arrow (↑) - volatility is rising (price becomes more "nervous")
Down arrow (↓) - volatility is falling (market is calming down)
Horizontal arrow (⮆) - volatility is stable (within ±3% of the moving average)
3. Information Table
In the upper right corner of the chart you will see Current ATR% value and Trend arrow with color coding:
- Green = rising volatility
- Red = falling volatility
- Gray = stable volatility
Parameters to Configure
Indicator Length (default: 14) - How many candles back to include in calculations:
Lower values (5-10): more sensitive to sudden changes, reacts faster
Higher values (20-30): more smoothed, shows long-term volatility picture
Trend Length (default: 10) - Period to analyze whether volatility is rising/falling:
Lower values: faster trend change signals
Higher values: more reliable, but slower signals
Sample Interpretations
ATR% Volatility Asset Type/Situation
< 1% Very low Stable blue-chip stocks, calm market
1-3% Low-medium Typical stocks, normal conditions
3-5% Medium-high Volatile stocks, cryptocurrencies at rest
5-10% High Cryptocurrencies, penny stocks
> 10% Extremely high Market panic, crash, pump & dump

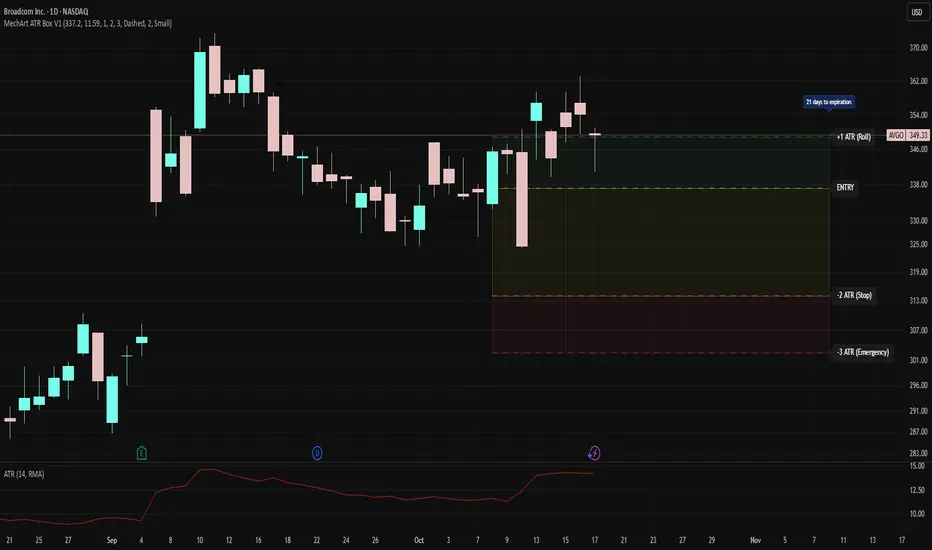
MechArt ATR Box V1MechArt ATR Box V1
Description:
The MechArt ATR Box V1 is a precision trade-planning and risk-management tool that visualizes your entire position framework using customizable ATR-based zones.
It automatically plots your key decision levels from a defined entry price and ATR value — helping you clearly see when to roll, hold, or exit a trade.
Features:
Configurable ATR multipliers for roll, stop, and emergency zones.
Automatically updates labels and price levels based on your custom ATR settings.
Distinct color-coded boxes for:
✅ +1 ATR (Roll Zone) – visualize profit or roll targets.
⚠️ –2 ATR (Stop Zone) – manage risk boundaries.
🚨 –3 ATR (Emergency Stop) – mark hard exit thresholds.
Adjustable ATRs, line style, width, color, and opacity for visual clarity.
Optional Days Until Expiration label for time-sensitive trades.
Ideal for:
Traders using mechanical, ATR driven systems (like OVTLYR Plan M), or anyone who wants a clear, rule-based visualization of risk vs. reward directly on the chart.
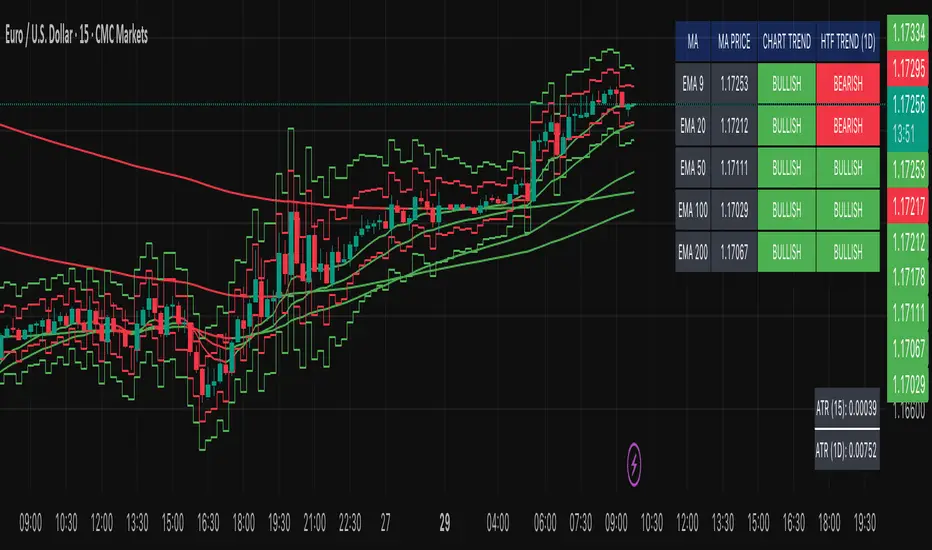
Multi-MA Trend Indicator with ATR by nkChartsThe MMA-ATR is a powerful all-in-one tool that combines multi-timeframe Moving Averages with ATR-based Stop Loss & Take Profit levels. It is designed to help traders quickly assess trend direction, volatility, and potential trade levels in one clean visual setup.
Key Features
Multi-MA Trend Detection
Plots 5 customizable moving averages (choose from EMA, SMA, RMA, WMA, VWMA).
Automatic color coding: Bullish (green), Bearish (red), Neutral (gray).
MA Trend Table with:
MA values
Current chart trend
Higher timeframe (Daily) trend confirmation
ATR-Based Trade Levels
Dynamic Stop Loss (SL) and Take Profit (TP) levels based on ATR multipliers.
Separate visual lines for long and short setups.
ATR Table with:
ATR value for the current chart timeframe
ATR value for the Daily timeframe
Customizations
Choose MA type, length, and price source.
Customize bullish, bearish, and neutral colors.
Adjustable table position and text size.
Fully configurable ATR length, multipliers, and colors.
How to Use
Add the indicator to your chart.
Use the MA Trend Table to identify short-term and higher timeframe trend direction.
Refer to ATR-based SL/TP levels to manage risk and potential profit targets.
Combine both to filter entries and improve trade timing.
Best For
Swing traders and intraday traders who rely on trend confirmation and volatility-based risk management.
Traders looking for a multi-timeframe confirmation system that reduces noise.
⚠️ Disclaimer: This indicator is for educational purposes only. It does not provide financial advice or guarantee profits. Always perform your own analysis before making trading decisions.
Advanced Grid Trading System - [WOLONG X DBG]Overview
This sophisticated grid trading system combines Bollinger Bands breakout analysis with RSI filtering to create a comprehensive automated trading approach. The system implements advanced grid management with dynamic lot sizing, intelligent ATR-based spacing, and comprehensive risk management features including drawdown protection, time-based trading controls, and multi-level position management.
Methodology
The indicator employs a multi-layered analytical approach based on established technical analysis principles:
Core Signal Generation
Bollinger Bands Breakout Engine: Utilizes customizable period Bollinger Bands (default 35) with highest/lowest price detection over the calculation period to identify potential reversal points when price breaks below recent lows or above recent highs
RSI Confirmation Filter: Implements RSI-based signal filtering with customizable maximum RSI values to avoid entries during overbought/oversold conditions, requiring RSI below (50 - max_rsi_value) for buy signals and above (50 + max_rsi_value) for sell signals
Grid Management System: Advanced progressive grid system with configurable pip-based spacing, intelligent ATR-based distance calculation, and cumulative lot sizing with customizable multipliers
Advanced Features
Dynamic Lot Sizing: Eight calculation methods including Fixed Lot, Dynamic by Balance/Equity, and risk-based percentage approaches (Low Risk 20%, Medium Risk 40%, High Risk 80%, Extreme Risk 120%, Margin Loading)
Comprehensive Risk Management: Multi-layered drawdown protection with percentage and absolute value limits, automatic position closure options, and trading suspension features with time-based recovery
Time-Based Controls: Configurable GMT-based trading hours with start/stop times for session-specific trading and market condition adaptation
Key Components
Signal Types
Primary Entry Signals: Buy signals when price breaks below recent lowest values within Bollinger period with RSI confirmation; Sell signals when price breaks above recent highest values with RSI confirmation
Grid Expansion Logic: Automatic additional entries based on configurable pip distances from base price, triggered when price moves against initial position by specified intervals
Take Profit Systems: Dual-mode TP calculation using either weighted average across all positions or individual level TP with customizable pip values
Stop Loss Protection: Grid-wide SL with customizable pip distances or default 1000-pip protection
Visual Elements
Bollinger Bands Display: Three-line Bollinger Bands system with upper, middle (SMA), and lower bands for trend and volatility analysis
Grid Base Line: Yellow dashed line showing initial grid entry level with right extension for reference
Comprehensive TP/SL Lines: Dual-line system showing both first order reference levels (dotted, light colors) and official Martingale weighted average levels (solid, bold colors)
Entry Point Labels: Detailed entry markers showing BUY/SELL direction, grid level, and lot size information
Dual Dashboard System: Main control panel (top-right) and dark theme entry log (bottom-right) with real-time status updates
Usage Instructions
Basic Configuration
Capital Management: Select lot calculation method from dropdown (recommended: "Low Risk 20%" for conservative approach)
Grid Parameters: Configure trading distance (default 35 pips) and enable smart distance for ATR-based dynamic adjustments
Strategy Settings: Set Bollinger period (35), RSI period (20), and maximum RSI value (15) for signal filtering
Risk Controls: Configure maximum drawdown percentage and action when limits are exceeded
Signal Interpretation
Buy Entry Conditions: Generated when current close price breaks below the lowest price in the Bollinger calculation period, with RSI below (50 - max_rsi_value)
Sell Entry Conditions: Generated when current close price breaks above the highest price in the Bollinger calculation period, with RSI above (50 + max_rsi_value)
Grid Expansion: Automatic additional entries when price moves against position by configured pip distances, with progressive lot sizing using multipliers
Exit Conditions: Weighted average TP achievement, breakeven after specified grid levels, or manual cycle completion
Dashboard Analysis
Main Control Panel: Displays current grid level, trading direction, open orders count, total volume, next lot size, grid P&L, current balance, floating drawdown, RSI status, trading hours, and system locks
Dark Theme Entry Log: Shows recent entry history with timestamps, entry types (BUY/SELL), prices, lot sizes, and grid levels for trade tracking
Risk Monitoring: Real-time drawdown tracking with color-coded warnings and automatic protection activation
Risk Management Features
Automatic Protections
Drawdown Limits: Configurable percentage (default 100%) and absolute USD drawdown limits with four response options: Close Orders and Stop 24h/Until Restart, or Prevent New Grid/Until Restart
Position Sizing: Eight dynamic lot calculation methods based on account equity, balance, or risk tolerance with maximum lot size limits
Grid Limitations: Maximum number of grid levels (default 9) to prevent excessive exposure accumulation
Time Controls: GMT-based trading hour restrictions to avoid high-volatility periods or specific market sessions
Confirmation Requirements
Multi-Indicator Alignment: Requires both Bollinger Bands breakout and RSI confirmation before signal generation
Intelligent Spacing: ATR-based grid spacing adjustment using short-term (96-period) vs long-term (672-period) ATR ratio for market volatility adaptation
Progressive Sizing: Configurable lot multipliers for different grid levels (Order 2: 1.0x, Orders 3-5: 2.0x, Orders 6+: 1.5x default)
Optimal Settings
Timeframe Recommendations
Scalping: 1M-5M charts with reduced grid spacing (20-25 pips) and tighter RSI filters
Day Trading: 15M-1H charts with standard settings (35 pips) and default RSI parameters
Swing Trading: 4H-Daily charts with increased spacing (50+ pips) and relaxed RSI filters
Market Conditions
Trending Markets: Reduce RSI maximum value to 10-12, increase grid spacing to 40-50 pips, enable breakeven functionality
Ranging Markets: Standard settings with weighted TP enabled and moderate grid spacing
High Volatility: Enable smart distance, reduce maximum grid levels to 6-7, increase drawdown limits
Advanced Features
Customization Options
Lot Calculation Methods: Eight different approaches from fixed lot (0.01) to risk-based percentage calculations with margin loading options
Grid Multipliers: Separate multiplier settings for different grid levels (2nd order, 3rd-5th orders, 6th+ orders) with decimal precision
TP/SL Configuration: Individual or weighted average TP calculation with positive/negative pip values, breakeven after specified levels
Visual Controls: Toggle options for dashboard display, entry labels, TP/SL lines, lot information, and dark theme components
Technical Specifications
Grid Management: Up to 50 configurable grid levels with progressive lot sizing and cumulative position tracking
Risk Controls: Dual drawdown limits (percentage and absolute) with four different response actions and time-based recovery
Time Management: GMT-based trading hours with flexible start/end times supporting overnight sessions
Alert System: Five comprehensive alert conditions for new signals, drawdown warnings, maximum levels, and cycle completion
Important Limitations
Lagging Nature: Signals may appear after optimal entry points due to confirmation requirements and breakout validation
Grid Risk: Progressive lot sizing can lead to significant exposure accumulation during extended adverse price movements
Market Dependency: Performance varies significantly between trending and ranging market conditions, requiring parameter adjustments
Computational Load: Complex multi-array calculations and real-time dashboard updates may impact performance on slower devices
No Guarantee: All signals are suggestions based on technical analysis calculations and may be incorrect
Educational Disclaimers
This indicator is designed for educational and analytical purposes only. It represents a technical analysis tool based on mathematical calculations of historical price data and should not be considered as financial advice or trading recommendations.
Risk Warning: Grid trading involves substantial risk of loss and is not suitable for all investors. The progressive lot sizing methodology can lead to significant exposure accumulation during adverse market movements. Past performance of any trading system or methodology is not necessarily indicative of future results.
Important Notes:
Always conduct your own analysis before making trading decisions
Use appropriate position sizing and risk management strategies
Never risk more than you can afford to lose
Consider your investment objectives, experience level, and risk tolerance
Seek advice from qualified financial professionals when needed
Grid trading can result in multiple simultaneous positions with compounding risk exposure
Performance Disclaimer: Backtesting results do not guarantee future performance. Market conditions change constantly, and what worked in the past may not work in the future. The indicator's mathematical calculations are based on historical data patterns that may not repeat. Always paper trade new strategies before risking real capital.
System Limitations: The indicator relies on technical analysis principles and may produce false signals during unusual market conditions, news events, or periods of extreme volatility. Users should implement additional confirmation methods and maintain strict risk management protocols.

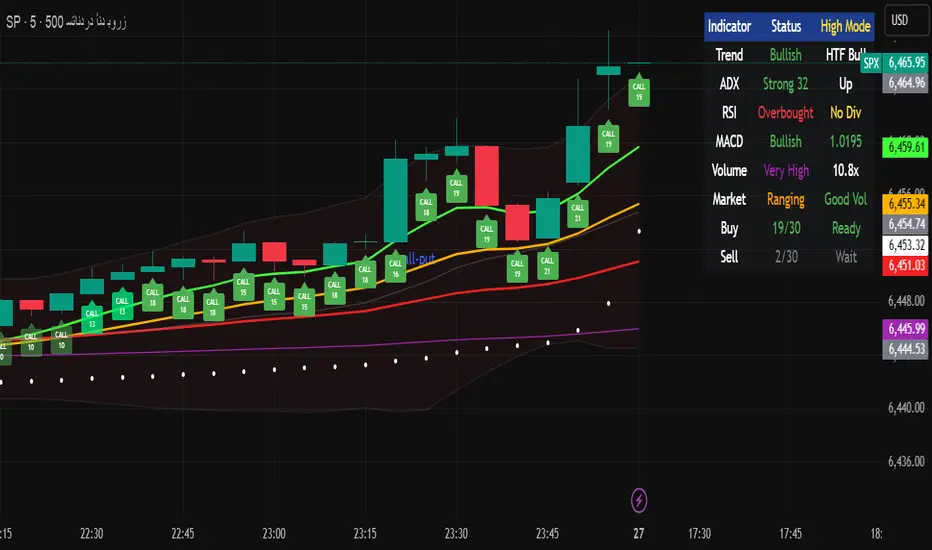
Multi-Timeframe Options Strategy with Dynamic Scoring System## Multi-Timeframe Options Strategy with Dynamic Scoring System
### Overview
This indicator combines 12 technical analysis tools using a proprietary 30-point scoring system to generate options trading signals (CALL/PUT). It's designed for traders seeking confluence-based entries with multiple confirmation layers.
### How the Scoring System Works
The indicator evaluates market conditions across three categories:
**Trend Analysis (9 points maximum):**
- EMA Alignment (9, 21, 50, 200): Checks if moving averages are properly stacked (3 points)
- ADX Trend Strength: Confirms trend momentum above 25 threshold (3 points)
- Higher Timeframe Confirmation: Validates signals against larger timeframe trend (3 points)
**Momentum Indicators (7 points maximum):**
- RSI Position & Direction: Optimal zones 40-65 for buys, 35-60 for sells (2 points)
- MACD Signal Line Cross: Momentum confirmation (2 points)
- Stochastic Oscillator: Overbought/oversold conditions (2 points)
- Bollinger Band Position: Price relative to middle band (1 point)
**Market Quality Filters (4 points maximum):**
- Volume Confirmation: 1.5x average volume requirement (2 points)
- VWAP Position: Trend alignment check (1 point)
- ATR Volatility: Ensures adequate price movement (1 point)
### Key Features
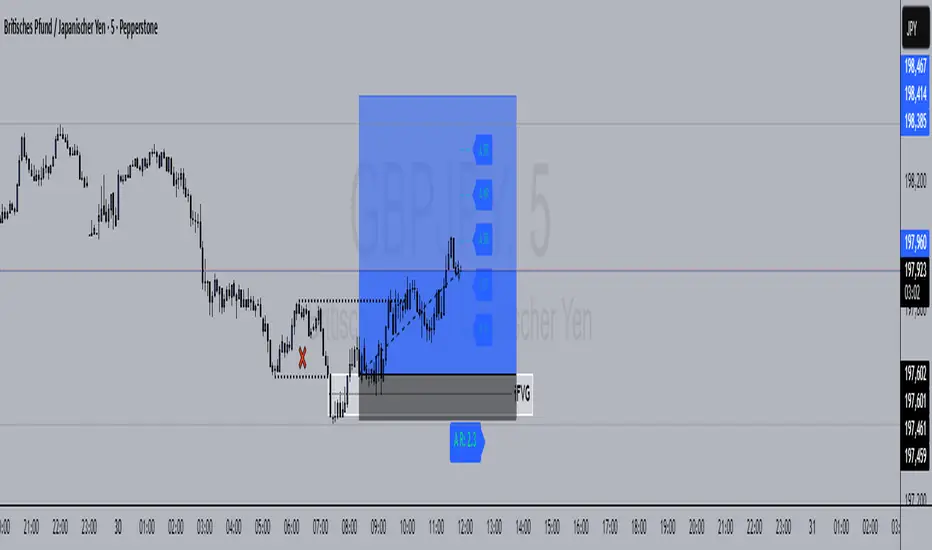
**1. Fair Value Gaps (FVG)**
- Identifies price inefficiencies between candles
- Bullish FVG: Current low > high (potential support)
- Bearish FVG: Current high < low (potential resistance)
- Visual representation with colored boxes on chart
**2. Three Operating Modes**
- Normal Mode: Minimum 10 points - balanced signal frequency
- High Mode: Minimum 15 points - fewer but stronger signals
- Ultra Mode: Minimum 20 points - only highest quality setups
**3. Protection Mechanisms**
- Bollinger Band squeeze detection avoids ranging markets
- Prevents conflicting signals (no simultaneous CALL/PUT)
- 5-bar minimum cooldown between signals
- Filters extreme RSI readings (>75 or <25)
**4. Risk Management**
- Three profit targets: 0.5%, 1%, 1.5%
- Stop loss: 0.5% or ATR-based
- Visual target lines with entry/exit levels
### How Components Work Together
The indicator creates a comprehensive market analysis by combining:
- **EMAs** provide the trend structure framework
- **Oscillators** (RSI, Stochastic) identify optimal entry timing
- **ADX** confirms trend strength to filter weak signals
- **Volume** validates institutional participation
- **Higher timeframe** acts as a directional filter
Each component contributes points to either bullish or bearish scoring. Signals only generate when one direction significantly outweighs the other and meets minimum thresholds.
### Usage Instructions
1. **Select Mode**: Choose Normal/High/Ultra based on your trading style
2. **Monitor Dashboard**: Check real-time scoring and market conditions
3. **Wait for Signals**: Main BUY/SELL labels appear when criteria met
4. **Follow Targets**: Use automated TP and SL levels for risk management
5. **Candle Labels**: Optional CALL/PUT labels show building momentum
### Dashboard Information
The dashboard displays:
- Current trend direction and HTF confirmation
- ADX strength and direction
- RSI status with divergence detection
- MACD momentum state
- Volume multiplier
- Market condition (trending/ranging)
- Live scoring for both directions
### Important Notes
- This is a technical analysis tool, not financial advice
- Past performance does not guarantee future results
- Always use proper risk management
- Test thoroughly on demo before live trading
### Originality
This indicator's unique value comes from:
1. The 30-point weighted scoring system that prioritizes different factors
2. Integration of Fair Value Gaps with traditional indicators
3. Multi-mode operation allowing traders to adjust signal frequency
4. Higher timeframe validation system
5. Comprehensive filtering to reduce false signals
The combination creates a systematic approach to options trading that goes beyond simple indicator mashups by providing clear, scored reasoning for each signal.
---
### Updates and Support
For questions or suggestions, please comment below. The indicator will be updated based on community feedback while maintaining compliance with all platform rules.
Trading Dashboard Position managementWhat This Script Does: A Simple Overview
Imagine you want a small, neat box on your trading chart that automatically calculates and displays key price levels for a potential trade. This script does exactly that.
It creates a "Trade Dashboard" that uses a popular volatility indicator called the Average True Range (ATR) to suggest:
A potential Entry price.
A Stop Loss level to limit potential losses.
Three different Target levels for taking profits.
You can customize everything, from how these levels are calculated to how the dashboard looks.

Risk & Money Calculator / Fixed Losses This indicator is designed for people who want to control their losses as precisely as possible!
It allows you to quickly calculate the potential loss on a position, taking commission into account. It's designed so that you can have a fixed loss with different stop-loss lengths by adjusting the position size, expressed in currency!
Next to the Stop Loss price, you'll see the percentage distance to the stop and the actual loss, including the double commission (for opening and closing).
The indicator is very easy to use. You select the trade direction, enter the entry price, and the Stop Loss price. Optionally, you can set a Take Profit price to visualize the profit percentage! Since commission is charged both when opening and closing a position, you need to specify the size of your one-way commission.
Important!
• DON'T FORGET ABOUT LIQUIDATION, WHICH HAPPENS BEFORE THE CORRESPONDING STOP LOSS PERCENTAGE IS REACHED!
• YOU ARE SOLELY RESPONSIBLE FOR YOUR CALCULATIONS AND LOSSES!
• IF YOU HAVE ANY WISHES OR SUGGESTIONS RELATED TO THE INDICATOR'S OPERATION, I'M READY TO LISTEN AND POSSIBLY MAKE CHANGES TO ITS FUNCTIONALITY!

Fundur - Trend LinesFundur - Trend Lines: Complete Trading Indicator Guide
Indicator Overview
The Fundur - Trend Lines is an advanced multi-layered trend analysis system that combines adaptive trend line technology, momentum analysis, and intelligent signal generation into one comprehensive trading tool. This indicator goes beyond traditional moving averages by utilizing volatility-adjusted trend lines that dynamically adapt to market conditions, providing traders with precise trend strength measurements and actionable trading signals.
What Makes Trend Lines Unique?
The Trend Lines indicator introduces Adaptive Trend Line Technology - a sophisticated methodology that uses Average True Range (ATR) calculations to create trend lines that respond intelligently to market volatility. Unlike static indicators, Trend Lines provides dynamic analysis that adapts its sensitivity based on current market conditions, offering more accurate trend identification and strength assessment.
Core Methodology
The indicator operates on the principle that trend strength can be quantified by analyzing the relationship between multiple adaptive trend lines, momentum indicators, and market structure. By combining Alignment Analysis , Distance Measurements , Momentum Confirmation , and Volatility Expansion Potential , the system generates a comprehensive trend strength score from 0-100% with corresponding trading signals.
Key Features
🎯 Adaptive Trend Line System Slow Trend Line : Primary trend direction with lower sensitivity for major trend identification Fast Trend Line : Higher sensitivity trend line for early trend change detection Volatility Adaptation : Both lines automatically adjust to market volatility using ATR calculations Cloud Visualization : Colored areas between trend lines show trend strength and direction
📊 Comprehensive Trend Strength Analysis Quantified Strength (0-100%) : Precise trend strength measurement combining multiple factors Alignment Score : Measures agreement between multiple trend line systems Distance Analysis : Evaluates price proximity to trend lines using ATR normalization Momentum Integration : Incorporates Awesome Oscillator for momentum confirmation Squeeze Factor : Identifies volatility expansion potential for breakout opportunities
🧠 Intelligent Signal Generation Position Signals : Clear ADD LONG, ADD SHORT, REDUCE, HOLD recommendations Risk Zone Classification : STRONG, MEDIUM, WEAK trend categorization Trend Direction : Bullish, Bearish, or Neutral trend identification Dynamic Updates : Real-time signal adjustments based on changing conditions
⚡ Enhanced Momentum Analysis Smoothed Momentum : Configurable momentum smoothing to reduce noise Acceleration Detection : Identifies momentum acceleration and deceleration Divergence Alerts : Detects price-momentum divergences for reversal warnings Directional Bias : Momentum confirmation for trend direction validation
🔍 Advanced Market Structure Detection Momentum Squeeze : Identifies low-volatility periods preceding major moves Volatility Expansion : Detects when markets break out of consolidation phases Trend Weakness Detection : Early warning system for deteriorating trends Structure Transition : Identifies when trends change character or direction
🎨 Professional Visual Interface Comprehensive Analysis Table : All key metrics displayed in organized format Visual Strength Bar : Graphical representation of trend strength Color-Coded Components : Intuitive color scheme for quick analysis Customizable Display : Flexible positioning and sizing options
Setup Guide
Step 1: Adding the Indicator
Open TradingView and navigate to your desired chart Click the "Indicators" button or press "/" key Search for "Fundur - Trend Lines" Add the indicator to your chart
Step 2: Basic Configuration
Main Features Settings ✅ Show Trend Analysis Table : ON (Essential for comprehensive analysis) ✅ Enable Trend Strength Analysis : ON (Core functionality) ✅ Generate Trading Signals : ON (For position management guidance)
Trend Lines Display ✅ Show Slow Trend Line : ON (Primary trend identification) ✅ Show Fast Trend Line : ON (Early signal detection) Trend Cloud Transparency : 89% (Default recommended, adjust for visibility)
Table Positioning Table Position : Top Right (recommended for most setups) Table Size : Normal (adjust based on screen size)
Step 3: Advanced Analysis Configuration
Enhanced Features (Optional) ✅ Enhanced Momentum Analysis : ON (for more accurate signals) ✅ Divergence Detection : ON (for reversal warnings) ⚠️ Momentum Squeeze Analysis : OFF initially (can add visual complexity)
Sensitivity Settings Divergence Sensitivity : 5 (Default - lower = more sensitive) Momentum Smoothing : 3 (Default - higher = smoother signals)
Step 4: Alert Configuration
Essential Alerts (Recommended) Trading Signal Alerts : Enable for position changes Trend Strength Change Alerts : Enable for trend monitoring Strength Change Threshold : 15% (Default recommended)
Advanced Alerts (Optional) Divergence Alerts : Enable for reversal warnings Early Weakness Alerts : Enable for risk management Momentum Squeeze Alerts : Enable for breakout opportunities Trend Line Cross Alerts : Enable for level-based signals
Basic Trading Guide
Understanding Trend Strength
The indicator's foundation is the Trend Strength Score - a quantified measurement (0-100%) that combines four key factors:
Strong Trends (75%+ Strength) 🟢 Characteristics : High alignment, close price-to-trend proximity, strong momentum Signals : ADD LONG (bullish) or ADD SHORT (bearish) Strategy : Aggressive position building, trend continuation trades Risk : Lower risk due to strong trend confirmation
Medium Trends (35-75% Strength) 🟡 Characteristics : Mixed signals, moderate alignment, transitional phases Signals : HOLD current positions Strategy : Conservative approach, wait for clearer signals Risk : Medium risk, requires careful monitoring
Weak Trends (Below 35% Strength) 🔴 Characteristics : Poor alignment, distant from trend lines, weak momentum Signals : REDUCE positions or CLOSE Strategy : Risk reduction, position unwinding Risk : High risk, trend likely changing or failing
Entry Strategies
Primary Strategy: Trend Continuation Entries Setup : Strong trend strength (75%+) with clear directional bias Entry Trigger : ADD LONG or ADD SHORT signal confirmation Direction : Follow the trend direction (Bullish ⬆ or Bearish ⬇) Timing : Enter on signal generation or price pullback to trend lines
Stop Loss Placement Conservative Method : Beyond the opposite trend line Aggressive Method : Below/above recent swing points For Long Positions : Below the Slow Trend Line For Short Positions : Above the Slow Trend Line Dynamic Adjustment : Move stops with trend line progression
Profit Taking Strategy
For Long Positions (Bullish Trend): Take 50% profits when trend strength begins declining from peak Take another 25% when trend strength drops below 60% Close remaining position when REDUCE signal appears Trail stops using Fast Trend Line for remaining position
For Short Positions (Bearish Trend): Take 50% profits when trend strength begins declining from peak Take another 25% when trend strength drops below 60% Close remaining position when REDUCE signal appears Trail stops using Fast Trend Line for remaining position
Alternative Strategy: Divergence-Based Reversal Entries Setup : Bullish or bearish divergence detected with weakening trend strength Entry : On trend direction change confirmation Risk Management : Tight stops due to counter-trend nature Targets : Opposite trend line or previous swing levels
Risk Management Framework
Position Sizing Based on Trend Strength Strong Trends (75%+) : Full position size (within risk tolerance) Medium Trends (35-75%) : Reduced position size (50-75% of normal) Weak Trends (Below 35%) : Minimal or no new positions Transitional Periods : Smallest position sizes due to uncertainty
Dynamic Risk Adjustment Increasing Strength : Can add to positions gradually Decreasing Strength : Begin profit-taking and position reduction Rapid Strength Loss : Quick position reduction or exit Divergence Warning : Tighten stops and prepare for reversal
Analysis Setups
Setup 1: Scalping Configuration (1-5 minute charts)
Settings Optimization: Momentum Smoothing: 2 (more responsive) Divergence Sensitivity: 3 (higher sensitivity) Enhanced Momentum Analysis: ON All alerts: ON for rapid signal updates
Visual Settings: Table Size: Small (less screen space) Table Position: Top Right Trend Cloud Transparency: 85% (subtle background)
Trading Approach: Focus on quick ADD signals in strong trends Use Fast Trend Line for entry timing Quick profit-taking at first sign of strength decline Very tight risk management due to lower timeframe noise
Setup 2: Day Trading Configuration (5-15 minute charts)
Settings Optimization: All default settings work well Enable Momentum Squeeze Analysis for breakout identification Divergence Detection: ON for reversal warnings Trend Strength Change Threshold: 12% (more sensitive)
Visual Settings: Table Size: Normal Show all trend analysis components Trend Cloud Transparency: 89% (default)
Trading Approach: Wait for clear trend strength above 65% before entering Use momentum squeeze breakouts for early entries Hold positions through medium strength phases Exit on REDUCE signals or strength below 40%
Setup 3: Swing Trading Configuration (1-4 hour charts)
Settings Optimization: Momentum Smoothing: 4 (smoother for higher timeframe) Divergence Sensitivity: 7 (less sensitive, higher quality signals) Enhanced Momentum Analysis: ON Early Weakness Alerts: ON (important for swing trades)
Visual Settings: Table Size: Normal or Large Focus on trend strength and direction components Enable all visual features for comprehensive analysis
Trading Approach: Require trend strength above 70% for new positions Hold through temporary strength dips if above 50% Use divergence signals for early exit warnings Focus on major trend changes for position adjustments
Setup 4: Position Trading Configuration (4H-Daily charts)
Settings Optimization: Momentum Smoothing: 5 (maximum smoothing) Divergence Sensitivity: 10 (only high-quality divergences) Strength Change Threshold: 20% (major changes only) Focus on trend direction and strength alerts
Visual Settings: Table Size: Large (detailed analysis) Clean visual setup focusing on major components Minimal clutter for long-term perspective
Trading Approach: Only enter on very strong trends (80%+ strength) Hold through significant strength fluctuations Focus on major trend direction changes Use weekly/monthly trend alignment for confirmation
Setup 5: Multi-Asset Analysis Configuration
For Forex Pairs: Standard settings work well due to 24-hour markets Pay attention to session-based strength changes Use momentum squeeze for breakout trading Enable all alert types for continuous monitoring
For Cryptocurrency: Reduce momentum smoothing (2-3) due to high volatility Increase divergence sensitivity (3-4) for early warnings Focus on strength changes above 20% threshold Use squeeze analysis for breakout opportunities
For Stock Indices: Standard settings appropriate for most indices Enable early weakness alerts for risk management Consider market hours for signal validity Use higher timeframes for better signal quality
Visual Components
Trend Analysis Table Trend Strength : Percentage with visual strength bar Trend Signal : Current position recommendation Risk Zone : STRONG/MEDIUM/WEAK classification Alignment : Trend line agreement analysis Distance : Price proximity to trend lines Momentum : Current momentum direction and strength
Trend Lines and Clouds Colored Clouds : Green for bullish trends, red for bearish trends Cloud Intensity : Opacity reflects trend strength Dynamic Colors : Automatically adjust based on trend direction
Momentum Squeeze Visualization Yellow Highlights : Above and below price during squeeze periods Squeeze Indication : Identifies low-volatility consolidation Breakout Preparation : Visual cue for potential explosive moves
Alert System
Trading Signal Alerts ADD LONG : Strong bullish trend confirmed ADD SHORT : Strong bearish trend confirmed REDUCE : Trend weakness detected, position reduction recommended HOLD : Maintain current positions, no change needed
Trend Analysis Alerts Strength Increase : Trend gaining momentum Strength Decrease : Trend losing momentum Early Weakness : Warning of potential trend deterioration Trend Direction Change : Major trend shift detected
Technical Alerts Bullish Divergence : Price falling but momentum rising Bearish Divergence : Price rising but momentum falling Momentum Squeeze Start : Volatility contraction beginning Momentum Squeeze End : Breakout from low volatility period Trend Line Cross : Price crossing above/below trend lines
Setting Up Alerts Enable desired alert types in indicator settings Create TradingView alerts using "Fundur - Trend Lines" as source Configure notification methods (email, SMS, app notifications) Test alerts with paper trading before live implementation Adjust alert frequency settings to avoid spam
Best Practices
Trend Strength Interpretation Above 75% : High confidence trades, full position sizes 50-75% : Moderate confidence, reduced positions Below 50% : Low confidence, minimal or no positions Rapid Changes : Pay attention to sudden strength shifts
Signal Management Don't Chase : Wait for clear signals rather than predicting Confirm with Price Action : Use chart patterns for additional confirmation Respect Risk Zones : Adjust position sizes based on trend classification Monitor Alignment : Strong alignment increases signal reliability
Multi-Timeframe Integration Higher Timeframe Bias : Use daily/weekly for overall trend direction Lower Timeframe Entries : Use hourly/15min for precise entry timing Confirmation Requirement : Ensure alignment between timeframes Conflict Resolution : Higher timeframe takes precedence
Common Mistakes to Avoid
Signal Misinterpretation Ignoring Trend Strength : Don't trade weak signals (below 60%) Fighting the Trend : Don't go against strong trend directions Overreliance on Single Component : Consider all analysis factors Impatience : Wait for clear STRONG trend classification
Risk Management Errors Fixed Position Sizes : Adjust sizes based on trend strength Ignoring REDUCE Signals : Take profits when indicator suggests No Stop Losses : Always use stops beyond trend lines Overleveraging Weak Signals : Use smaller positions in MEDIUM zones
Technical Analysis Errors Ignoring Divergences : Pay attention to momentum warnings Missing Squeeze Opportunities : Watch for breakout setups Poor Timeframe Selection : Match timeframe to trading style Alert Fatigue : Don't enable too many alerts simultaneously
Advanced Techniques
Divergence Trading Early Reversal Detection : Use divergences to anticipate trend changes Confirmation Required : Wait for trend strength decline confirmation Tight Risk Management : Use smaller positions for counter-trend trades Quick Exits : Take profits rapidly on divergence trades
Momentum Squeeze Strategies Breakout Preparation : Position before squeeze resolution Direction Bias : Use trend direction for breakout direction Volume Confirmation : Combine with volume analysis when possible False Breakout Protection : Use tight stops for failed breakouts
Multi-Component Analysis Alignment Priority : Perfect alignment (100%) provides highest confidence Distance Consideration : Closer to trend lines = higher probability Momentum Confirmation : Rising momentum supports trend direction Squeeze Integration : High squeeze factor increases breakout potential
Dynamic Position Management Scaling In : Add to positions as trend strength increases Scaling Out : Reduce positions as trend strength decreases Stop Trailing : Move stops with Fast Trend Line progression Profit Optimization : Use strength peaks for profit-taking timing
Conclusion
The Fundur - Trend Lines indicator represents a sophisticated approach to trend analysis, combining adaptive trend line technology with comprehensive strength measurement and intelligent signal generation. By quantifying trend strength through multiple analytical components, this indicator provides traders with objective, data-driven insights for making informed trading decisions.
The indicator's strength lies in its ability to adapt to changing market conditions while providing clear, actionable signals. The comprehensive trend strength analysis removes guesswork from trend trading, allowing traders to size positions appropriately and manage risk effectively based on quantified market conditions.
Success with the Trend Lines indicator comes from understanding that trend strength is dynamic and requires continuous monitoring. The 0-100% strength scale provides an objective framework for position management, while the multi-component analysis ensures robust signal generation across different market conditions.
Remember that this indicator works best when combined with proper risk management, position sizing, and market context awareness. Start with conservative settings and smaller position sizes while learning the indicator's behavior in different market environments. The comprehensive alert system helps maintain awareness of changing conditions, but successful trading still requires discipline and adherence to your trading plan.
For optimal results, practice with the indicator across different timeframes and market conditions, always prioritizing risk management over profit potential, and maintaining realistic expectations about market behavior and indicator performance.

R Manager PRO++ – Multi-Setup Risk/Reward ToolDescription
The R Manager PRO++ V1.3d is an advanced risk/reward management tool designed for traders who want to visually plan, track, and manage multiple trade setups directly on their charts.
This script allows you to plot up to three independent setups (A, B, and C) simultaneously. For each setup, you can manually input your Entry and Stop Loss levels, and the tool will automatically calculate and display R-multiple levels (1R to 5R), providing a clear overview of your potential profit targets.
Key Features
Multi-Setup Management (A, B, C)
Track up to three separate trades at the same time, each with individual colors and controls.
Manual Entry & Stop Loss Input
Enter your trade levels manually for flexible usage across any market or strategy.
Automatic R-Multiple Calculation (1R to 5R)
The indicator automatically draws lines and labels for 1R to 5R targets based on your risk distance.
Live R Display
Real-time calculation of your current R multiple, updating with every price move.
Custom Symbol Selection
Link each setup to a specific symbol (e.g., EURUSD, XAUUSD, NAS100) to manage multiple markets without clutter.
Reset Function
One-click reset button to quickly clear individual setups.
Alerts for Reached R-Levels
Receive alerts when price reaches each R level (1R to 5R) to monitor trades without constant chart-watching.
How to Use
- Select Entry and Stop Loss levels manually in the input panel.
- Choose the symbol for each setup (supports Forex, Indices, Gold).
- Enable or disable setups individually with the Activate checkbox.
- Optional: Use the Reset button to clear a setup quickly.
- Monitor R-multiples visually and via alerts as price evolves.
Suitable For
- Swing traders
- Day traders
- Risk-based trading strategies (R-multiples)
- Multi-market portfolio management
NQ Position Size CalculatorNQ Position Size Line Calculator is designed specifically for Nasdaq 100 futures (NQ) and micro futures (MNQ) traders who want to maintain disciplined risk management. This visual tool eliminates the guesswork from position sizing by displaying distance lines and contract calculations directly on your chart.
The indicator creates horizontal lines at 10-tick intervals from your stop loss level, showing you exactly how many contracts to trade at each distance to maintain your predetermined risk amount. Whether you're trading regular NQ contracts or micro MNQ contracts, this calculator ensures you never risk more than intended while providing instant visual feedback for optimal position sizing decisions.
How to Use the Indicator
Step 1: Configure Your Settings
Stop Loss Price: Enter your exact stop loss level (e.g., 20000.00)
Risk Amount ($): Set your maximum dollar risk per trade (e.g., $500)
Contract Type: Choose between:
NQ (Regular): $5 per tick - for larger accounts
MNQ (Micro): $0.50 per tick - for smaller accounts or conservative sizing
Display Options:
Max Lines: Number of distance lines to show (default: 30)
Show Labels: Toggle tick distance and contract count labels
Line Color: Customize the color of distance lines
Label Size: Choose tiny, small, or normal label sizes
Step 2: Read the Visual Display
Once configured, the indicator displays:
Stop Loss Line:
Thick yellow line marking your exact stop loss level
Yellow label showing the stop loss price
Distance Lines:
Dashed red lines at 10-tick intervals above and below your stop loss
Lines appear on both sides for long and short position planning
Labels (if enabled):
Green labels (right side): For long positions above your stop loss
Red labels (left side): For short positions below your stop loss
Format: "20T 5x" means 20 ticks distance, 5 contracts maximum
Step 3: Use the Information Tables
The indicator provides two helpful tables:
Position Size Table (top-right):
Shows common tick distances (10, 20, 40, 80, 160 ticks)
Displays risk per contract at each distance
Contract count for your specified risk amount
Total risk with rounded contract numbers
Settings Table (bottom-right):
Confirms your current risk amount
Shows selected contract type
Displays current settings for quick reference
Step 4: Apply to Your Trading
For Long Positions:
Look at the green labels on the right side of your chart
Find your desired entry level
Read the label to see: distance in ticks and maximum contracts
Example: "30T 8x" = 30 ticks from stop, buy 8 contracts maximum
For Short Positions:
Look at the red labels on the left side of your chart
Find your desired entry level
Read the label for tick distance and contract count
Example: "40T 6x" = 40 ticks from stop, sell 6 contracts maximum
Step 5: Trading Execution
Before Entering a Trade:
Identify your stop loss level and input it into the indicator
Choose your entry point by looking at the distance lines
Note the contract count from the corresponding label
Verify the risk amount matches your trading plan
Execute your trade with the calculated position size
Risk Management Features:
Contract rounding: All position sizes are rounded down (never up) to ensure you don't exceed your risk limit
Zero position filtering: Lines only show where position size is at least 1 contract
Dual-sided display: Plan both long and short opportunities simultaneously

Micro Futures Contract Calculator Micro Futures Contract Calculator
Synopsis: The Micro Futures Contract Calculator is a sleek, minimalist indicator that calculates the number of Micro E-mini Nasdaq-100 (MNQ) or S&P 500 (MES) contracts you can trade based on a fixed dollar risk and stop-loss (in ticks). Displayed in a compact, professional table in the top-right corner, it shows your risk, stop-loss, contract type, and calculated contracts, helping traders maintain consistent risk management.
How to Use:
Add the indicator to your chart (search “Micro Futures Contract Calculator”).
In settings, input:
Maximum Risk ($): Your total risk per trade (e.g., $100).
Stop-Loss (Ticks): Stop-loss size in ticks (e.g., 20 ticks = 5 points).
Contract Type: Select MNQ or MES.
Check the top-right table for:
Risk, stop-loss, contract type, and number of contracts (e.g., “10” for MNQ, “4” for MES).
Use the contract number to size trades, ensuring risk stays fixed.
Why Standardized Risk is Important:
Consistency: Fixed risk per trade (e.g., $100) prevents oversized losses, stabilizing long-term performance.
Discipline: Removes emotional guesswork, enforcing a systematic approach across MNQ/MES trades.
Capital Protection: Limits exposure, preserving your account during losing streaks and volatile markets.
Scalability: Aligns position sizing with your risk tolerance, enabling confident scaling as your account grows.
This indicator simplifies risk management, making it essential for disciplined futures trading.

Assets Correlation by GDM📊 Correlation Matrix Table between Two Assets
This indicator calculates and displays the rolling correlation between the asset on your chart and a second asset of your choice. The correlation is computed based on log returns over a user-defined lookback period. A live summary table appears in the bottom left corner, providing a real-time snapshot of the current correlation and its context.
How it works:
Comparison Asset:
Select any symbol to compare with the chart asset (e.g., compare BTCUSD to ETHUSD).
Lookback Period:
Choose the rolling window (in bars) used to calculate the Pearson correlation coefficient.
Dynamic Table:
A table in the lower left corner summarizes:
Main asset symbol
Comparison symbol
Analysis period (bars)
Current correlation value (rounded to 2 decimals)
Correlation strength & direction (Strong, Moderate, Weak | Positive/Negative)
Visual Plot:
The indicator plots the correlation value over time so you can observe changes and trends.
Table Positioning:
Table location can be adjusted from settings (bottom left/right, top left/right).
How to use:
Risk Management & Diversification:
Quickly assess if two assets move together (positive correlation), in opposite directions (negative correlation), or independently.
Pairs Trading:
Identify opportunities when correlation diverges from historical norms.
Portfolio Construction:
Avoid overexposure to highly correlated assets, or use negative correlation for hedging.
Limitations & Tips:
Correlation values are based on historical returns and may change during periods of market stress or volatility.
Use multiple lookback periods (short, medium, long) for a more robust view.
Correlation does not imply causation—always complement with additional analysis.
Script Features:
User-selectable comparison asset and lookback window.
Real-time correlation calculation.
Clean summary table with correlation stats.
Optional alert logic and correlation plot for more advanced usage.
If you find this indicator useful, please leave a like and let me know your suggestions for improvements!
