RSI CCI Correlating Oscillator (RCCO) by empowerTRCCO is pronounced "ree-koh" or "rico".
The RCCO is simply the plot of the values of both the RSI and CCI added together.
The RCCO makes some adjustments though, so that both the RSI and the CCI will fit correctly on the same scale - and so that these adjustments for scale allow reversals to be detected at crossings.
When the CCI crosses from underneath to up above the RSI, this is usually a bullish reversal. Alternatively, when the CCI crosses from above to back under the RSI, that usually signals a bearish trend. Look for the widest swings you can find to ensure good momentum. The larger the volume, the clearer and more decisive the trends. Low volume will lead to ranging and lazy momentum. High volume will create clear and forceful trends. The lowest negative RCCO in a timeframe, and then add some high volume... and you have yourself a good setup for a successful trade.
Because the RSI and CCI are adjusted, you may not recognize their values from having used the respective indicators on their own. The RSI and CCI values are less important. What matters with this indicator are the crossings and the RCCO value. The RCCO value should be negative, preferably, a deeply negative value. Look at the historical chart for the target per your selected timeframe and decide what values work for you.
I hope you enjoy the RCCO and that it can help you become a little más RICO!
Reversals

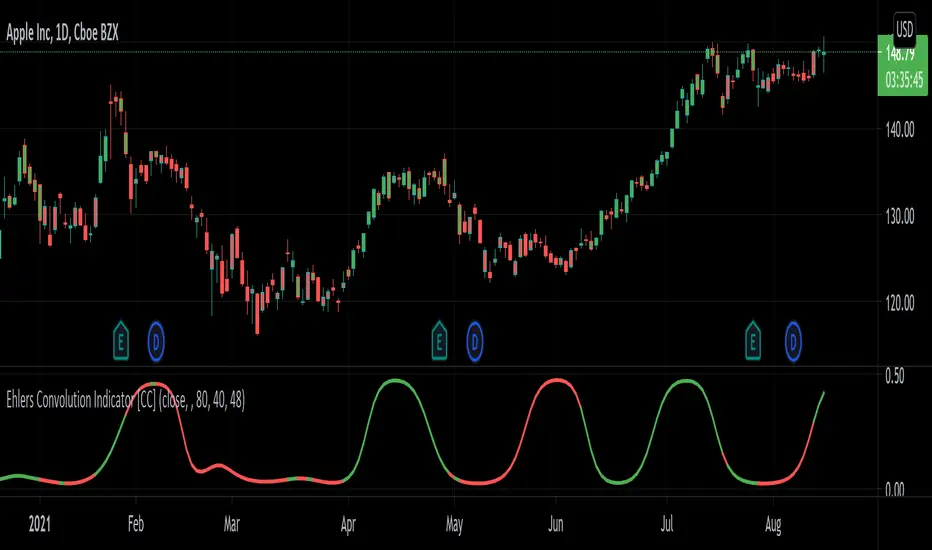
Ehlers Convolution Indicator [CC]The Convolution Indicator was created by John Ehlers (Cycle Analytics For Traders pgs 170-174) and this is version of an indicator to find potential reversal points. The idea behind this indicator is to use a variation of his AutoCorrelation Indicator that transforms the data using digital signal processing and as you can see it looks very similar to his BandPass Filter . The idea is that when this indicator peaks then it has reached a potential reversal point and so the stock may continue in the current direction but most of the time this indicator correctly points out the reversal points. I have included normal buy and sell signals but generally speaking you would want to buy when the indicator is around 0.05 to 0.10 and moving up and sell when it reaches its peak and is starting to move down.
Let me know if you have any other scripts you would like to see me publish!
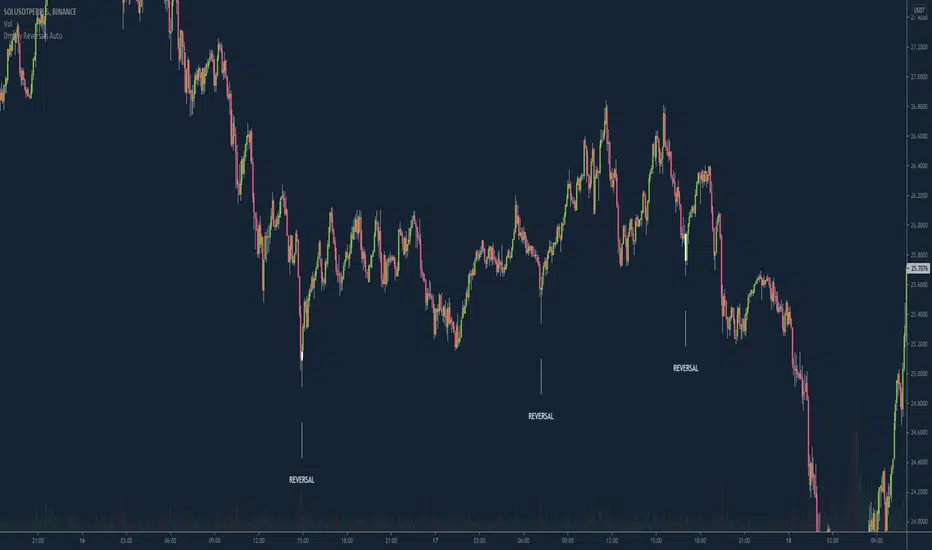
Dmitry Reversals AutoReversal Finder - made to assist sniping tops / bottoms, recommend using on the 5m timeframe but can try others.
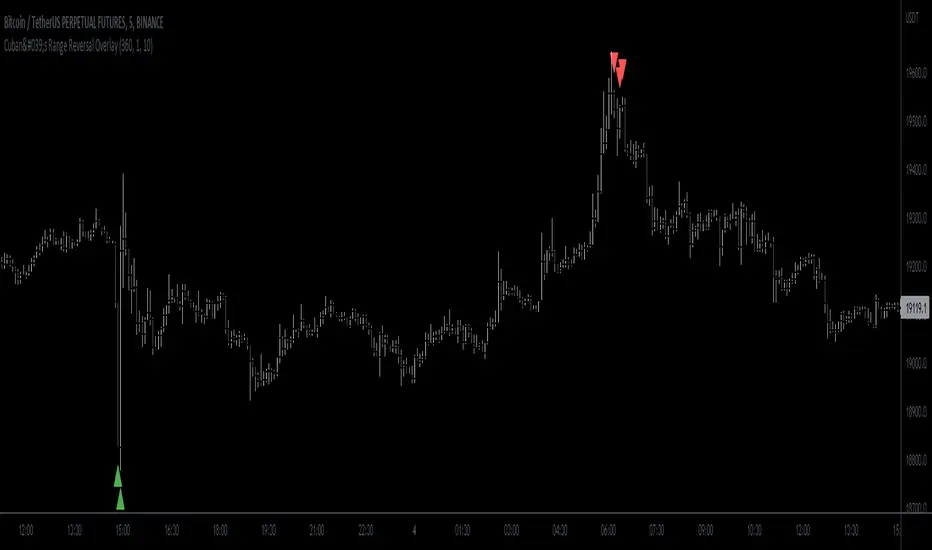
Cuban's Range Reversal OverlayBeen a minute since a public script!
This one looks at the range and recommends potential reversal depending on degree of overextension.
Originally intended for low timeframe short time horizon reversals but works well on higher timeframes as well.
Oscillator included in the image so you can see under the skirt and check what's happening.
ArcTan Oscillator [LuxAlgo]The following indicator is a normalized oscillator making use of the arc tangent sigmoid function (ArcTan), this allows to "squarify" the output result, thus visually filtering out certain variations originally in the oscillator. The magnitude of this effect can be controlled by the user. The indicator contains a gradient that shows the possibility of a reversal, with red colors indicating that a reversal might occur.
Settings
Length : Period of the oscillator
Pre-Gain : Changes the amplitude of the oscillator before passing through the ArcTan function, this allows to amplify/reduce the "squarification" effect introduced by this function. In order to make it easier for the user, the setting is in a (-10,10) range, with negative values reducing the amplitude and positive one increasing it.
Src : Source input of the indicator
Usage
The oscillator can be used to determine the direction of the trend by looking at its sign, if the oscillator is positive, market is up-trending, else down-trending, based on this usage the user might not be interested to look at every variations produced by the oscillator, this is where the hyperbolic tangent function and pre-gain setting can be useful, by using an high value of pre-gain the user will be able to only focus on the sign of the oscillator.
Here pre-gain is set to 5, we can see that the oscillator is now easier to visualize. However, the use of sigmoid functions remove useful information for a trader that needs to find divergences, this is where using a negative value of the pre-gain setting will result useful.
Here pre-gain is set to -5.
The indicator makes use of a gradient to show potential reversals, this gradient is determined by the correlation between the oscillator and the price (this is a way to measure potential divergences). If the color is closer to red it means that a potential reversal might occur, it is possible to say in which direction price might go by looking at the sign of the oscillator, so if the gradient is red and the oscillator is negative price might rise. The gradient is not affected by the pre-gain setting.

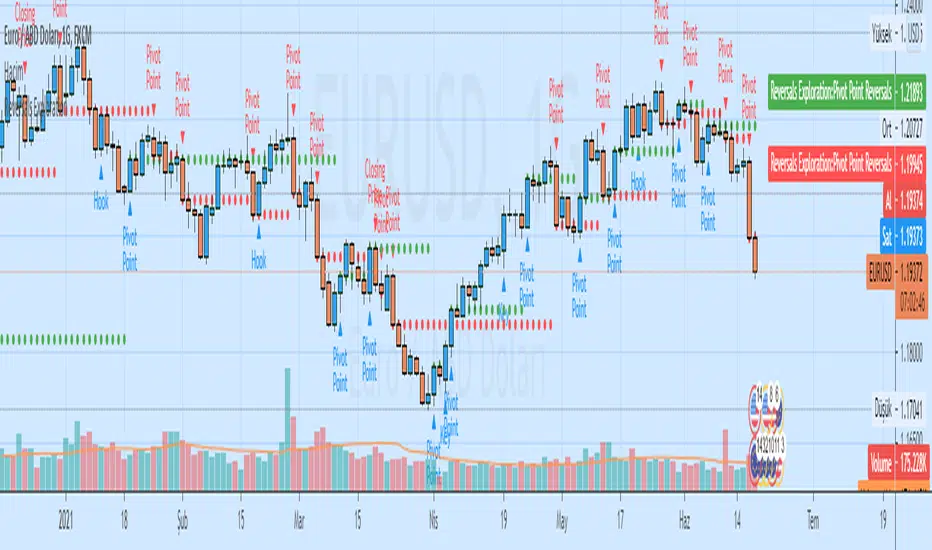
Auto Analysis Short-term Reversals ExplorationAuto Analysis Short-term Reversals Exploration
Based on a study by Larry Lovrencic
Closing Price Reversals Automatic Analysis
Hook Reversals Automatic Analysis
Island Reversals Automatic Analysis
Key Reversals Automatic Analysis
Open/Close Reversals Automatic Analysis
Pivot Point Reversals Automatic Analysis
TheStratHelper-Short Reversalsbased on the teachings of Rob Smith
1= Inside Candle
2= Break on one side
3= Englufing Candle/Outside Candle
Identifies short setups like 212, 312, 122 and 22
My potential entry is marked with a green line and a label that tells you the price as well. I typically enter 1 or 2 cents belowthe marked entry.
My potential target (magnitude) is marked with yellow lines and a label that tells you the price as well.
212, 312 and 122 has entry and magnitudes marked. If there are multiple magnitudes, those are marked with yellow lines which has the price written right above them. The program looks at potentially 4 or 5 magnitudes.
No magnitudes marked for a reversal 22.
Most of the colors can be customized
PM me for more info on how to access this indicator

TheStratHelper-Long Reversalsbased on the teachings of Rob Smith
1= Inside Candle
2= Break on one side
3= Englufing Candle/Outside Candle
Identifies long setups like 212, 312, 122 and 22
My potential entry is marked with a green line and a label that tells you the price as well. I typically enter 1 or 2 cents above the marked entry.
My potential target (magnitude) is marked with yellow lines and a label that tells you the price as well.
212, 312 and 122 has entry and magnitudes marked. If there are multiple magnitudes, those are marked with yellow lines which has the price written right above them. The program looks at potentially 4 or 5 magnitudes.
No magnitudes marked for a reversal 22.
Most of the colors can be customized
PM me for more info on how to access this indicator

ETS MA Deviation ExtremesWhile trading, I noticed that emphasis is often placed on how far price has moved from the moving average (whichever a trader prefers). In these cases I also found that Bollinger Bands only sometimes played a factor in determining whether price had moved "too far" from the moving average to potentially result in a sharp move back to the average.
Because I wanted something more objective than a "gut feeling" that price has moved away from the average enough to make it move back, I decided to see what I could do to determine the standard deviation of how price action moved away from the average , in order to determine when it could potentially have a "rubber band effect" to jump back to the "norm". The result of that is the ETS MA Deviation Extremes indicator, and I hope that it will help you in your trading.
The indicator also has bar coloring included, which can be turned off, which gives a good on-chart visual to warn you that the price action might reverse. This has often helped me to be a bit more cautious before just jumping into a trade that might be on the brink of reversing and taking my position out, and it actually turned out to be a good indicator for a reversal trade strategy.
The histogram bars give an indication of how far the price has moved away from the average, and I look for a potential reversal as soon as the histograms move back inside the deviation lines after having been outside it. The bar coloration actually depend on more than one set of deviation lines, but putting all of that on the chart just makes it confusing, so I removed the ones that I felt were not essential to make it clearer.
I hope it helps you in your trading and makes it easier for you to trade successfully!

Market Sniper - Trading/Scalping SuiteWelcome to Market Sniper.
Market sniper is meant to be a suite for trading/scalping alongside my indicators script, RSI, Stochastic and Horizontals.
It is based on over 15 Indicators/Oscillators so there is no need for convoluted charts and constantly changing charts/indicators for a better understanding of the market.
Warnings:
I can't stress this enough! This isn't a magic pill that will transform your illiterate grandmother into an expert trader! This is a very powerful tool whose function is to complement your trading/save time (and yes, with practice be your main trading tool).
This algorithm requires setting up and training to be used correctly, please do not expect to load it up and immediately be scalping the 1s charts.
This algorithm is heavy and might require constant refreshes of the browser on slower computers.
Labels overlap at the moment, working on this part at the moment. So, always zoom in before doing a trade / change the "+- signals in settings"
Candlestick patterns need tweaking, I personally have it off and use my own judgement atm.
What it includes:
Trend reversal / continuation (Macd, Stochastics, money flow , CCI , momentum, DIOSC (automatic trendlines ), SuperTrend, Moving averages, etc, etc.)
RSI divergence drive / drive counter (base code from Libertus, check his profile as he has very helpful scripts)
Bull Market expansions for longterm take profit and increasing position
Candlestick patterns
Trend reversal / Continuation
Green = Bullish reversal
Red = Bearish trend reversal
Orange = Trend continuation / strengthening
Trend Continuation/Strengthening
A warning here, trend strengthening also means that many times the indicators are overextended or close to it
------
The numbers reflect the amount of indicators that are signaling a reversal over the specified period on the settings.
For higher timeframes this setting should be on a lower value and the opposite for lower timeframes.
This works on every market and every timeframe(according to months of my own paper and real trading). Remember that each market/asset/commodity has different soft spots so tweaking, backtesting and present accuracy review should be of maximum priority.
Bull Market expansion phase
Warning:
The indicator purposely does not show any signals during bear markets. It is my opinion bear markets complexity render this tool close to useless.
It was designed to be used in higher timeframes, tough it SEEMS to have a good track record / be useful in lower timeframes.
it will ALWAYS give a fake signal at the end of a bull market because of the very nature of the code.
It is based of EMAs, RSI and Stochastic
Candlestick Patterns
Bullish candlestick patterns:
Hammer
Inverted Hammer
Dragonfly
Gravestone
Bearish candlestick pattern:
Shooting Star
Hanging Man
Gravestone
Dragonfly
RSI divergence drive
- Credit to Libertus for the base code of this section
The green triangle means there are at least 2 drives of valid divergence, yellow for 3 and red for 4+.
The script shows triangles when confirmation candle closes.
You need to know how divergence works to use this section. investopedia can easily get you there.
For cryptos I use 2-4h+ timeframes, for traditional markets I use 15min+ for forex I use it basically in every timeframe.
For questions/suggestions and access PM me in the platform itself and don't forget -> FEEDBACK IS IMPORTANT
Thank you all

VPTbollfib & Camarilla (Danarilla)I do not own the original indicators. This is just a combination of the two because of their nature to work in a similar way.
Camarilla Pivots run on the basis of intraday range trading. Usually after daily open you look the fade whatever move happened before. by shorting R3/H3 levels or longing R3/L3. Targeting the other side of the range. This is the infamous PivotBoss level calculations and you would want to activate camarilla and turn off the normal pivots. They use the previous days volatility to plot the next days levels.
But what about some confirmation?
Well RafaelIzoni (who made it open source for improvement) threw together this VPTbollfib. It is volume price trend crossing down a fib line using bollinger bands as price envelope. The beauty of this is that It will signal usually counter to current price action based on selling into uptrends or vise versa. Meaning you get signals to counter price. Which is what you might be looking for on range day trade scalps for camarilla. A wick reversal or engulfing + volume based signal is a very happy pairing together. And those signals are usually suitable for the target of the range you are day trading. Hourly time frame works quite well for both. And camarilla should also be on daily settings.
Special Thanks to Nanda (who published the pivotboss indicator AND) Helped to merge the scripts together.
This indicator alone is an entire trade system. Camarilla already is. If you know the rules. it can be used for entries, exits, risk management to trade the range on TREND, COUNTER TREND, and BREAKOUT plays. The bollinger band fibs add confirmation to the trends levels. And the VPT adds a secondary confirmation to take a camarilla trade.
Try it out. I think you will find both the levels on camarilla and the VPT signals quite suprising.

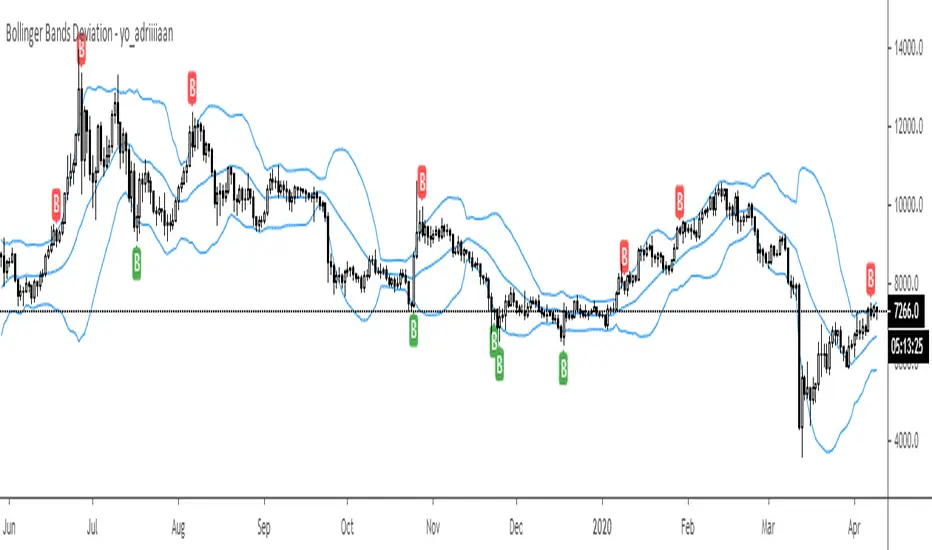
Bollinger Bands Deviation - yo_adriiiiaanBollinger Band Deviations
In theory price trades within 2 standard deviations 95% of the time. This is an attempt to capture that 5% that deviates from the bands.
Useful for taking profit or signaling a reversal.
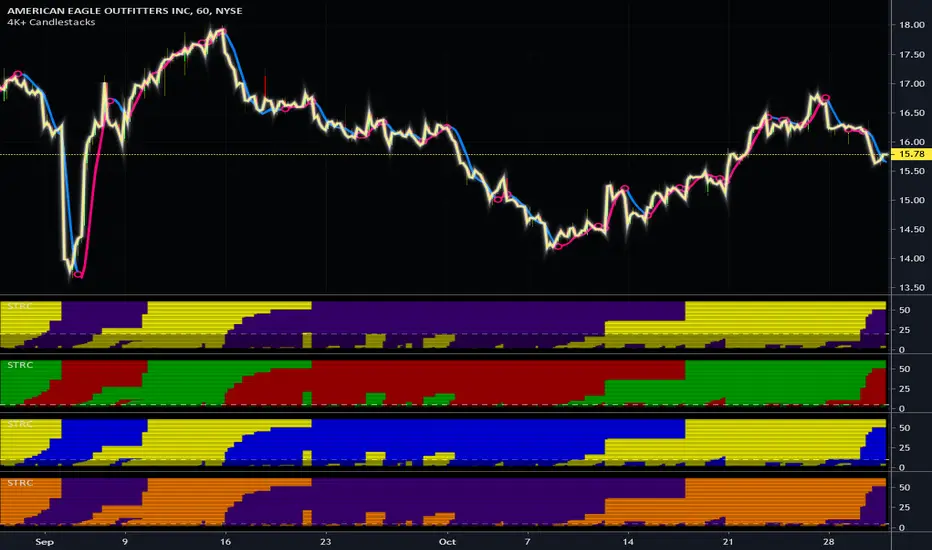
Simply Trendy RasterChartThis is my "Simply Trendy RasterChart" using PSv4.0 freely available to ALL! Simply Trendy, shown with the multiple color schemes on the bottom portion of the chart, is an indicator that differentiates with color between trending moments up and down, but is also effective at identifying trend reversals clearly. The bottom of the indicator is most reactive and indicates reversals, while the upper portion of the indicator commonly shows enduring trends. I included a horizontal rule to approximately gauge at what level you may wish to have before entering/exiting a trade upon identifying a trend change. This gizmo functions on all assets on time frames ranging from one second bars up to the "All" chart having monthly bars. Possible uses are quickly identifying assets that are not only opportunistic towards buying, but also selling/shorting when that time arrives later.
I decided to release this freely so members can become familiar with how my RasterCharts function. However, it may serve as another tool in the trend analysis tool belt you may want to have. It's the most basic of RasterCharts that I may have, and it gives the user an opportunity to witness/grasp RasterChart fundamental theory and operation in real time. Underneath the hood, the code is truly VERY SIMPLE also, hence the entitled name given. This was originally an experiment that turned out to be impressive, exceeding my expectations of attempting it. It's behavior is similarly close to my "TrendSetter RasterChart" and may serve as a trainer before acquiring that, any other RasterCharts I have currently, or shall create in the future. With that said, I hope you find this "simply" handy , and I'm also wishful for it to potentially garner a "trendy" reputation among the many members who may discover it.
I provided multiple color schemes for those of you who may have color blindness vision impairments. You may contact me in private if these color schemes are not suitable for your diagnosed visual impairment, and you would wish to contribute to seeing the color schemes improved along with other future indicators I shall release.
Features List Includes:
"Color Scheme" selection (all displayed above)
"RasterChart Transparency" control
"Source" selection
"Horizontal Rule" adjustment
The comments section below is solely just for commenting and other remarks, ideas, compliments, etc... regarding only this indicator, not others. When available time provides itself, I will consider your inquiries, thoughts, and concepts presented below in the comments section if you do have any questions or comments regarding this indicator. When my indicators achieve more prevalent use by TV members, I may implement more ideas when they present themselves as worthy additions. As always, "Like" it if you simply just like it with a proper thumbs up, and also return to my scripts list occasionally for additional postings. Have a profitable future everyone!
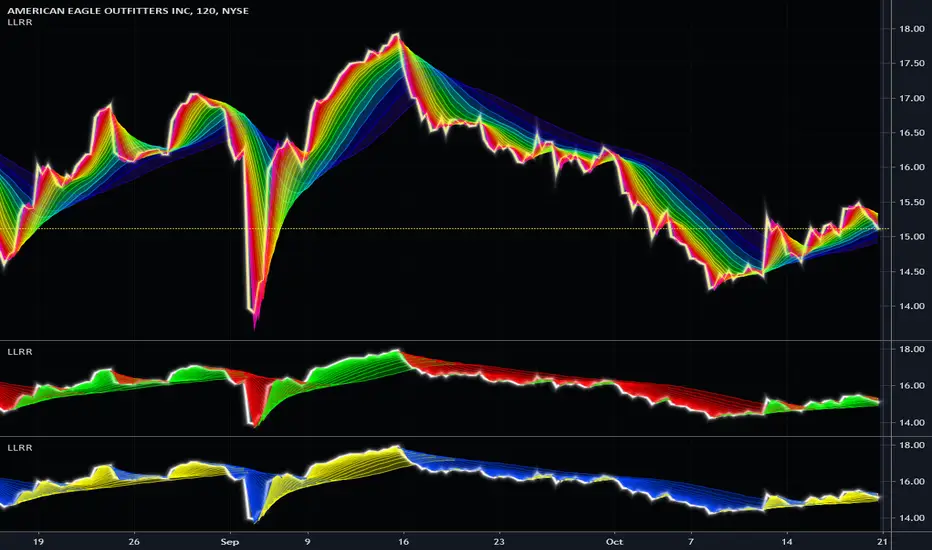
Lag-Less Rainbow RibbonThis is my polychromatic "Lag-Less Rainbow Ribbon" indicator using Pine Script version 4.0. I'm sure you may noticed by now, this indicator is truly an astounding rainbow to witness upon encountering it initially. It's jaw dropping beauty is the first of it's kind on TV, but will continue to shine here, or on your chart, so long as TV exists. This one isn't disappearing into non-existence any time soon.
It's extremely easy to use having only one input() to control the entire ribbon and it's lag. I couldn't make it any simpler to use, and that's one unique yet powerful feature of this elegant indicator. Another unique characteristic of deploying this in rainbow fashion is it provides very clear indications of when and where a significant reversal has occurred. Afterwards, trend direction following a large reversal is quickly established.
This script uses all 64 of the available plottable series TV will allow currently, so adding features to it may be impossible in the future. Yet the cloud handles it with ease and speed I have never encountered in a ribbon indicator before. The Pine Script in this indicator is highly optimized, coming in at a light weight 120+ lines of code, probably contributing to it's efficiency.
Lastly, with this flagship indicator, I included a multi-color "neon source" line to view close, hl2, etc... Any one of the two indicators may actually be enabled/disabled independently.
In the demonstration chart, you will witness the other color schemes available. I provided multiple color schemes for those of you who may have color blindness vision impairments. You may contact me in private, if these color schemes are not suitable for your diagnosed visual impairment, and you wish to contribute to seeing the color schemes improved along with other future indicators I shall release.
I.P.O.C.S.: "Initial Public Offering Clean Start" proprietary technology. Firstly, many of my other indicators already possess this capability. It allows suitable plotting from day one, minute one of IPO, remedying visually delayed signal analysis. It's basically accurate plotting from the very first bar (bar_index==0) on Tradingview. If you don't know what this is, most people don't, go back to the VERY beginning of any stock on the "All" chart and compare it to other similar indicators. What's so special about this? It is extremely difficult to get a healthy plot from bar_index==0 on any platform. However, I have become exceedingly talented performing this feat in most cases, but not all depending on the algorithm. This indicator is a successful accomplishment implementing IPOCS. It's inherent value is predominantly for IPO traders who in the past have had to wait 20, 50, and 150 bars before they obtain a precise indicator measurement for the simplest of algorithms in order to make a properly informed decision to potentially invest in an asset. How is this achieved? It's a highly protected secret of mine... but I will say I rarely use Pine built-in functions at all. When I do, I use them scarcely due to currently existing Pine language limitations.
Features List Includes:
I.P.O.C.S.(Initial Public Offering Clean Start) Technology
Enable/disable dark background for enhanced visibility
One "Lag Factor" adjustment to adjust them all
Color schemes
"Transparency" control
Independent "Source" options
This is not a freely available indicator, FYI. To witness my Pine poetry in action, properly negotiated requests for unlimited access, per indicator, may ONLY be obtained by direct contact with me using TV's "Private Chats" or by "Message" hidden in my member name above. The comments section below is solely just for commenting and other remarks, ideas, compliments, etc... regarding only this indicator, not others. When available time provides itself, I will consider your inquiries, thoughts, and concepts presented below in the comments section if you do have any questions or comments regarding this indicator. When my indicators achieve more prevalent use by TV members, I will implement more ideas when they present themselves as worthy additions. As always, "Like" it if you simply just like it with a proper thumbs up, and also return to my scripts list occasionally for additional postings. Have a profitable future everyone!
[LunaOwl] 反轉模式 (Bollinger %B Reversals)This is a tool using the Bollinger %B and Arnaud Legoux Moving Average (ALMA), it is a reliable tool for trading price action reversals.
腳本使用布林%B和ALMA,是一個可靠的逐棒分析反轉工具。
1. 英鎊兌美元 GBP / USD, 5 min
2. 美元兌日圓 USD / JPY, 5 min
3. 美元兌離岸人民幣 USD / CNH, 5 min
4. 日本 Sosei 生物製藥株式會社 Sosei Group Corporation, 5 min
5. 比特幣永續 Bitcoin for BitMEX, 5 min
6. 瑞波幣兌比特幣 XRP / BTC, Poloniex, 1 hour
7. 比特幣主導比率 Bitcoin Dominance Index, 4 hour
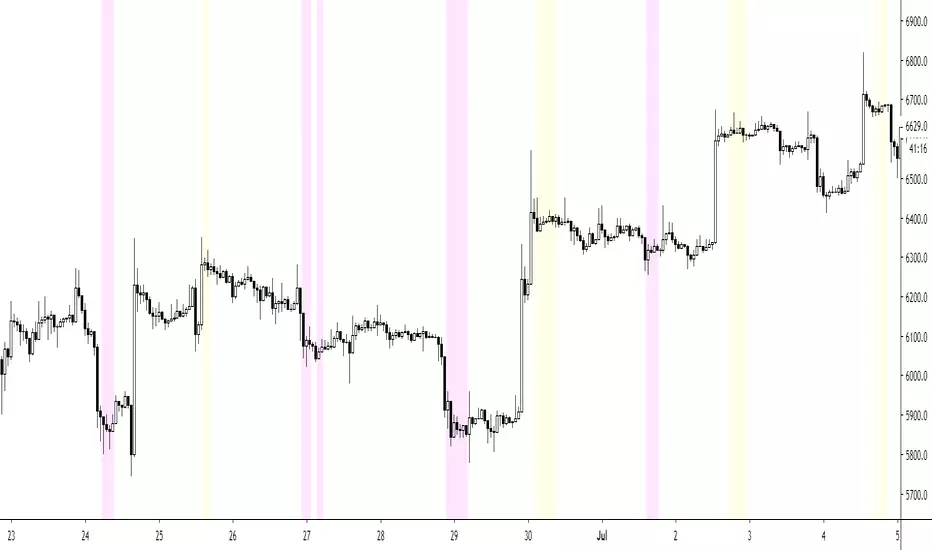
DBT MoMo ShadingThis indicator is an Add on to the DBT MoMo v.4.
Due to a conflict with the Oasis Trading Suite the DBT MoMo Candle Colors had to be turned off for now. To compensate we created a background shading indicator that will shade the same candles as before.
For Access or Questions: Private message us. Thank you.
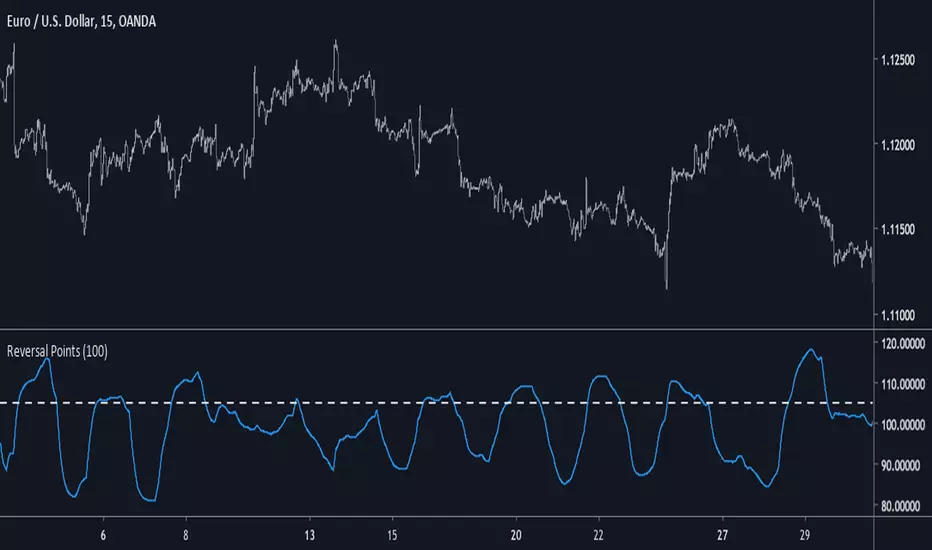
Reversal PointsIntroduction
This indicator is inspired from the mass index indicator with the goal of telling the user when a trend is about to stop thus highlighting potential reversals.
The Indicator
When the indicator cross under the trigger line the trend is about to stop and may reverse, shorter length will spot shorter terms reversals but a length of 100 is a good value.
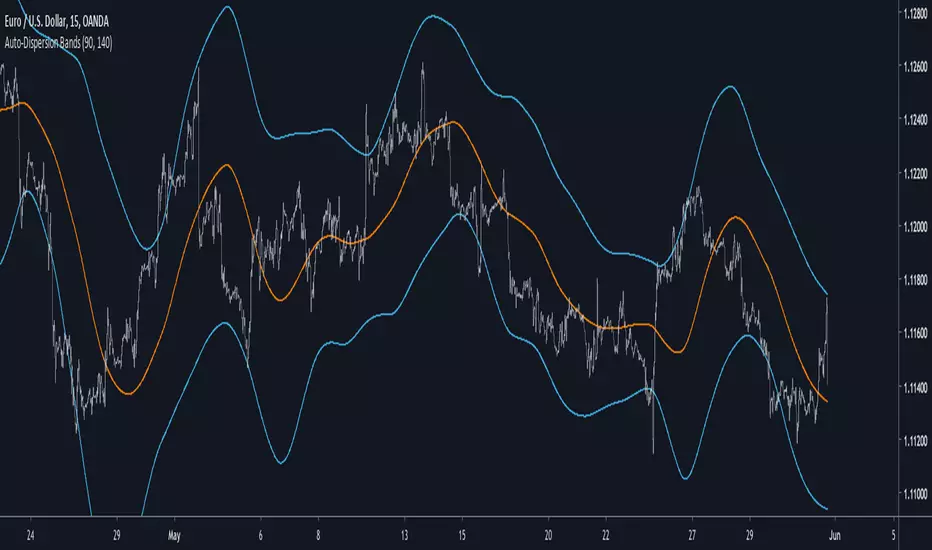
Auto-Dispersion BandsIntroduction
A really old indicator as well, thus i have no much ideas of what is going on with it, but i know that those bands returns good reversals points. The indicator don't use standard deviation, instead its a simple differencing of the price and the price length bars back who will provide a dispersion measurement, thus the name auto-dispersion.
The Indicator
The smooth parameter allow the band to cross the price, if smooth is low the chance of crosses are lower.
smooth = 3
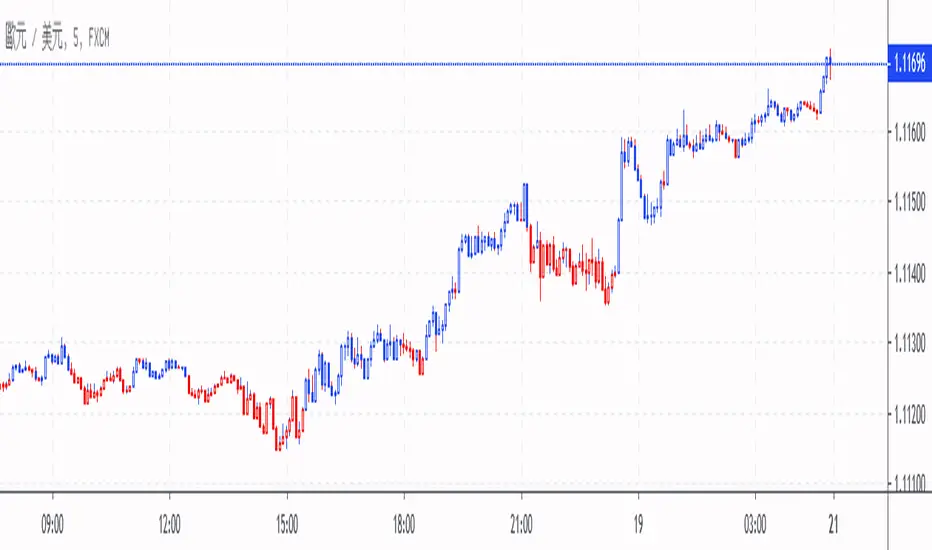
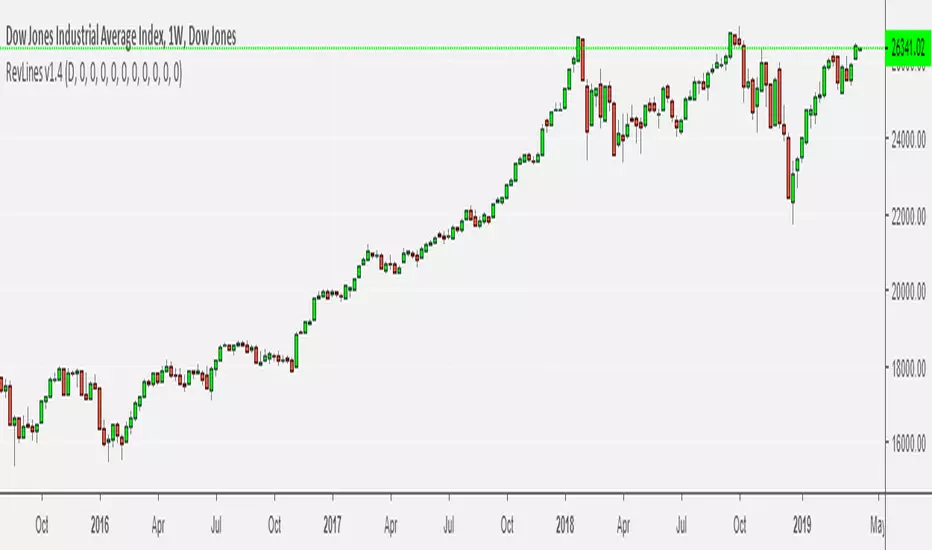
Reversal Lines v1.0Lightweight script for manual adding of horizontal reversal lines.
Ability to quickly add and adjust horizontal lines showing key bullish (green) and bearish (red) reversal lines. Values for reversals are manually entered in the settings field of the script.

Market direction and pullback based on S&P 500.A simple indicator based on www.swing-trade-stocks.com The link is also the guide for how to use it.
0 - nothing. If the indicator is showing 0 for a prolonged amount of time, it is likely the market is in "momentum mode" (referred to in the link above).
1 - indicates an uptrend based on SMA and EMA and also a place where a reversal to the upside is likely to occur. You should look only for long trades in the stock market when you see a spike upwards and S&P 500 is showing an obvious uptrend.
-1 - indicates a downtrend based on SMA and EMA and also a place where a reversal to the downside is likely to occur. You should look only for short trades in the stock market when you see a spike upwards and S&P 500 is showing an obvious uptrend.

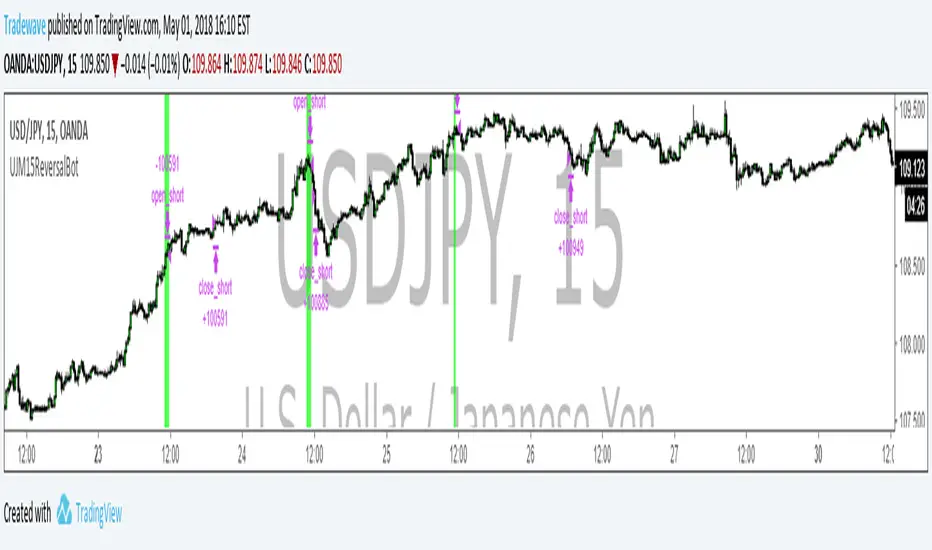
UJM15ReversalBotThis Strategy is specifically designed to trade on USDJPY intraday reversals on m15 time frame.
Bar Trends & Reversals Emiliano MesaThe most advanced code made by me yet! Simple but extremely useful, based on "Reading Price Charts Bar by Bar" - Al Brooks. This indicator will highlight when the market is trending (green). Highlight reversal bars(red) and also bull/bear traps (yellow). I was not sure if to give away this indicator for free, but here it is.
Hopefully you guys enjoy it!
Interested in your own indicator? Email me here for business inquires : emilianomesauribe2000@live.com
(starting price 100$)
I DO NO TAKE RESPONSIBILITY FOR LOSSES. USE INDICATOR UNDER YOUR OWN MEANS