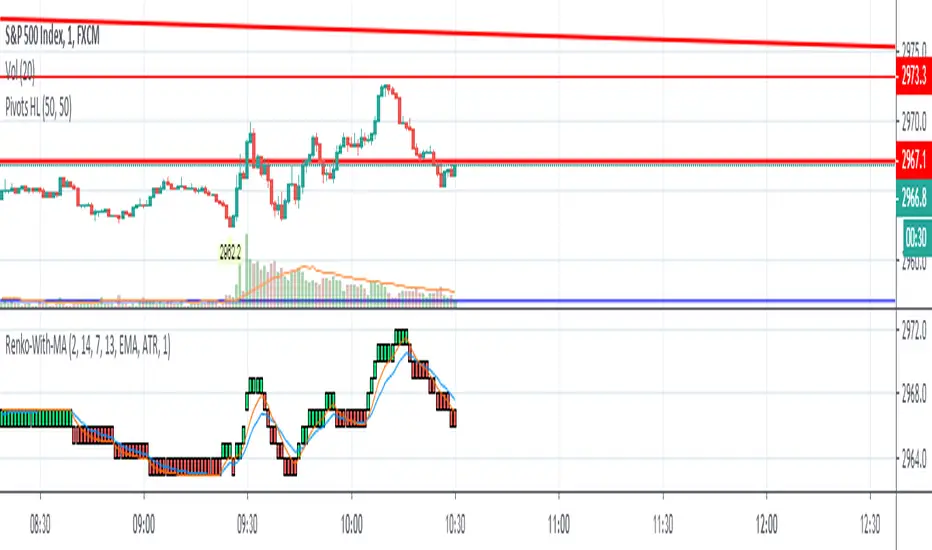
Renko MTF - Traditional and ATRSomehow there aren't too many renko bars that have the traditional setting built-in so I put one up. This one has the option to choose between Traditional and ATR, the size number corresponds to the option that was chosen. And just in case if anyone wanted, I put up a multi-time frame option to choose the time frame the bars take place. D is for day, W is for week, flat numbers are in minutes, and leaving it blank looks at the current time frame the chart is in. The calculation comes from how Tradingview handles renko bars.
Renko bars don't paint a color unless the market moves a certain amount based on its settings. When the market moves up it turns green, if it moves down it turns red, simple color changes alone can say a lot. They're a good way to try to find trends somewhat objectively and seem to be a good way to eliminate time and can replace other time-based indicators that can whipsaw or lag. The bars have a tendency to repeat themselves so it's a good way to find trends. There aren't too many settings for the box size, most people either just choose 5, 10, 14, etc where as other indicators have many options that differ on different markets. The numbers can be chosen easily enough to pick a sweet spot with just a single input where other indicators such as MACD have multiple inputs to pick the right number that can make it difficult to choose from(although it won't be as precise as a MACD would sometimes but can be worth the objectiveness and consistency and same setting repeatability in different markets in my opinion). Some example strategies could be to use them as an alternative trailing stop, finding trends, a simple color change for entry and exit on top of other strategies, etc. It can do the job of many in an all in one price action type indicator(although not better all the time, it can come close enough). Despite all this, it does seem to depend on which time-frame it's being looked at, how TV does the calculation for it, and how one can use this with the lack of practical information on it out there.
Renko

Hancock - Renko Brick ProductionThis is the accompanying script that shows how many renko bricks were produced in each direction per candle. It gives a basic indication of volatility, some might find it useful.
Happy trading
Hancock

Hancock - RenkoThis is the first release of Renko indicator.
Renko is plotted over candles and best calculates the number of Renko bricks printed up or down per candle which can be viewed from the data window. It plots the high and low of a the bricks, if numerous bricks are printed on a candle, as well as the open and close of a Renko brick.
This will be actively developed and improved over the next few months and i will be basing other indicators from this Renko.
Happy trading
Hancock

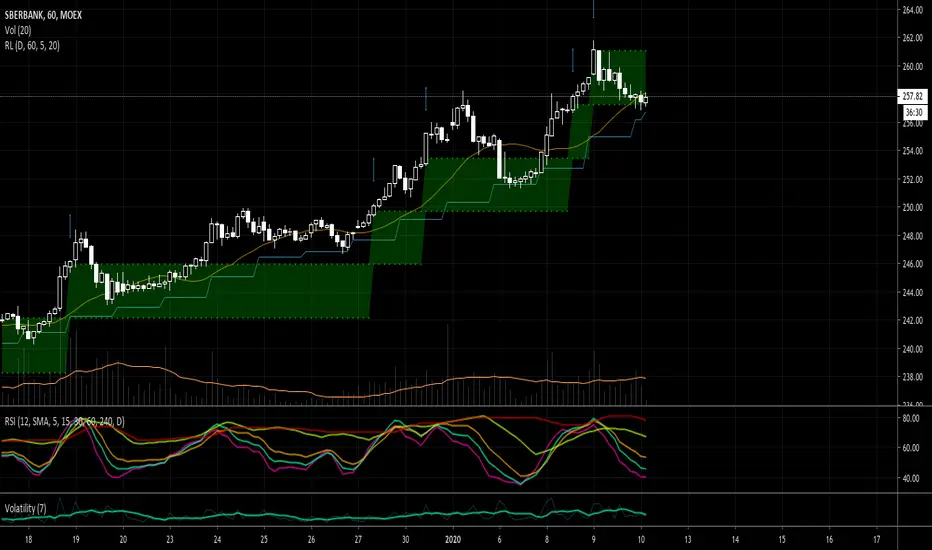
Up/Down Trend MarkerA simple indicator of trend by using 3 EMAs of multiplies of 2, 5 and 10, filtered by standard positive/negative directional movements (DM) which are the base of Average Directional Index (ADX).
The "Trend Strength" option is included to set the EMA multipliers and also the variation between DM+ and DM- which interpret the trend as a weak or a strong one.
Note that the markers only point to almost the beginning of the trends and just change the direction when the opposite trend is detected.
Feel free to send me your opinions.

RenkoNow you can plot a "Renko" chart on any timeframe for free! As with my previous algorithm, you can plot the "Linear Break" chart on any timeframe for free!
I again decided to help TradingView programmers and wrote code that converts a standard candles / bars to a "Renko" chart. The built-in renko() and security() functions for constructing a "Renko" chart are working wrong. Do not try to write strategies based on the built-in renko() function! The developers write in the manual: "Please note that you cannot plot Renko bricks from Pine script exactly as they look. You can only get a series of numbers similar to OHLC values for Renko bars and use them in your algorithms". However, it is possible to build a "Renko" chart exactly like the "Renko" chart built into TradingView. Personally, I had enough Pine Script functionality.
For a complete understanding of how such a chart is built, you can read to Steve Nison's book "BEYOND JAPANESE CANDLES" and see the instructions for creating a "Renko" chart:
Rule 1: one white brick (or series) is built when the price rises above the base price by a fixed threshold value or more.
Rule 2: one black brick (or series) is built when the price falls below the base price by a fixed threshold or more.
Rule 3: if the rise or fall of the price is less than the minimum fixed value, then new bricks are not drawn.
Rule 4: if today's closing price is higher than the maximum of the last brick (white or black) by a threshold or more, move to the column to the right and build one or more white bricks of equal height. A new brick begins with the maximum of the previous brick.
Rule 5: if today's closing price is below the minimum of the last brick (white or black) by a threshold or more, move to the column to the right and build one or more black bricks of equal height. A new brick begins with the minimum of the previous brick.
Rule 6: if the price is below the maximum or above the minimum, then new bricks are not drawn on the chart.
So my algorithm can to plot Traditional Renko with a fixed box size. I want to note that such a "Renko" chart is slightly different from the "Renko" chart built into TradingView, because as a base price I use (by default) close of first candle. How the developers of TradingView calculate the base price I don’t know. Personally, I do as written in the book of Steve Neeson.
The algorithm is very complicated and I do not want to explain it in detail. I will explain very briefly. The first part of the get_renko () function — // creating lists — creates two lists that record how many green bricks should be and how many red bricks. The second part of the get_renko () function — // creating open and close series — creates open and close series to plot bricks. So, this is a white box - study it!
As you understand, one green candle can create a condition under which it will be necessary to plot, for example, 10 green bricks. So the smaller the box size you make, the smaller the portion of the chart you will see.
I stuffed all the logic into a wrapper in the form of the get_renko() function, which returns a tuple of OHLC values. And these series with the help of the plotcandle() annotation can be converted to the "Renko" chart. I also want to note that with a large number of candles on the chart, outrages about the buffer size uncertainty are heard from the TradingView blackbox. Because of it, in the annotation study() set the value of the max_bars_back parameter.
In general, use this script (for example, to write strategies)!

Brick count (Renko)Brick is a part of Renko chart. It is reasonable to think, that is the number of green brick is higher than the number of red brick then the trend is bullish. This indicator plots the relative number of red bricks vs green bricks.

Renko AccelerationRenko is a very useful charting method for analyzing stock movement. It does a great job of filtering out all the excess noise so that all we're left with is pure price action. But, what about time? Time is a fundamental part of chart analysis and we are only seeing part of the picture. After all, shouldn't we take a very different approach to trading signals from a block that renders in 2 seconds as opposed to a block that renders in 30 minutes?
This indicator provides the best of both worlds, enabling us to correlate the passing of time with price movement and clearly see when squeezes and breakouts occur.
As the indicator turns up to green we can see that volatility is on the move and the market is accelerating (breakout), and as it turns down to red the market is stagnating (squeeze). There is also an alternate 'Precise' view which renders the exact time per block for more granular analysis.

Renko Weis Wave VolumeThis is live and non-repainting Renko Weis Wave Volume tool. The tool has it’s own engine and not using integrated function of Trading View.
Renko charts ignore time and focus solely on price changes that meet a minimum requirement. Time is not a factor on Renko chart but as you can see with this script Renko RSI created on time chart.
Renko chart provide several advantages, some of them are filtering insignificant price movements and noise, focusing on important price movements and making support/resistance levels much easier to identify.
As source Closing price or High/Low can be used.
Traditional or ATR can be used for scaling. If ATR is chosen then there is rounding algorithm according to mintick value of the security. For example if mintick value is 0.001 and brick size (ATR/Percentage) is 0.00124 then box size becomes 0.001. And also while using dynamic brick size (ATR), box size changes only when Renko closing price changed.
This tool is based on the Weis Wave described by David H. Weis (a Wyckoff specialist). The Weis Waves Indicator sums up volumes in each wave. This is how we receive a bar chart of cumulative volumes of alternating waves and The cumulative volume makes the Weis wave charts unique.
If there is no volume information for the security then this tool has an option to use “True Range” instead of volume .
Better to use this script with the following one:
Enjoy!

Renko RSIThis is live and non-repainting Renko RSI tool. The tool has it’s own engine and not using integrated function of Trading View.
Renko charts ignore time and focus solely on price changes that meet a minimum requirement. Time is not a factor on Renko chart but as you can see with this script Renko RSI created on time chart.
Renko chart provide several advantages, some of them are filtering insignificant price movements and noise, focusing on important price movements and making support/resistance levels much easier to identify.
As source Closing price or High/Low can be used.
Traditional or ATR can be used for scaling. If ATR is chosen then there is rounding algorithm according to mintick value of the security. For example if mintick value is 0.001 and brick size (ATR/Percentage) is 0.00124 then box size becomes 0.001. And also while using dynamic brick size (ATR), box size changes only when Renko closing price changed.
Renko RSI is calculated by own Renko RSI algorithm.
Alerts added:
Renko RSI moved below Overbought level
Renko RSI moved above Overbought level
Renko RSI moved below Oversold level
Renko RSI moved above Oversold level
RSI length is 2 by default, you can set as you wish.
You better to use this script with the following one:
Enjoy!

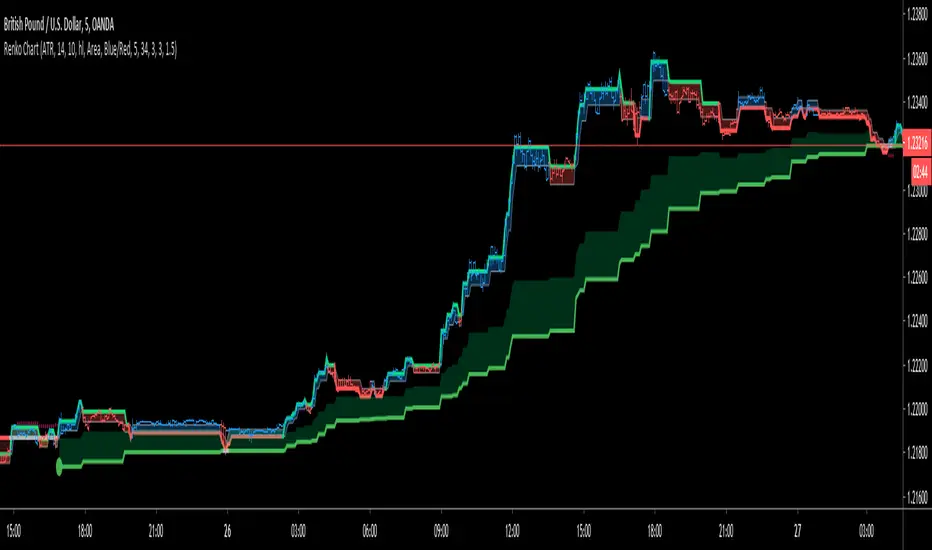
Renko ChartHello All. This is live and non-repainting Renko Charting tool. The tool has it’s own engine and not using integrated function of Trading View.
Renko charts ignore time and focus solely on price changes that meet a minimum requirement. Time is not a factor on Renko chart but as you can see with this script Renko chart created on time chart.
Renko chart provide several advantages, some of them are filtering insignificant price movements and noise, focusing on important price movements and making support/resistance levels much easier to identify.
in the script Renko Trend Line with threshold area is included. and also there is protection from whipsaws, so you can catch big waves with very good entry points. Trend line is calculated by EMA of Renko closing price.
As source Closing price or High/Low can be used. Traditional or ATR can be used for scaling. If ATR is chosen then there is rounding algorithm according to mintick value of the security. For example if mintick value is 0.001 and brick size (ATR/Percentage) is 0.00124 then box size becomes 0.001. And also while using dynamic brick size (ATR), box size changes only when Renko closing price changed.
Renko bar can be seen as area or candle and also optionally bar color changes when Renko trend changed.
Soon other Renko scripts (Renko RSI, Renko Weis Wave, Renko MACD etc) are coming ;)
ENJOY!
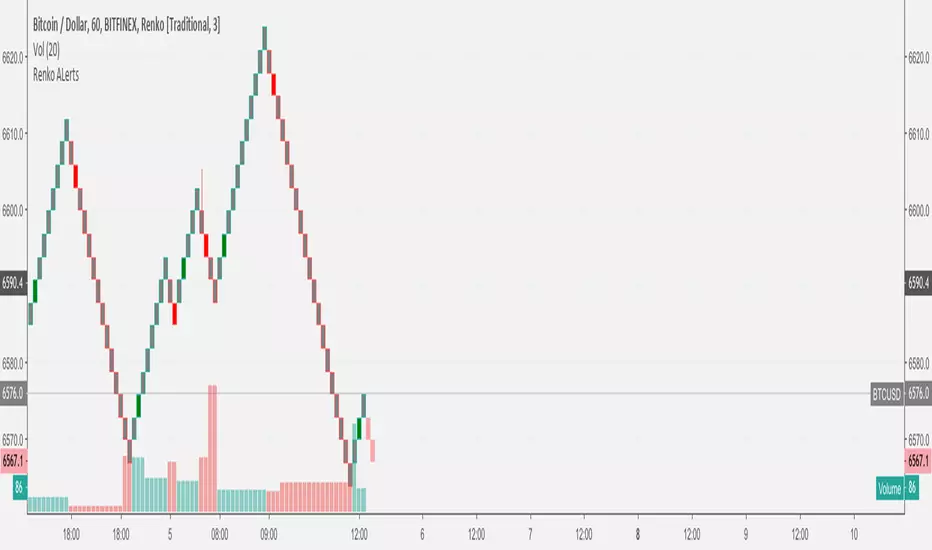
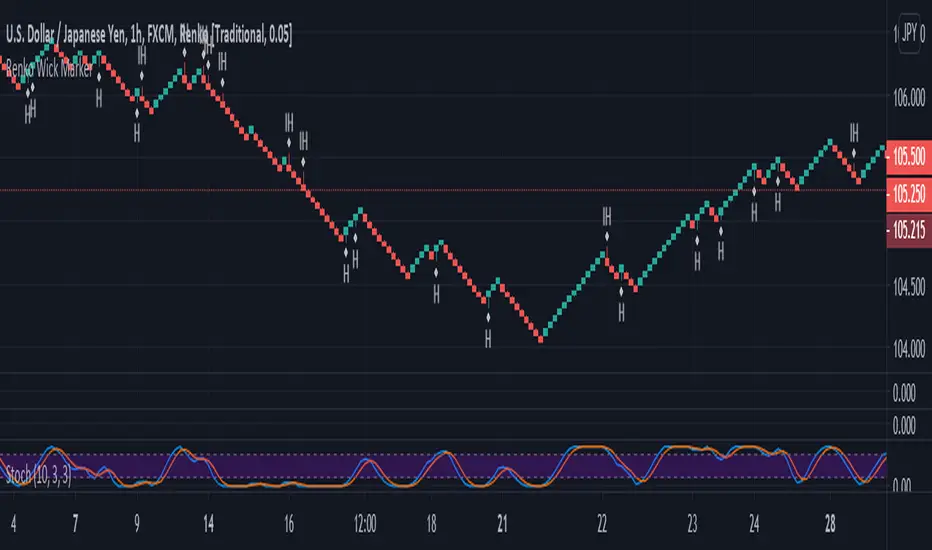
Renko Chart Alerts with PivotsAdd alerts to renko charts to be notified when:
new brick
brick up
brick down
direction change
direction change up
direction change down
Also shows pivots based on brick reversals. Alerts also available for:
pivot breakout
pivot high breakout
pivot low breakout
You can hide the plots for pivot high/low and breakouts in the style tab of the settings for the indicator.
To add the alerts:
add the indicator to your renko chart
click add alert
click the condition dropdown and choose Renko Alerts
you should see all the alerts there and you can add any one or more to your chart

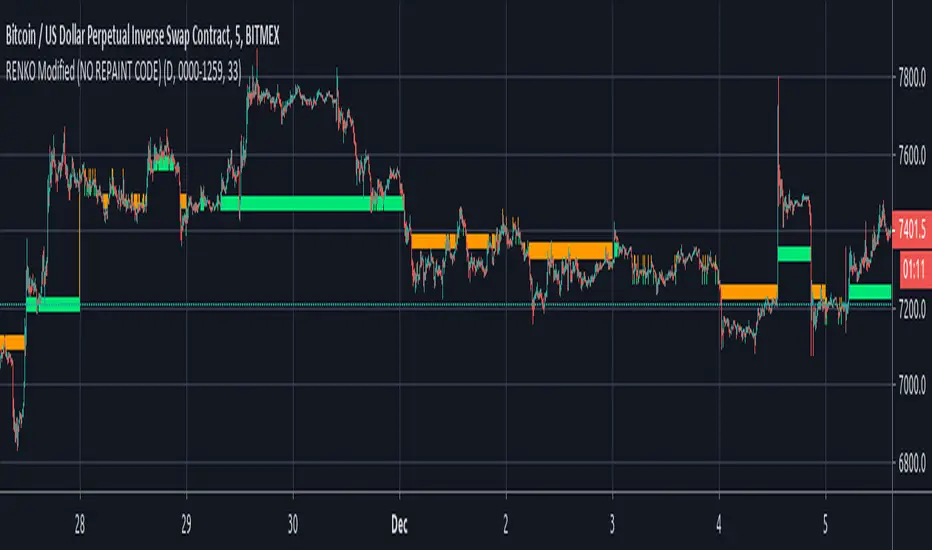
RENKO Modified (NO REPAINT CODE)I'm releasing this code in public Interest in hope of getting it improved by the community. If someone wants to use this code, then he/she should publish this code in Public Library with Open Source reference.
The code is entirely mine and not anyone else's.
I would love to see some imporvements to this code, so if you have any suggestions then let me know in the comments section and if someone can actually make it better than it would be great.
I'll share the logic for BUY and Sell upon agrreing on mutual terms.
As of this moment, the code simply plots Renko Bars, based on Daily Open.
I have added Daily close as an option in this, just in case someone wants it.
similarly you can call upon High and Low (for Obvious Reasons)
It CAN NOT REPAINT at all!!!!


[RESEARCH] Chart Type IdentifierA viable and workable concept of chart type identification using Pine Script.
Was wollen wir trinken , sieben Tage lang
Was wollen wir trinken, so ein Durst!
Was wollen wir trinken, sieben Tage lang
Was wollen wir trinken, so ein Durst!

[RESEARCH] Renko Chart IdentifierDespite I am not a big fan of Renko I spent some time to solve a common problem of chart type identification using absolutely obvious technique: Renko bricks have the same size. That's all. Not a cutting-edge maths.
This tool allows to identify:
ATR Renko charts (see ^)
Traditional Renko charts
Here is example for Traditional Renko:
It also works correctly with other chart types:
Classic Candles
Heikin-Ashi
Kagi
PnF
Range Bars
Remember @everget !
And pay attention to the license before use)


RENKO MTFMultiframe RENKO panes with timeframe-weighted signal line and warning dots. All timeframes in settings MUST be <= your timeframe or it will repains on bigger timeframes.